It is becoming increasingly fashionable to ascribe another mandate to central bankers:
“Society has given our central bankers worldwide the responsibility for macro-prudential risk, all the risk in the system, not just the risk in the banking system,” Fink said at the Credit Suisse Global Megatrends conference. “I don’t think there is enough talk about what are the costs of the low rate environment to the other components of our global society — pension funds, retirees, savers, and insurance companies.”
[Axa SA’s Henri] De Castries in 2013 called central bank policies a form of “financial repression” that forced savers to rescue the banking system.
A spokesman for Canada’s Ministry of Finance recently endorsed the idea:
Specifically, we use more and better data to assist our financial system monitoring, backed by deeper conversations and models where appropriate, to make more informed judgments about financial stability risks. We’ve added other potential sources of vulnerability, such as the balance sheets of households, companies and banks, to our macroeconomic models.
We’re also making progress toward a better understanding of how monetary policy actions influence risk taking. For example, when a central bank cuts interest rates to cushion the economy from a shock, the hope is that people will borrow more at that lower interest rate and spend more money. What this means is that financial imbalances are a necessary by-product of monetary policy action, especially if the action is prolonged, so these additional adjustment dynamics must be fully taken into account when conducting policy.
Clearly, though, incorporating financial stability into our monetary policy framework remains a work in progress. As a practitioner, it still feels to me like we are adding various rooms onto a house we love, rather than creating a new, elegant and coherent structure. We need to make sure there’s enough flexibility and clarity about the role of financial stability in our monetary policy framework. We need to better understand how macroprudential policies – such as mortgage insurance rules – that are aimed at promoting financial stability interact with monetary policy.
…
The Bank has been setting policy with a view to balancing the risks facing both the outlook for returning inflation sustainably to its target, and the risks to financial stability such as those posed by the indebtedness of Canadian households. The sudden drop in global oil prices has increased both risks. The oil-price shock is an important setback in our progress toward full capacity, full employment and stable inflation because it is a net negative for economic growth. And because lower oil prices mean lower Canadian income, the shock will worsen the debt-to-income ratio of Canadian households, thereby increasing financial stability risks.
This is absurd mission-creep, which will lead to yet another layer of unaccountable bureaucrats stifling innovation and competition while bloating the financial system and collecting large pay-cheques.
For example, the reincarnation of King Canute rules in Denmark, holding back the tides of speculators responding to economic reality:
Denmark halted government bond auctions on Jan. 30 as part of a series of steps designed to deter investors from pouring into AAA-rated krone assets. Speculation the central bank may need to abandon its currency peg soared after Switzerland dropped its euro cap on Jan. 15. The International Monetary Fund has since declared Denmark triumphant in its battle against speculators, and said the central bank’s handling of the matter added to its credibility.
The central bank’s acknowledgment that Denmark’s bond market may need some liquidity support follows criticism from some of the country’s biggest institutional investors. PFA A/S, Denmark’s largest commercial pension fund, has said the suspension of bond sales is killing liquidity and creating an “unsustainable situation.”
Meanwhile, the Canadian government cemented the structural deficit:
Canada cut its projected surpluses by C$18 billion ($14.7 billion) over the next five years as the federal government copes with the impact of lower oil prices and seeks to finance new tax cuts ahead of an October election.
Canada’s federal government will post a surplus of C$1.4 billion for the fiscal year that began April 1, ending a seven-year run of deficits, aided by the sale of shares in General Motors Co. and by reducing its buffer for emergencies. Surpluses will grow to as high as C$4.8 billion by 2019 as government income recovers.
…
Harper’s almost decade-long, three-term record of wholesale tax cuts has been marred by the run-up of debt totaling almost C$150 billion since the 2008-2009 recession.
Wow, $4.8-billion! I guess the take-away is that we only expect a recession every thirty years or so. Good times!
It was a moderately good day for the Canadian preferred share market, with PerpetualDiscounts winning 31bp, FixedResets gaining 3bp and DeemedRetractibles up 5bp. Volatility continued to be high, as reported on the Performance Highlights table, with FixedResets making up large complements of both winners and losers. Volume was very high, with TRP issues prominent.
For as long as the FixedReset market is so violently unsettled, I’ll keep publishing updates of the more interesting and meaningful series of FixedResets’ Implied Volatilities. This doesn’t include Enbridge because although Enbridge has a large number of issues outstanding, all of which are quite liquid, the range of Issue Reset Spreads is too small for decent conclusions. The low is 212bp (ENB.PR.H; second-lowest is ENB.PR.D at 237bp) and the high is a mere 268 for ENB.PF.G.
Remember that all rich /cheap assessments are:
» based on Implied Volatility Theory only
» are relative only to other FixedResets from the same issuer
» assume constant GOC-5 yield
» assume constant Implied Volatility
» assume constant spread
Here’s TRP:
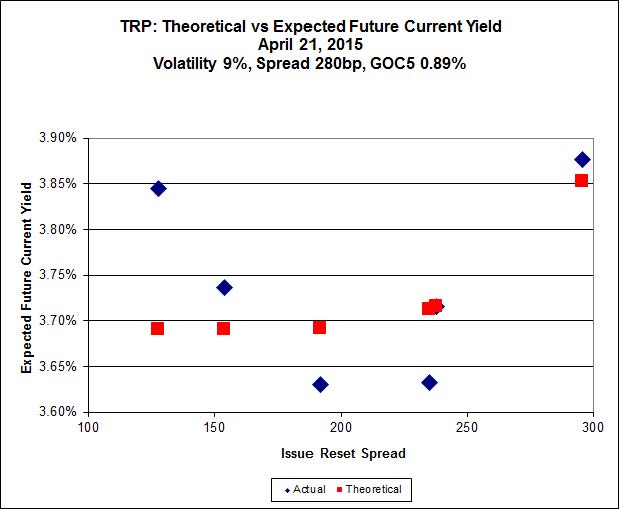
Click for Big
TRP.PR.E, which resets 2019-10-30 at +235, is bid at 22.30 to be $0.48 rich, while TRP.PR.B, resetting 2015-6-30 at +128, is $0.59 cheap at its bid price of 14.11.

Click for Big
Another excellent fit, but the numbers are perplexing. Implied Volatility for MFC continues to be a conundrum, although it declined substantially today. It is still too high if we consider that NVCC rules will never apply to these issues; it is still too low if we consider them to be NVCC non-compliant issues (and therefore with Deemed Maturities in the call schedule).
Most expensive is MFC.PR.I, resetting at +286 on 2017-9-19, bid at 25.05 to be $0.43 rich, while MFC.PR.K, resetting at +222bp on 2018-9-19, is bid at 21.55 to be $0.48 cheap.
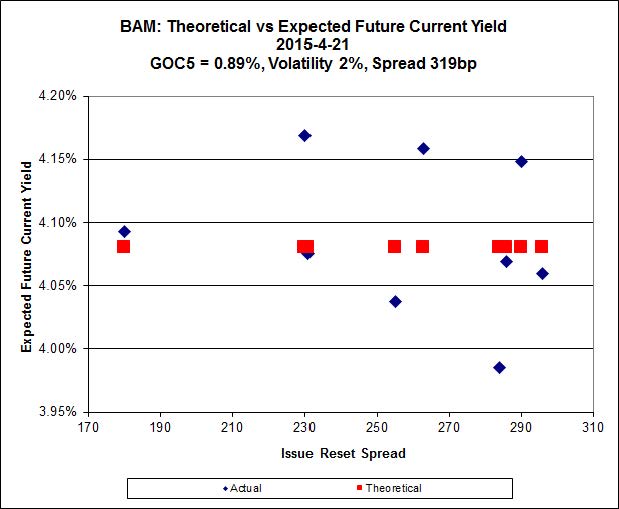
Click for Big
This fit is actually quite good.
The cheapest issue relative to its peers is BAM.PR.R, resetting at +230bp on 2016-6-30, bid at 19.13 to be $0.42 cheap. BAM.PF.G, resetting at +284bp 2020-6-30 is bid at 23.40 and appears to be $0.54 rich.
Click for Big
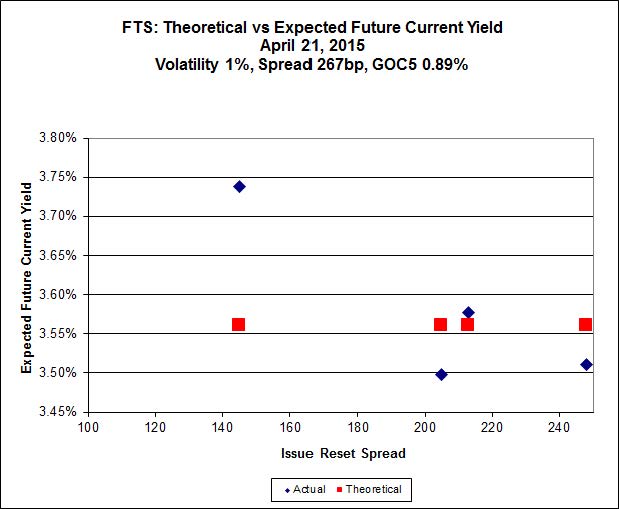
This is just weird because the middle is expensive and the ends are cheap but anyway … FTS.PR.H, with a spread of +145bp, and bid at 15.65, looks $0.78 cheap and resets 2015-6-1. FTS.PR.K, with a spread of +205bp and resetting 2019-3-1, is bid at 21.01 and is $0.32 rich.
Click for Big
Investment-grade pairs now predict an average over the next five years of about 0.30%. The DC.PR.B / DC.PR.D pair is just a dumb number, since the Toronto Stock Exchange reports a bid of 15.00 for the latter issue, despite the fact that there were no trades today and the close Monday was 20.14. It is not clear whether the idiotic quote is due to the TSX’s peculiar reporting practices or their inadequate supervision of market makers.
Click for Big
Shall we just say that this exhibits a high level of confidence in the continued rapacity of Canadian banks?
| HIMIPref™ Preferred Indices These values reflect the December 2008 revision of the HIMIPref™ Indices Values are provisional and are finalized monthly |
|||||||
| Index | Mean Current Yield (at bid) |
Median YTW |
Median Average Trading Value |
Median Mod Dur (YTW) |
Issues | Day’s Perf. | Index Value |
| Ratchet | 0.00 % | 0.00 % | 0 | 0.00 | 0 | 0.6154 % | 2,196.6 |
| FixedFloater | 0.00 % | 0.00 % | 0 | 0.00 | 0 | 0.6154 % | 3,840.6 |
| Floater | 3.30 % | 3.47 % | 57,249 | 18.61 | 4 | 0.6154 % | 2,335.1 |
| OpRet | 4.43 % | -2.13 % | 41,319 | 0.11 | 2 | 0.0394 % | 2,763.2 |
| SplitShare | 4.56 % | 4.58 % | 63,978 | 3.40 | 3 | 0.1334 % | 3,230.2 |
| Interest-Bearing | 0.00 % | 0.00 % | 0 | 0.00 | 0 | 0.0394 % | 2,526.6 |
| Perpetual-Premium | 5.33 % | 1.73 % | 65,918 | 0.09 | 25 | 0.0263 % | 2,516.3 |
| Perpetual-Discount | 5.11 % | 5.10 % | 145,822 | 15.10 | 9 | 0.3119 % | 2,791.8 |
| FixedReset | 4.63 % | 3.95 % | 278,838 | 16.13 | 85 | 0.0290 % | 2,311.3 |
| Deemed-Retractible | 4.91 % | 3.48 % | 108,589 | 0.68 | 36 | 0.0453 % | 2,651.8 |
| FloatingReset | 2.58 % | 2.94 % | 74,599 | 6.23 | 8 | -0.0287 % | 2,346.0 |
| Performance Highlights | |||
| Issue | Index | Change | Notes |
| ENB.PF.G | FixedReset | -2.45 % | YTW SCENARIO Maturity Type : Limit Maturity Maturity Date : 2045-04-21 Maturity Price : 20.34 Evaluated at bid price : 20.34 Bid-YTW : 4.73 % |
| BAM.PF.B | FixedReset | -1.58 % | YTW SCENARIO Maturity Type : Limit Maturity Maturity Date : 2045-04-21 Maturity Price : 21.16 Evaluated at bid price : 21.16 Bid-YTW : 4.34 % |
| TRP.PR.F | FloatingReset | -1.37 % | YTW SCENARIO Maturity Type : Limit Maturity Maturity Date : 2045-04-21 Maturity Price : 18.00 Evaluated at bid price : 18.00 Bid-YTW : 3.54 % |
| NA.PR.W | FixedReset | -1.34 % | YTW SCENARIO Maturity Type : Limit Maturity Maturity Date : 2045-04-21 Maturity Price : 22.58 Evaluated at bid price : 23.56 Bid-YTW : 3.42 % |
| BAM.PR.R | FixedReset | -1.19 % | YTW SCENARIO Maturity Type : Limit Maturity Maturity Date : 2045-04-21 Maturity Price : 19.13 Evaluated at bid price : 19.13 Bid-YTW : 4.35 % |
| ENB.PR.P | FixedReset | -1.05 % | YTW SCENARIO Maturity Type : Limit Maturity Maturity Date : 2045-04-21 Maturity Price : 19.70 Evaluated at bid price : 19.70 Bid-YTW : 4.51 % |
| FTS.PR.G | FixedReset | -1.03 % | YTW SCENARIO Maturity Type : Limit Maturity Maturity Date : 2045-04-21 Maturity Price : 21.11 Evaluated at bid price : 21.11 Bid-YTW : 3.78 % |
| BAM.PF.F | FixedReset | -1.03 % | YTW SCENARIO Maturity Type : Limit Maturity Maturity Date : 2045-04-21 Maturity Price : 22.33 Evaluated at bid price : 23.04 Bid-YTW : 4.22 % |
| BAM.PR.X | FixedReset | -1.02 % | YTW SCENARIO Maturity Type : Limit Maturity Maturity Date : 2045-04-21 Maturity Price : 16.43 Evaluated at bid price : 16.43 Bid-YTW : 4.44 % |
| CM.PR.P | FixedReset | -1.01 % | YTW SCENARIO Maturity Type : Limit Maturity Maturity Date : 2045-04-21 Maturity Price : 22.56 Evaluated at bid price : 23.51 Bid-YTW : 3.40 % |
| FTS.PR.M | FixedReset | 1.05 % | YTW SCENARIO Maturity Type : Limit Maturity Maturity Date : 2045-04-21 Maturity Price : 22.80 Evaluated at bid price : 24.00 Bid-YTW : 3.62 % |
| ENB.PR.H | FixedReset | 1.05 % | YTW SCENARIO Maturity Type : Limit Maturity Maturity Date : 2045-04-21 Maturity Price : 17.25 Evaluated at bid price : 17.25 Bid-YTW : 4.67 % |
| FTS.PR.H | FixedReset | 1.16 % | YTW SCENARIO Maturity Type : Limit Maturity Maturity Date : 2045-04-21 Maturity Price : 15.65 Evaluated at bid price : 15.65 Bid-YTW : 3.76 % |
| MFC.PR.B | Deemed-Retractible | 1.20 % | YTW SCENARIO Maturity Type : Hard Maturity Maturity Date : 2025-01-31 Maturity Price : 25.00 Evaluated at bid price : 24.50 Bid-YTW : 4.99 % |
| PWF.PR.P | FixedReset | 1.21 % | YTW SCENARIO Maturity Type : Limit Maturity Maturity Date : 2045-04-21 Maturity Price : 17.60 Evaluated at bid price : 17.60 Bid-YTW : 3.64 % |
| PWF.PR.A | Floater | 1.51 % | YTW SCENARIO Maturity Type : Limit Maturity Maturity Date : 2045-04-21 Maturity Price : 17.52 Evaluated at bid price : 17.52 Bid-YTW : 2.87 % |
| PWF.PR.T | FixedReset | 1.57 % | YTW SCENARIO Maturity Type : Limit Maturity Maturity Date : 2045-04-21 Maturity Price : 23.10 Evaluated at bid price : 24.52 Bid-YTW : 3.39 % |
| TRP.PR.C | FixedReset | 1.63 % | YTW SCENARIO Maturity Type : Limit Maturity Maturity Date : 2045-04-21 Maturity Price : 16.26 Evaluated at bid price : 16.26 Bid-YTW : 3.81 % |
| MFC.PR.F | FixedReset | 2.00 % | YTW SCENARIO Maturity Type : Hard Maturity Maturity Date : 2025-01-31 Maturity Price : 25.00 Evaluated at bid price : 17.35 Bid-YTW : 6.98 % |
| TRP.PR.B | FixedReset | 2.32 % | YTW SCENARIO Maturity Type : Limit Maturity Maturity Date : 2045-04-21 Maturity Price : 14.11 Evaluated at bid price : 14.11 Bid-YTW : 3.84 % |
| MFC.PR.N | FixedReset | 2.94 % | YTW SCENARIO Maturity Type : Hard Maturity Maturity Date : 2025-01-31 Maturity Price : 25.00 Evaluated at bid price : 22.75 Bid-YTW : 4.74 % |
| Volume Highlights | |||
| Issue | Index | Shares Traded |
Notes |
| BNS.PR.M | Deemed-Retractible | 150,834 | Scotia sold 15,500 to Canaccord at 25.27, then three blocks of 10,000 each to RBC, all at 25.25. RBC crossed 50,000 at 25.28; TD crossed 40,000 at 25.28. YTW SCENARIO Maturity Type : Call Maturity Date : 2016-07-27 Maturity Price : 25.00 Evaluated at bid price : 25.28 Bid-YTW : 3.51 % |
| PWF.PR.R | Perpetual-Premium | 65,660 | Nesbitt crossed 35,000 at 26.33. YTW SCENARIO Maturity Type : Call Maturity Date : 2021-04-30 Maturity Price : 25.00 Evaluated at bid price : 26.27 Bid-YTW : 4.53 % |
| TRP.PR.B | FixedReset | 61,297 | TD crossed 45,000 at 14.16. YTW SCENARIO Maturity Type : Limit Maturity Maturity Date : 2045-04-21 Maturity Price : 14.11 Evaluated at bid price : 14.11 Bid-YTW : 3.84 % |
| TRP.PR.C | FixedReset | 54,177 | RBC crossed 38,000 at 16.21. YTW SCENARIO Maturity Type : Limit Maturity Maturity Date : 2045-04-21 Maturity Price : 16.26 Evaluated at bid price : 16.26 Bid-YTW : 3.81 % |
| TRP.PR.E | FixedReset | 45,003 | Scotia crossed 40,000 at 22.40. YTW SCENARIO Maturity Type : Limit Maturity Maturity Date : 2045-04-21 Maturity Price : 21.87 Evaluated at bid price : 22.30 Bid-YTW : 3.85 % |
| CM.PR.Q | FixedReset | 38,798 | YTW SCENARIO Maturity Type : Limit Maturity Maturity Date : 2045-04-21 Maturity Price : 23.05 Evaluated at bid price : 24.72 Bid-YTW : 3.60 % |
| There were 54 other index-included issues trading in excess of 10,000 shares. | |||
| Wide Spread Highlights | ||
| Issue | Index | Quote Data and Yield Notes |
| BNS.PR.Y | FixedReset | Quote: 21.80 – 22.53 Spot Rate : 0.7300 Average : 0.4284 YTW SCENARIO |
| PWF.PR.S | Perpetual-Premium | Quote: 24.34 – 24.69 Spot Rate : 0.3500 Average : 0.2240 YTW SCENARIO |
| RY.PR.H | FixedReset | Quote: 23.63 – 24.03 Spot Rate : 0.4000 Average : 0.3048 YTW SCENARIO |
| CIU.PR.C | FixedReset | Quote: 15.71 – 16.29 Spot Rate : 0.5800 Average : 0.4952 YTW SCENARIO |
| PVS.PR.C | SplitShare | Quote: 25.33 – 25.58 Spot Rate : 0.2500 Average : 0.1883 YTW SCENARIO |
| ENB.PR.A | Perpetual-Premium | Quote: 25.37 – 25.75 Spot Rate : 0.3800 Average : 0.3200 YTW SCENARIO |