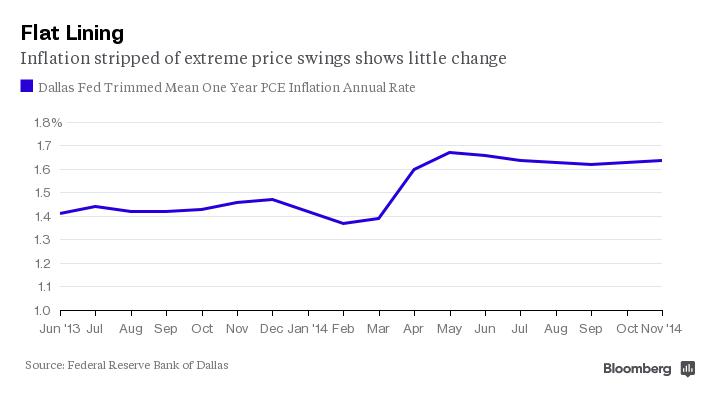
The prospects for global deflation are attracting a lot of ink:
European and Chinese factories slashed prices in January as production flat-lined, heightening global deflation risks that point to another wave of central bank stimulus in the coming year.
While the pulse of activity was livelier in other parts of Asia – Japan, India and South Korea – they too shared a common condition of slowing inflation.
…
Markit’s final PMI reading for the euro zone, published on Monday, was 51.0, in line with the flash estimate. Although at a six-month high, it was only just above the 50 mark that separates growth from contraction. In December the index came in at 50.6.Worryingly for policymakers, firms cut prices in January at the steepest rate since mid-2013. Data on Friday showed annual inflation was a record-equalling low of –0.6 per cent in January across the 19 nations using the euro.
In Britain, manufacturing grew slightly faster but factories cut prices at the fastest pace since 2009.
There’s a new estimate for Treasury liquidity:
For decades, the $12.5 trillion market for U.S. government debt was renowned for its “depth,” Wall Street’s way of talking about a market’s ability to handle large trades without big moves in prices. But lately, that resiliency has practically vanished — and that’s a big worry.
Less depth has meant greater volatility. So Treasuries — the world’s haven asset during turmoil — may be prone to more disruptions, particularly as the Federal Reserve prepares to raise interest rates. And if investors begin to doubt whether they’ll still be able to buy and sell on a moment’s notice, that has the potential to elevate the U.S.’s cost to borrow.
How much depth has the market lost? A year ago, you could trade about $280 million of Treasuries without causing prices to move, according to JPMorgan Chase & Co. Now, it’s $80 million.
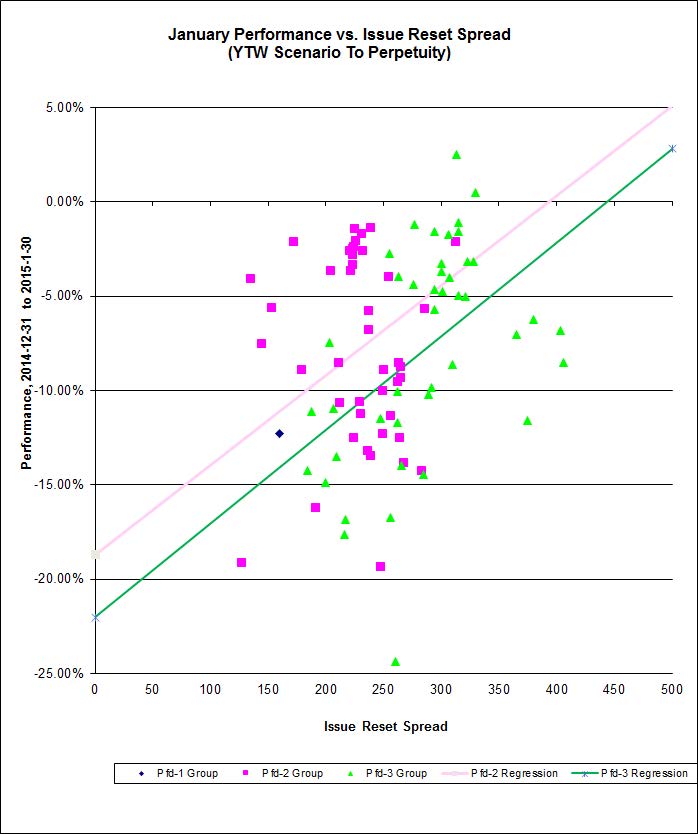
It was a mixed day for the Canadian preferred share market, with PerpetualDiscounts up 54bp, FixedResets gaining 9bp and DeemedRetractibles off 6bp. The relatively mild index numbers masked a lot of individual changes, as the Performance Highlights table is its usual lengthy self. Volume was below average.
For as long as the FixedReset market is so violently unsettled, I’ll keep publishing updates of the more interesting and meaningful series of FixedResets’ Implied Volatilities. This doesn’t include Enbridge because although Enbridge has a large number of issues outstanding, all of which are quite liquid, the range of Issue Reset Spreads is too small for decent conclusions. The low is 212bp (ENB.PR.H; second-lowest is ENB.PR.D at 237bp) and the high is a mere 268 for ENB.PF.G.
Remember that all rich /cheap assessments are:
» based on Implied Volatility Theory only
» are relative only to other FixedResets from the same issuer
» assume constant GOC-5 yield
» assume constant Implied Volatility
» assume constant spread
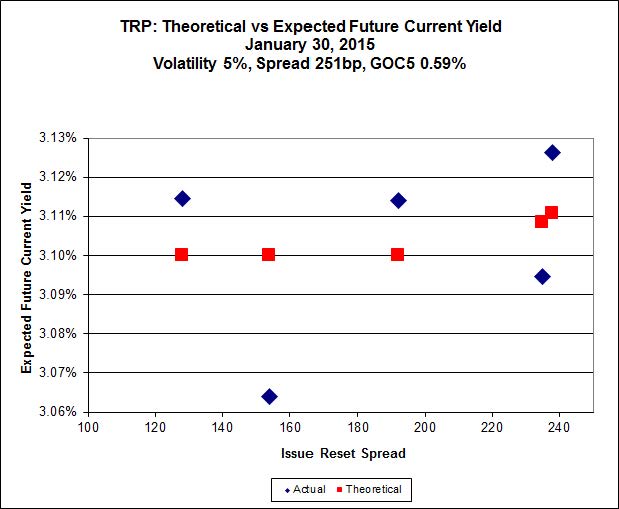
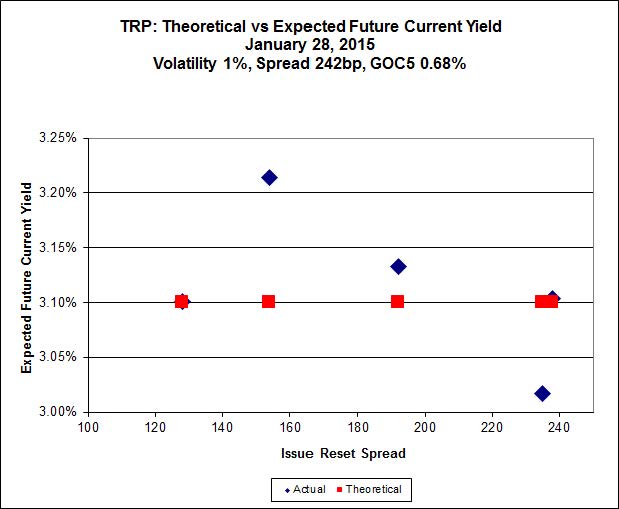
Here’s TRP:
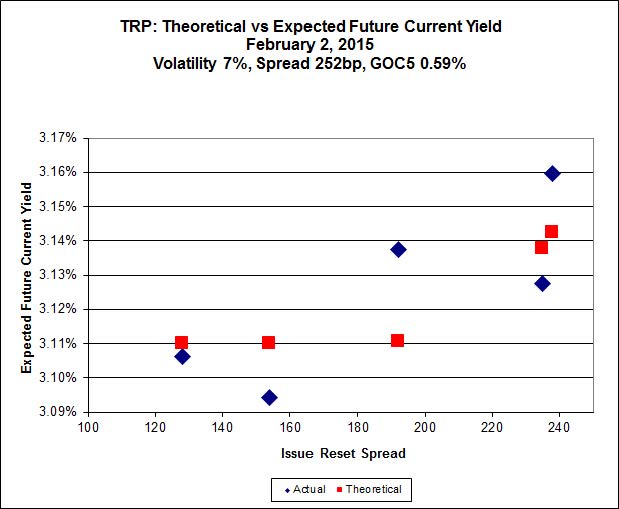
Click for Big
The TRP FixedResets are very well behaved, with an excellent fit to reasonable numbers!
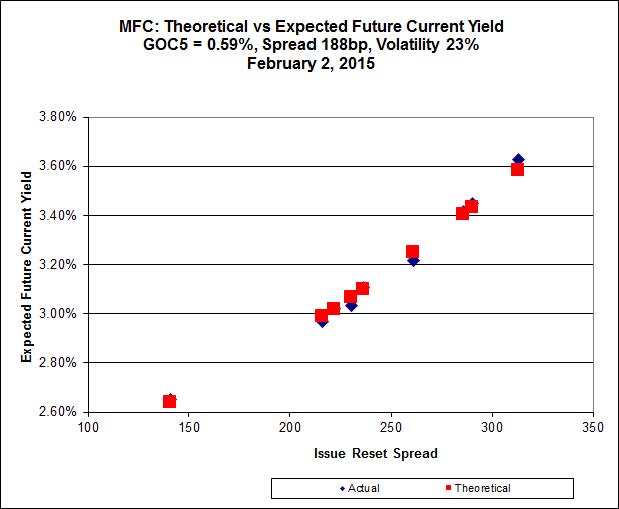
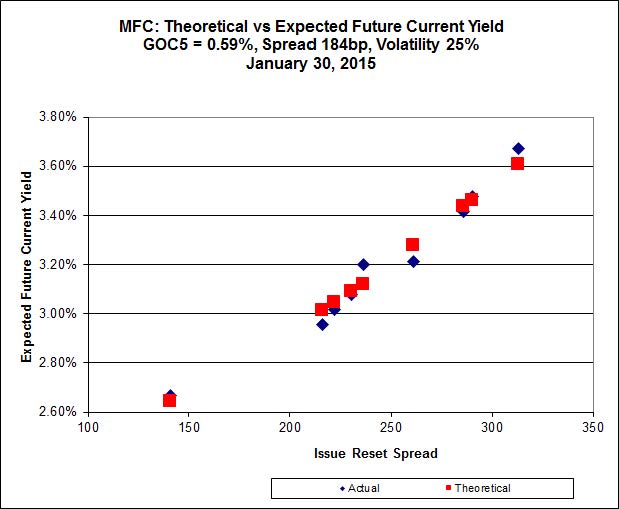
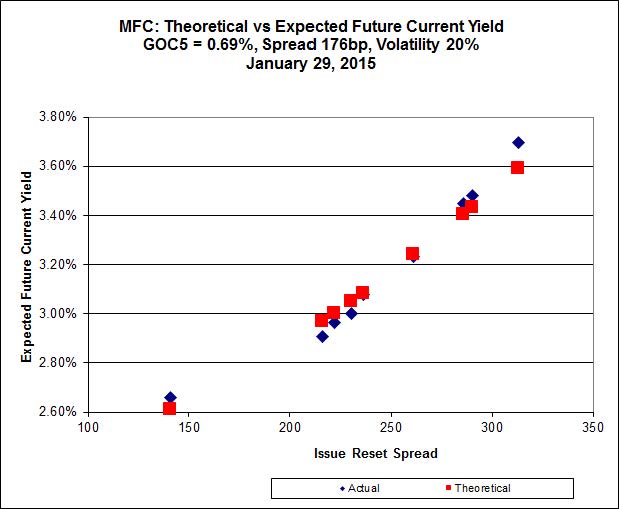
Click for Big
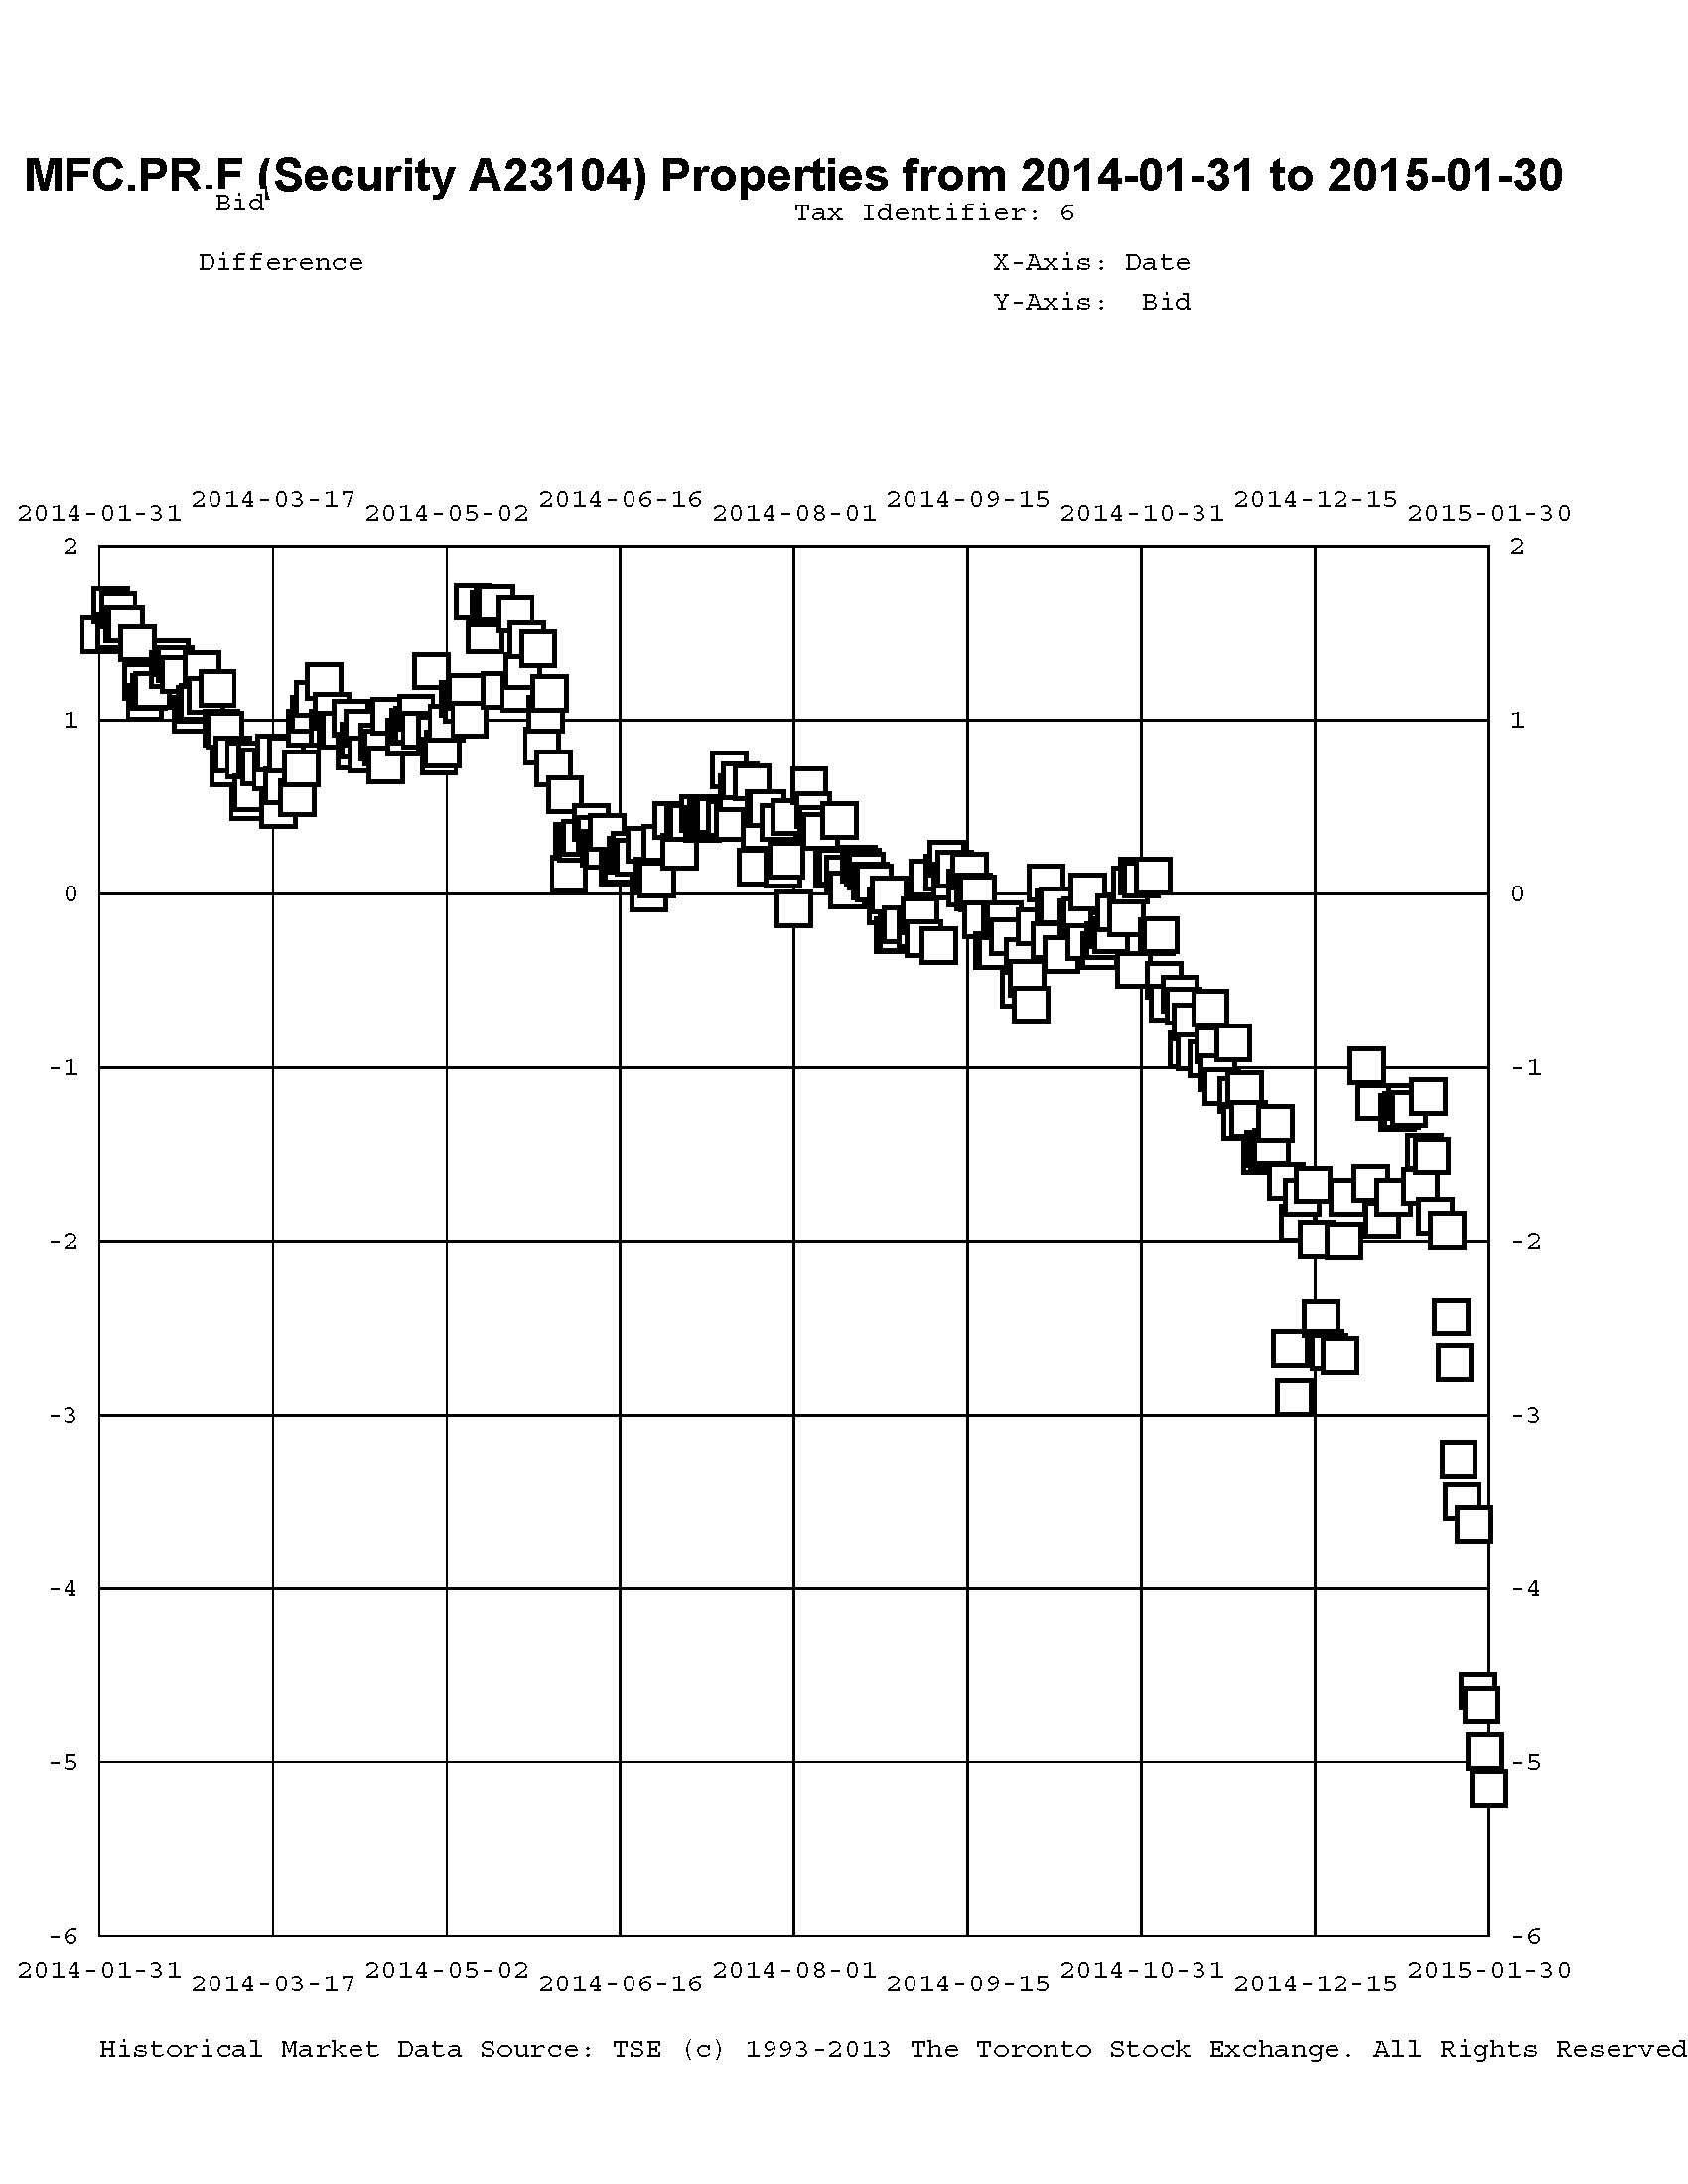
Another excellent fit, but this time the numbers are more perplexing. Implied Volatility for MFC continues to be a conundrum. It is still too high if we consider that NVCC rules will never apply to these issues; it is still too low if we consider them to be NVCC non-compliant issues (and therefore with Deemed Maturities in the call schedule).
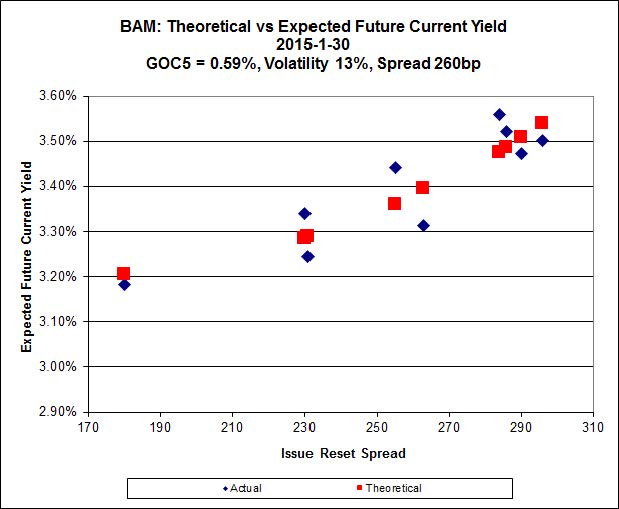
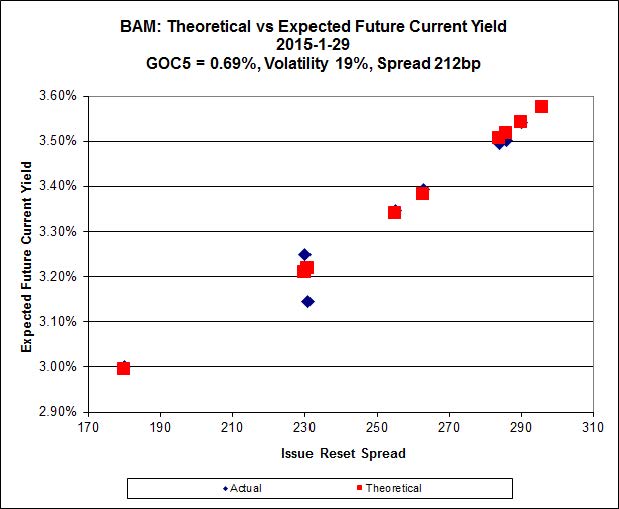
Click for Big
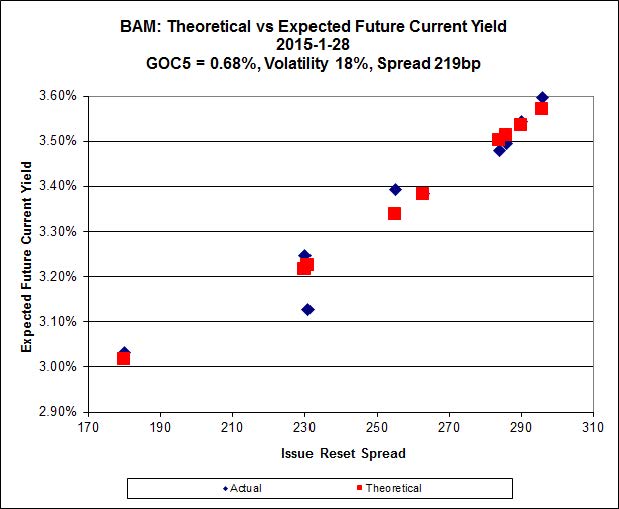
Here’s another good fit to reasonable numbers. I hope this market doesn’t start making sense, or I’ll be out of work!
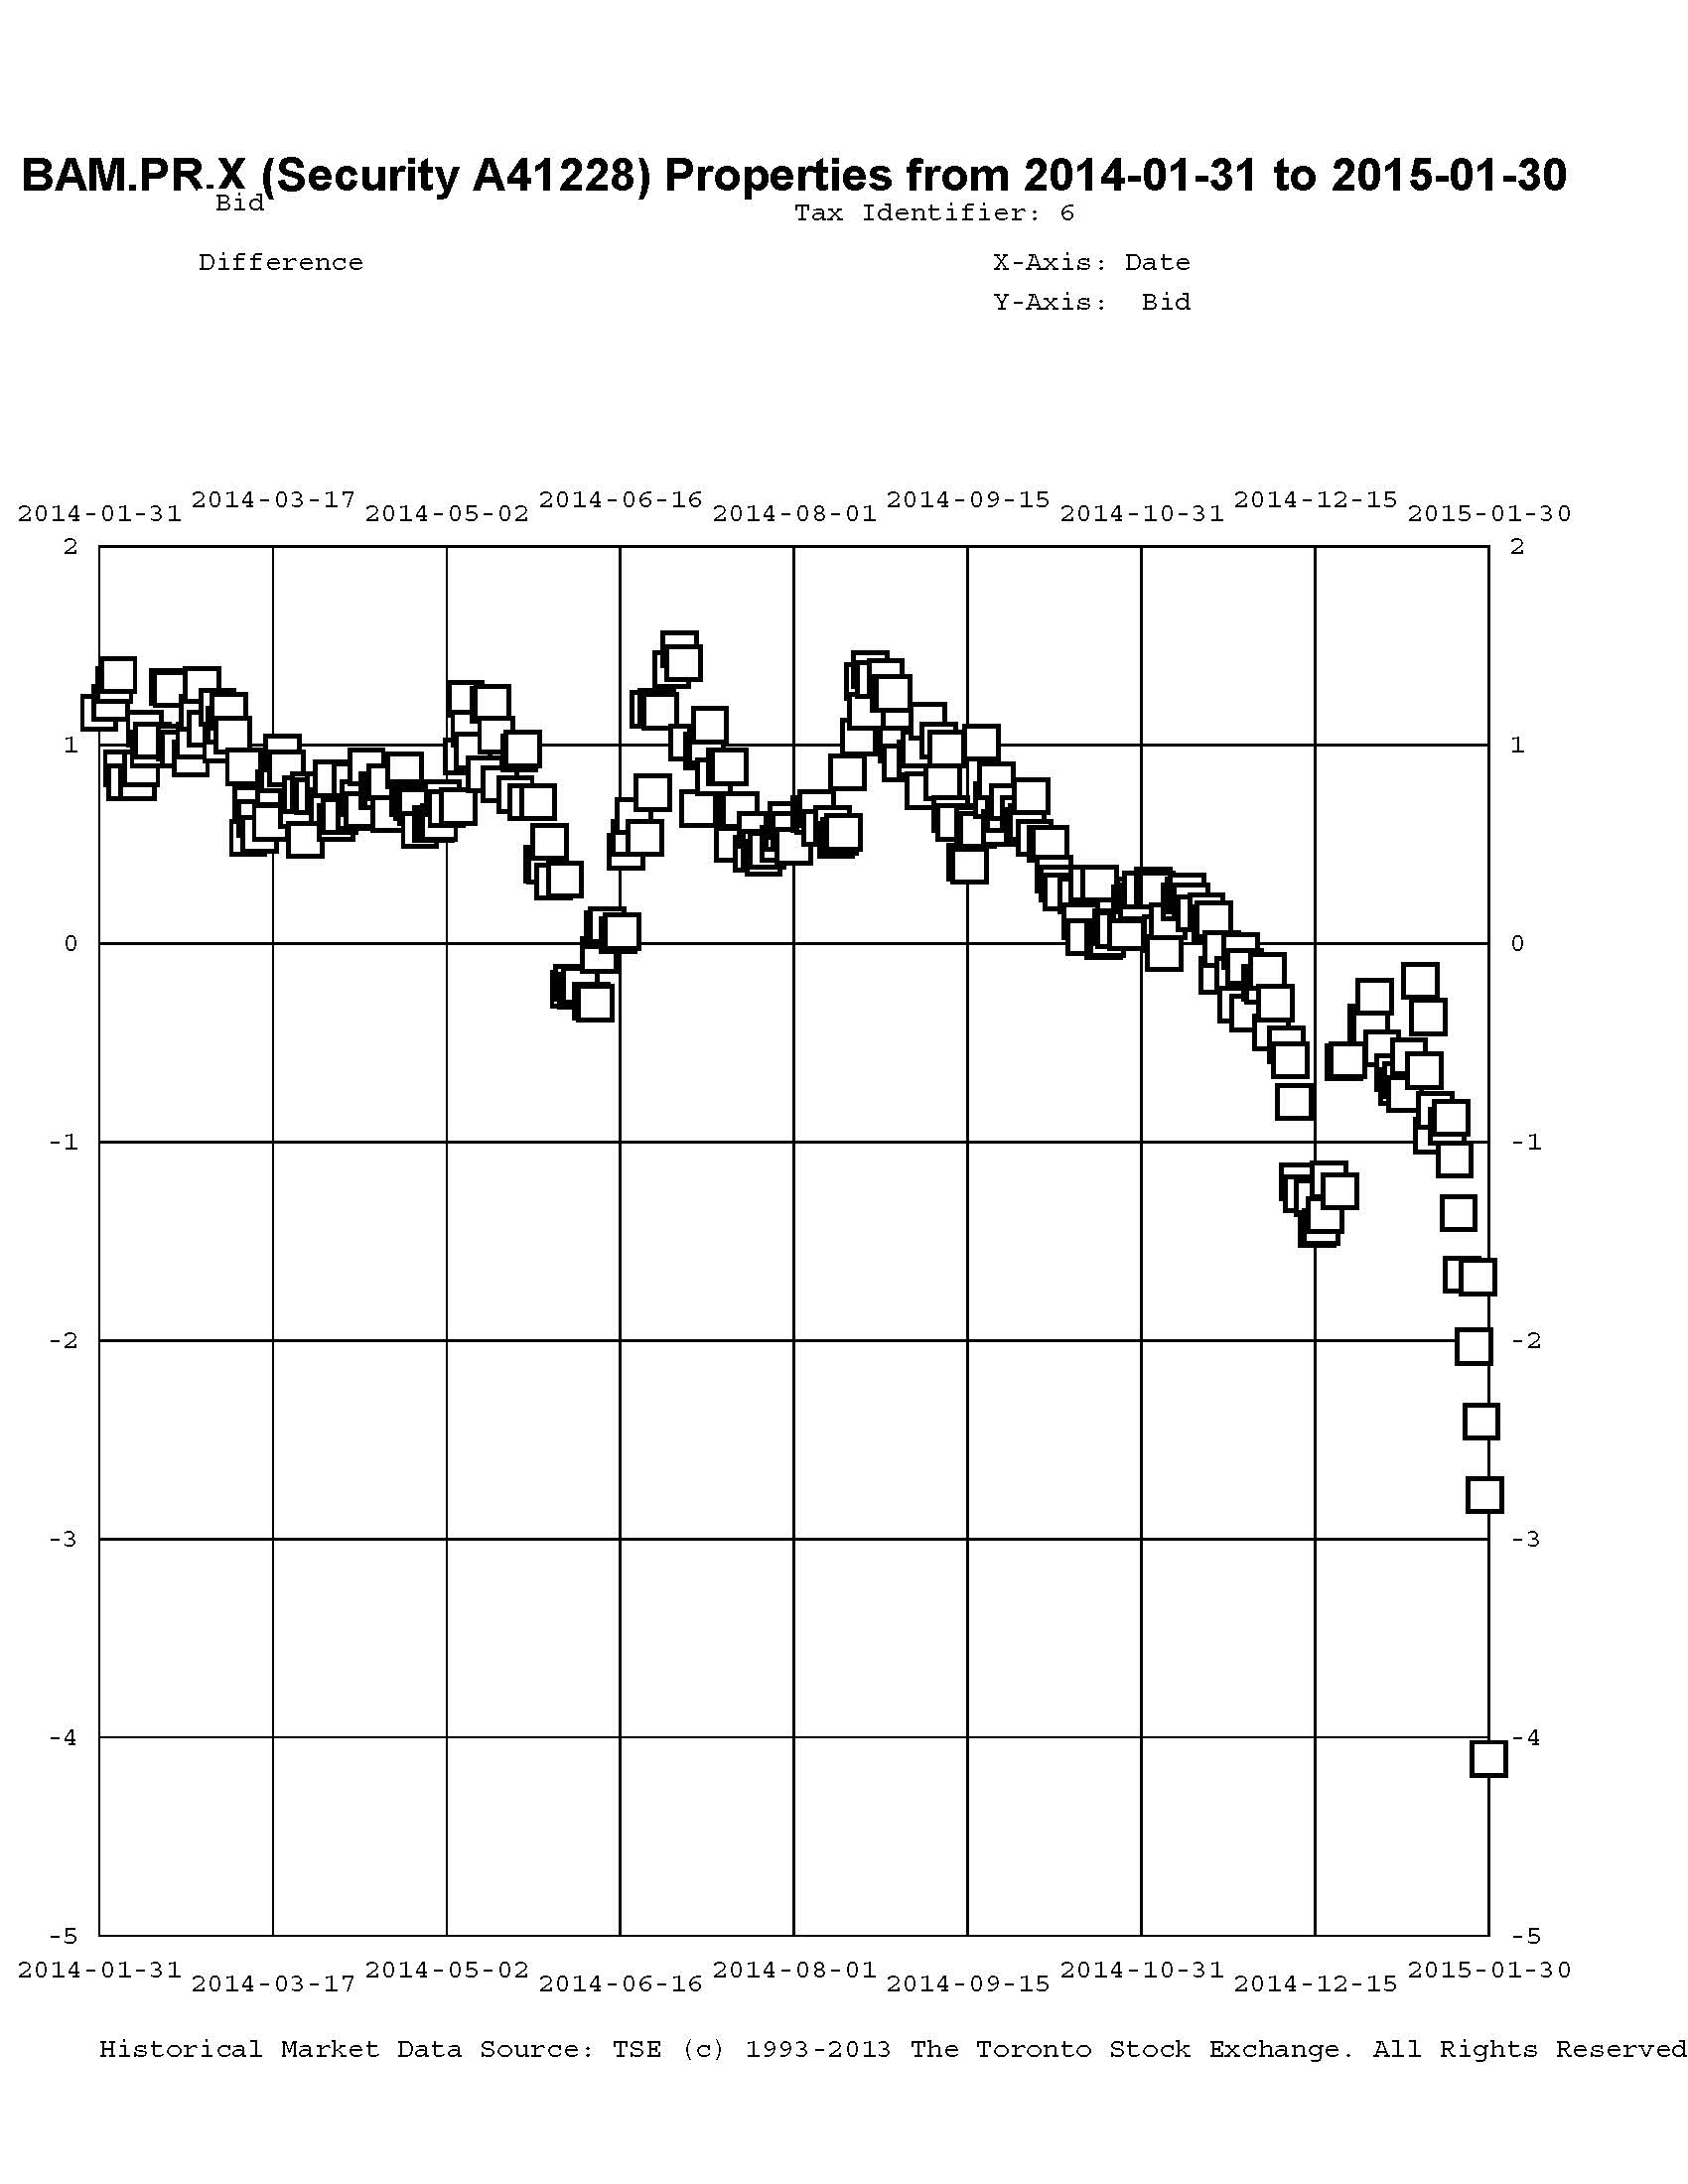
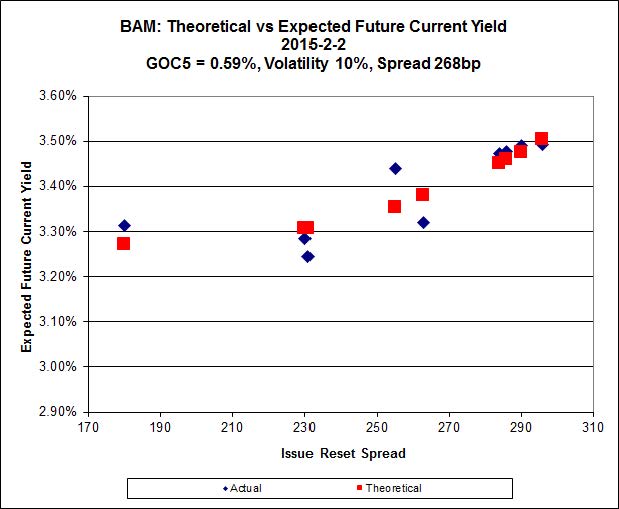
The cheapest issue relative to its peers is now BAM.PF.E, resetting at +255bp on 2020-3-31 (more than five years hence!), bid at 22.82 to be $0.59 cheap. BAM.PF.B, resetting at +263bp 2019-3-31 is bid at 24.25 and appears to be $0.43 rich.

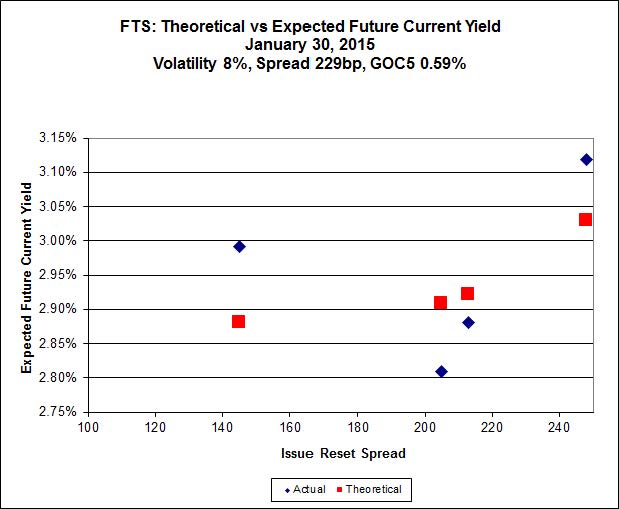
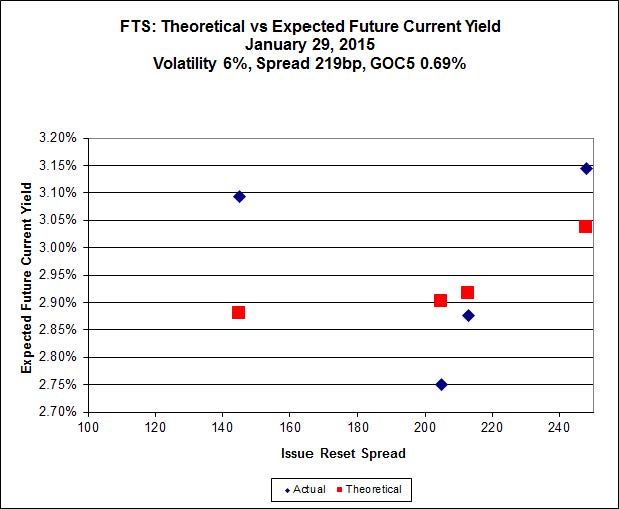
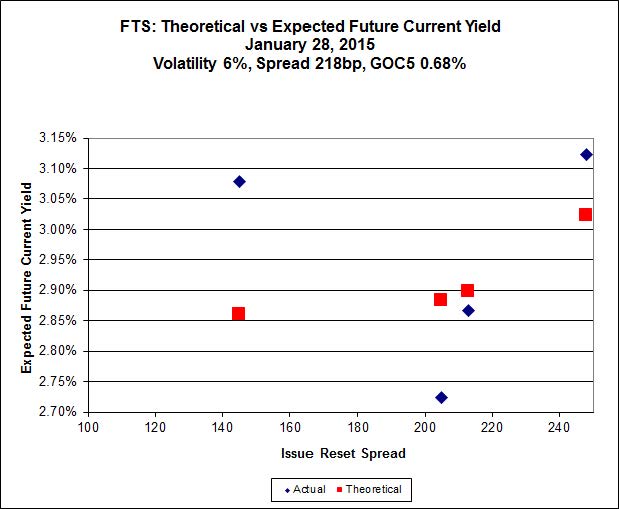
Click for Big
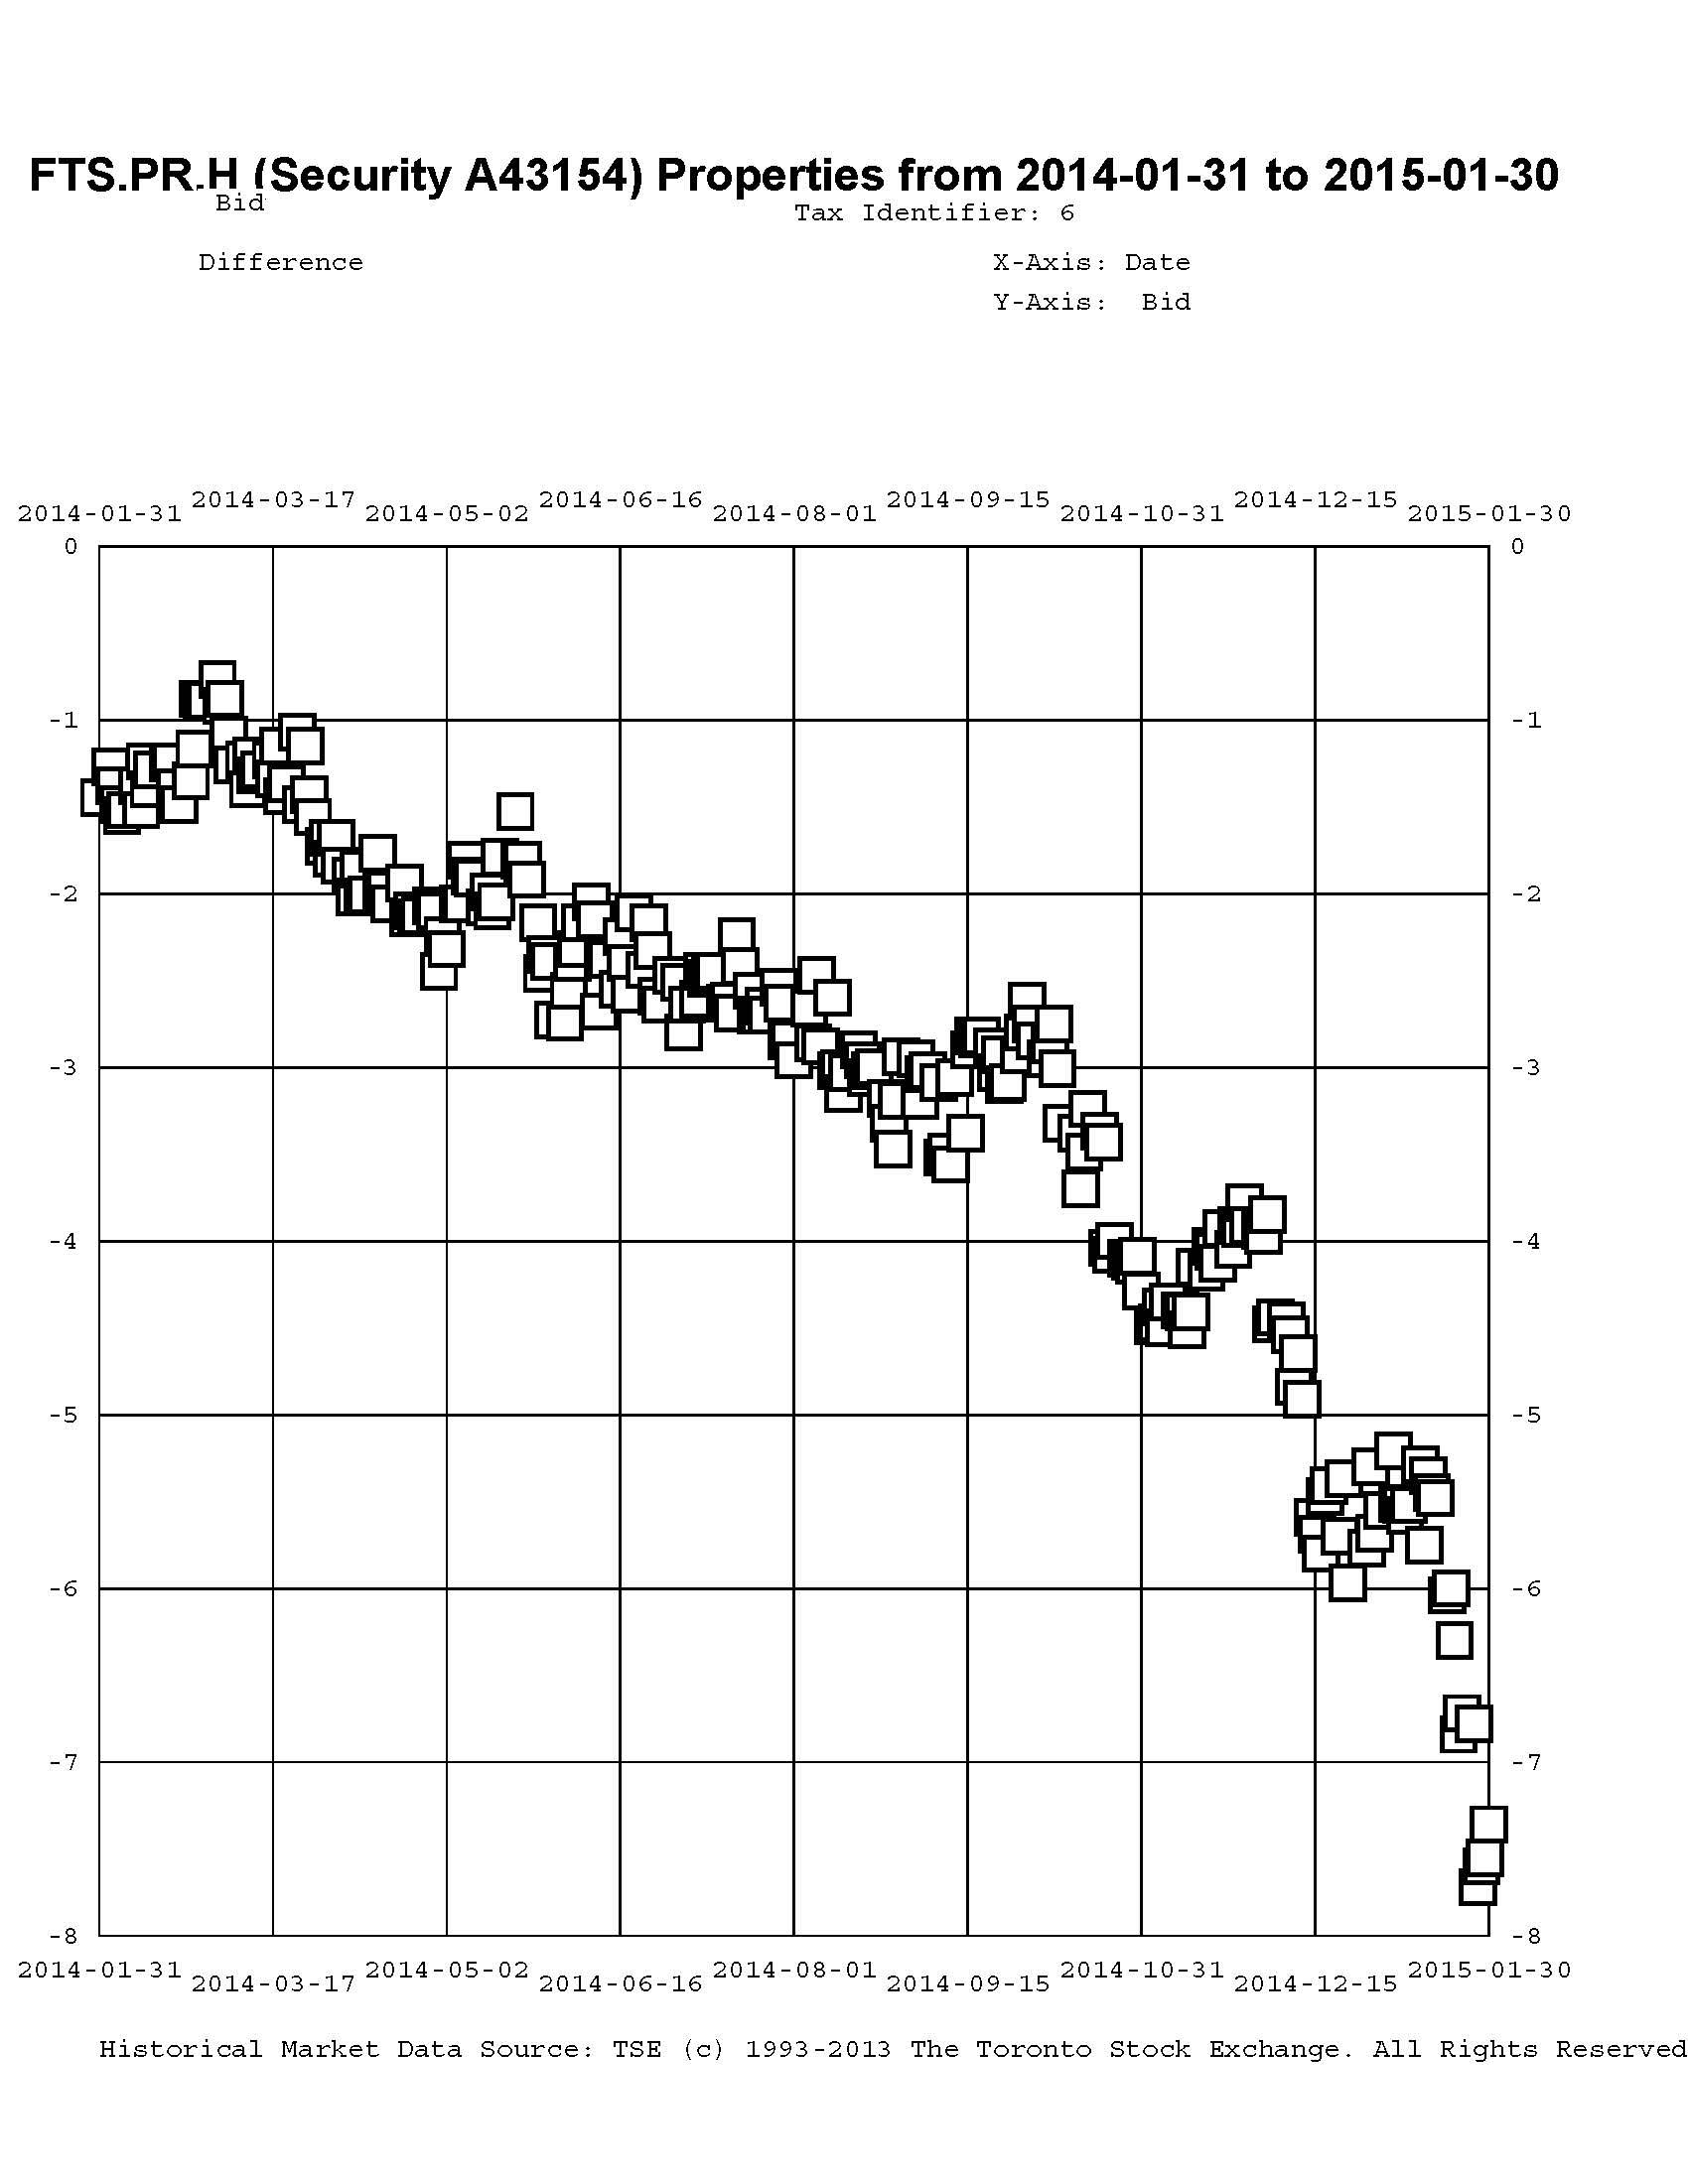
This is just weird because the middle is expensive and the ends are cheap but anyway … FTS.PR.H, with a spread of +145bp, and bid at 17.07, looks $0.64 cheap and resets 2015-6-1. FTS.PR.K, with a spread of +205bp and resetting 2019-3-1, bid at 23.51, and is still $0.82.
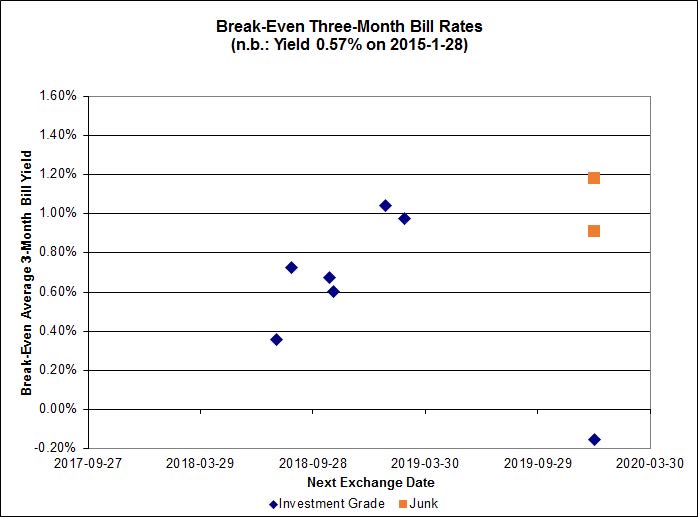
Click for Big
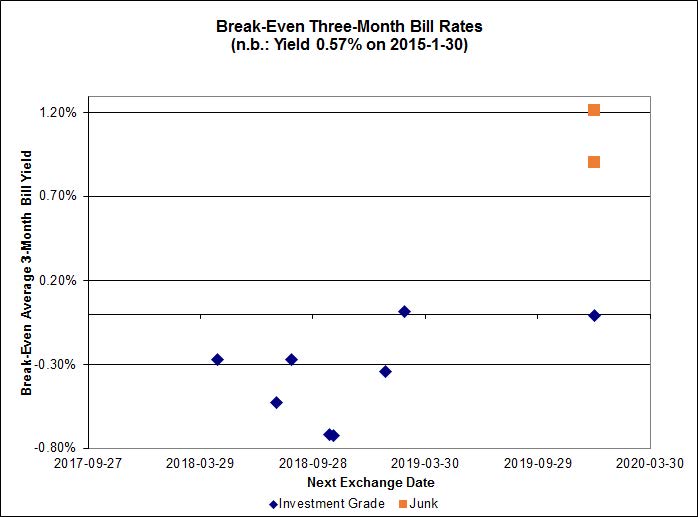
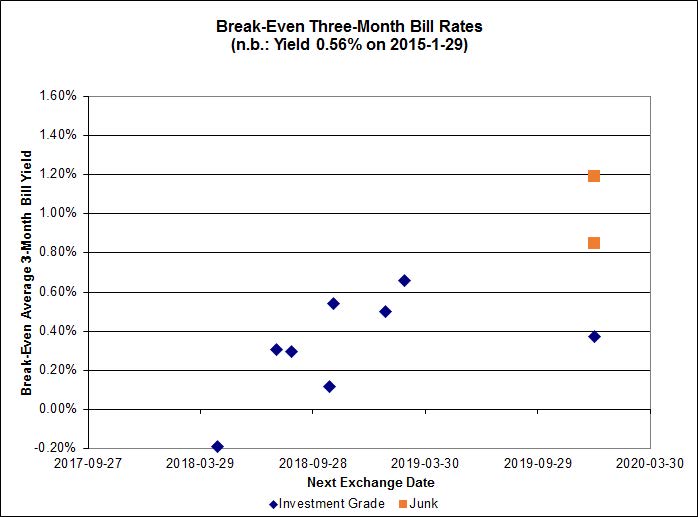
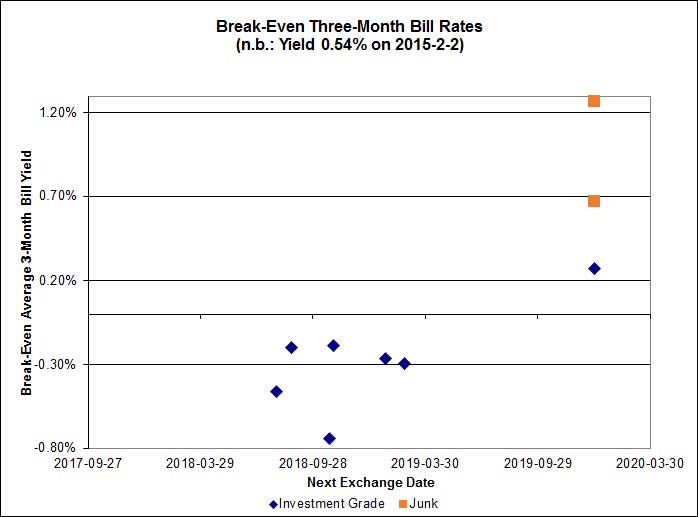
What can I say? Every Investment Grade FixedReset/FloatingReset pair but one (TRP.PR.A / TRP.PR.F) is now showing a negative break-even average three month bill rate until interconversion.
On the other hand, the market’s distaste for product linked to Money Market rates does not extend to prime, as shown by the FixedFloater/RatchetRate pairs:

Click for Big
Shall we just say that this exhibits a high level of confidence in the continued rapacity of Canadian banks?
| HIMIPref™ Preferred Indices These values reflect the December 2008 revision of the HIMIPref™ Indices Values are provisional and are finalized monthly |
|||||||
| Index | Mean Current Yield (at bid) |
Median YTW |
Median Average Trading Value |
Median Mod Dur (YTW) |
Issues | Day’s Perf. | Index Value |
| Ratchet | 0.00 % | 0.00 % | 0 | 0.00 | 0 | -0.4114 % | 2,187.0 |
| FixedFloater | 4.38 % | 3.55 % | 20,957 | 18.33 | 1 | 1.0713 % | 4,037.2 |
| Floater | 3.30 % | 3.47 % | 57,370 | 18.58 | 4 | -0.4114 % | 2,324.9 |
| OpRet | 4.05 % | 2.06 % | 98,674 | 0.37 | 1 | 0.0000 % | 2,750.9 |
| SplitShare | 4.28 % | 4.25 % | 30,885 | 3.98 | 5 | 0.3133 % | 3,193.9 |
| Interest-Bearing | 0.00 % | 0.00 % | 0 | 0.00 | 0 | 0.0000 % | 2,515.4 |
| Perpetual-Premium | 5.33 % | 0.19 % | 57,305 | 0.08 | 24 | -0.0212 % | 2,510.3 |
| Perpetual-Discount | 4.97 % | 4.97 % | 115,073 | 15.46 | 10 | 0.5379 % | 2,770.0 |
| FixedReset | 4.46 % | 3.46 % | 214,817 | 17.05 | 79 | 0.0939 % | 2,395.8 |
| Deemed-Retractible | 4.93 % | 0.96 % | 101,421 | 0.23 | 39 | -0.0648 % | 2,635.8 |
| FloatingReset | 2.55 % | 3.25 % | 78,190 | 6.42 | 7 | 0.0314 % | 2,281.5 |
| Performance Highlights | |||
| Issue | Index | Change | Notes |
| BAM.PR.X | FixedReset | -3.94 % | YTW SCENARIO Maturity Type : Limit Maturity Maturity Date : 2045-02-02 Maturity Price : 18.03 Evaluated at bid price : 18.03 Bid-YTW : 3.72 % |
| TD.PF.C | FixedReset | -3.77 % | YTW SCENARIO Maturity Type : Limit Maturity Maturity Date : 2045-02-02 Maturity Price : 22.54 Evaluated at bid price : 23.50 Bid-YTW : 3.21 % |
| IFC.PR.A | FixedReset | -3.41 % | YTW SCENARIO Maturity Type : Hard Maturity Maturity Date : 2025-01-31 Maturity Price : 25.00 Evaluated at bid price : 19.80 Bid-YTW : 5.77 % |
| PWF.PR.A | Floater | -1.71 % | YTW SCENARIO Maturity Type : Limit Maturity Maturity Date : 2045-02-02 Maturity Price : 17.20 Evaluated at bid price : 17.20 Bid-YTW : 2.89 % |
| ENB.PR.D | FixedReset | -1.62 % | YTW SCENARIO Maturity Type : Limit Maturity Maturity Date : 2045-02-02 Maturity Price : 20.02 Evaluated at bid price : 20.02 Bid-YTW : 3.97 % |
| TRP.PR.E | FixedReset | -1.47 % | YTW SCENARIO Maturity Type : Limit Maturity Maturity Date : 2045-02-02 Maturity Price : 22.51 Evaluated at bid price : 23.40 Bid-YTW : 3.39 % |
| CU.PR.C | FixedReset | -1.38 % | YTW SCENARIO Maturity Type : Limit Maturity Maturity Date : 2045-02-02 Maturity Price : 23.21 Evaluated at bid price : 24.26 Bid-YTW : 3.15 % |
| IFC.PR.C | FixedReset | -1.31 % | YTW SCENARIO Maturity Type : Hard Maturity Maturity Date : 2025-01-31 Maturity Price : 25.00 Evaluated at bid price : 24.05 Bid-YTW : 3.94 % |
| HSE.PR.A | FixedReset | -1.28 % | YTW SCENARIO Maturity Type : Limit Maturity Maturity Date : 2045-02-02 Maturity Price : 17.02 Evaluated at bid price : 17.02 Bid-YTW : 3.61 % |
| TD.PF.B | FixedReset | -1.23 % | YTW SCENARIO Maturity Type : Limit Maturity Maturity Date : 2045-02-02 Maturity Price : 22.88 Evaluated at bid price : 24.15 Bid-YTW : 3.06 % |
| BAM.PR.B | Floater | -1.16 % | YTW SCENARIO Maturity Type : Limit Maturity Maturity Date : 2045-02-02 Maturity Price : 14.50 Evaluated at bid price : 14.50 Bid-YTW : 3.47 % |
| GWO.PR.P | Deemed-Retractible | -1.13 % | YTW SCENARIO Maturity Type : Call Maturity Date : 2020-03-31 Maturity Price : 25.25 Evaluated at bid price : 26.30 Bid-YTW : 4.57 % |
| TRP.PR.D | FixedReset | -1.05 % | YTW SCENARIO Maturity Type : Limit Maturity Maturity Date : 2045-02-02 Maturity Price : 22.59 Evaluated at bid price : 23.50 Bid-YTW : 3.31 % |
| CM.PR.P | FixedReset | -1.02 % | YTW SCENARIO Maturity Type : Limit Maturity Maturity Date : 2045-02-02 Maturity Price : 22.88 Evaluated at bid price : 24.25 Bid-YTW : 3.06 % |
| GWO.PR.Q | Deemed-Retractible | -1.00 % | YTW SCENARIO Maturity Type : Call Maturity Date : 2020-09-30 Maturity Price : 25.25 Evaluated at bid price : 25.64 Bid-YTW : 4.91 % |
| ENB.PR.B | FixedReset | -1.00 % | YTW SCENARIO Maturity Type : Limit Maturity Maturity Date : 2045-02-02 Maturity Price : 19.80 Evaluated at bid price : 19.80 Bid-YTW : 3.99 % |
| BAM.PR.G | FixedFloater | 1.07 % | YTW SCENARIO Maturity Type : Limit Maturity Maturity Date : 2045-02-02 Maturity Price : 21.89 Evaluated at bid price : 21.70 Bid-YTW : 3.55 % |
| RY.PR.I | FixedReset | 1.17 % | YTW SCENARIO Maturity Type : Hard Maturity Maturity Date : 2022-01-31 Maturity Price : 25.00 Evaluated at bid price : 25.09 Bid-YTW : 3.04 % |
| BNS.PR.P | FixedReset | 1.19 % | YTW SCENARIO Maturity Type : Hard Maturity Maturity Date : 2022-01-31 Maturity Price : 25.00 Evaluated at bid price : 25.50 Bid-YTW : 2.68 % |
| TD.PF.A | FixedReset | 1.22 % | YTW SCENARIO Maturity Type : Limit Maturity Maturity Date : 2045-02-02 Maturity Price : 23.15 Evaluated at bid price : 24.90 Bid-YTW : 2.93 % |
| MFC.PR.H | FixedReset | 1.22 % | YTW SCENARIO Maturity Type : Call Maturity Date : 2017-03-19 Maturity Price : 25.00 Evaluated at bid price : 25.65 Bid-YTW : 3.61 % |
| BAM.PF.F | FixedReset | 1.22 % | YTW SCENARIO Maturity Type : Limit Maturity Maturity Date : 2045-02-02 Maturity Price : 23.12 Evaluated at bid price : 24.80 Bid-YTW : 3.63 % |
| VNR.PR.A | FixedReset | 1.30 % | YTW SCENARIO Maturity Type : Limit Maturity Maturity Date : 2045-02-02 Maturity Price : 23.43 Evaluated at bid price : 25.00 Bid-YTW : 3.43 % |
| ENB.PF.C | FixedReset | 1.31 % | YTW SCENARIO Maturity Type : Limit Maturity Maturity Date : 2045-02-02 Maturity Price : 21.97 Evaluated at bid price : 22.50 Bid-YTW : 3.94 % |
| ENB.PR.N | FixedReset | 1.41 % | YTW SCENARIO Maturity Type : Limit Maturity Maturity Date : 2045-02-02 Maturity Price : 21.31 Evaluated at bid price : 21.60 Bid-YTW : 3.96 % |
| MFC.PR.N | FixedReset | 1.49 % | YTW SCENARIO Maturity Type : Hard Maturity Maturity Date : 2025-01-31 Maturity Price : 25.00 Evaluated at bid price : 23.83 Bid-YTW : 3.92 % |
| BAM.PR.R | FixedReset | 1.66 % | YTW SCENARIO Maturity Type : Limit Maturity Maturity Date : 2045-02-02 Maturity Price : 21.60 Evaluated at bid price : 22.00 Bid-YTW : 3.47 % |
| BNS.PR.Z | FixedReset | 1.80 % | YTW SCENARIO Maturity Type : Hard Maturity Maturity Date : 2022-01-31 Maturity Price : 25.00 Evaluated at bid price : 22.60 Bid-YTW : 3.79 % |
| CGI.PR.D | SplitShare | 2.16 % | YTW SCENARIO Maturity Type : Soft Maturity Maturity Date : 2023-06-14 Maturity Price : 25.00 Evaluated at bid price : 25.54 Bid-YTW : 3.54 % |
| BAM.PR.K | Floater | 2.29 % | YTW SCENARIO Maturity Type : Limit Maturity Maturity Date : 2045-02-02 Maturity Price : 14.32 Evaluated at bid price : 14.32 Bid-YTW : 3.51 % |
| BAM.PF.G | FixedReset | 2.45 % | YTW SCENARIO Maturity Type : Limit Maturity Maturity Date : 2045-02-02 Maturity Price : 23.03 Evaluated at bid price : 24.69 Bid-YTW : 3.67 % |
| ENB.PR.Y | FixedReset | 2.72 % | YTW SCENARIO Maturity Type : Limit Maturity Maturity Date : 2045-02-02 Maturity Price : 20.75 Evaluated at bid price : 20.75 Bid-YTW : 3.93 % |
| PWF.PR.T | FixedReset | 2.92 % | YTW SCENARIO Maturity Type : Limit Maturity Maturity Date : 2045-02-02 Maturity Price : 23.14 Evaluated at bid price : 24.70 Bid-YTW : 3.11 % |
| MFC.PR.M | FixedReset | 3.04 % | YTW SCENARIO Maturity Type : Hard Maturity Maturity Date : 2025-01-31 Maturity Price : 25.00 Evaluated at bid price : 23.75 Bid-YTW : 4.14 % |
| FTS.PR.J | Perpetual-Discount | 3.24 % | YTW SCENARIO Maturity Type : Limit Maturity Maturity Date : 2045-02-02 Maturity Price : 24.77 Evaluated at bid price : 25.20 Bid-YTW : 4.77 % |
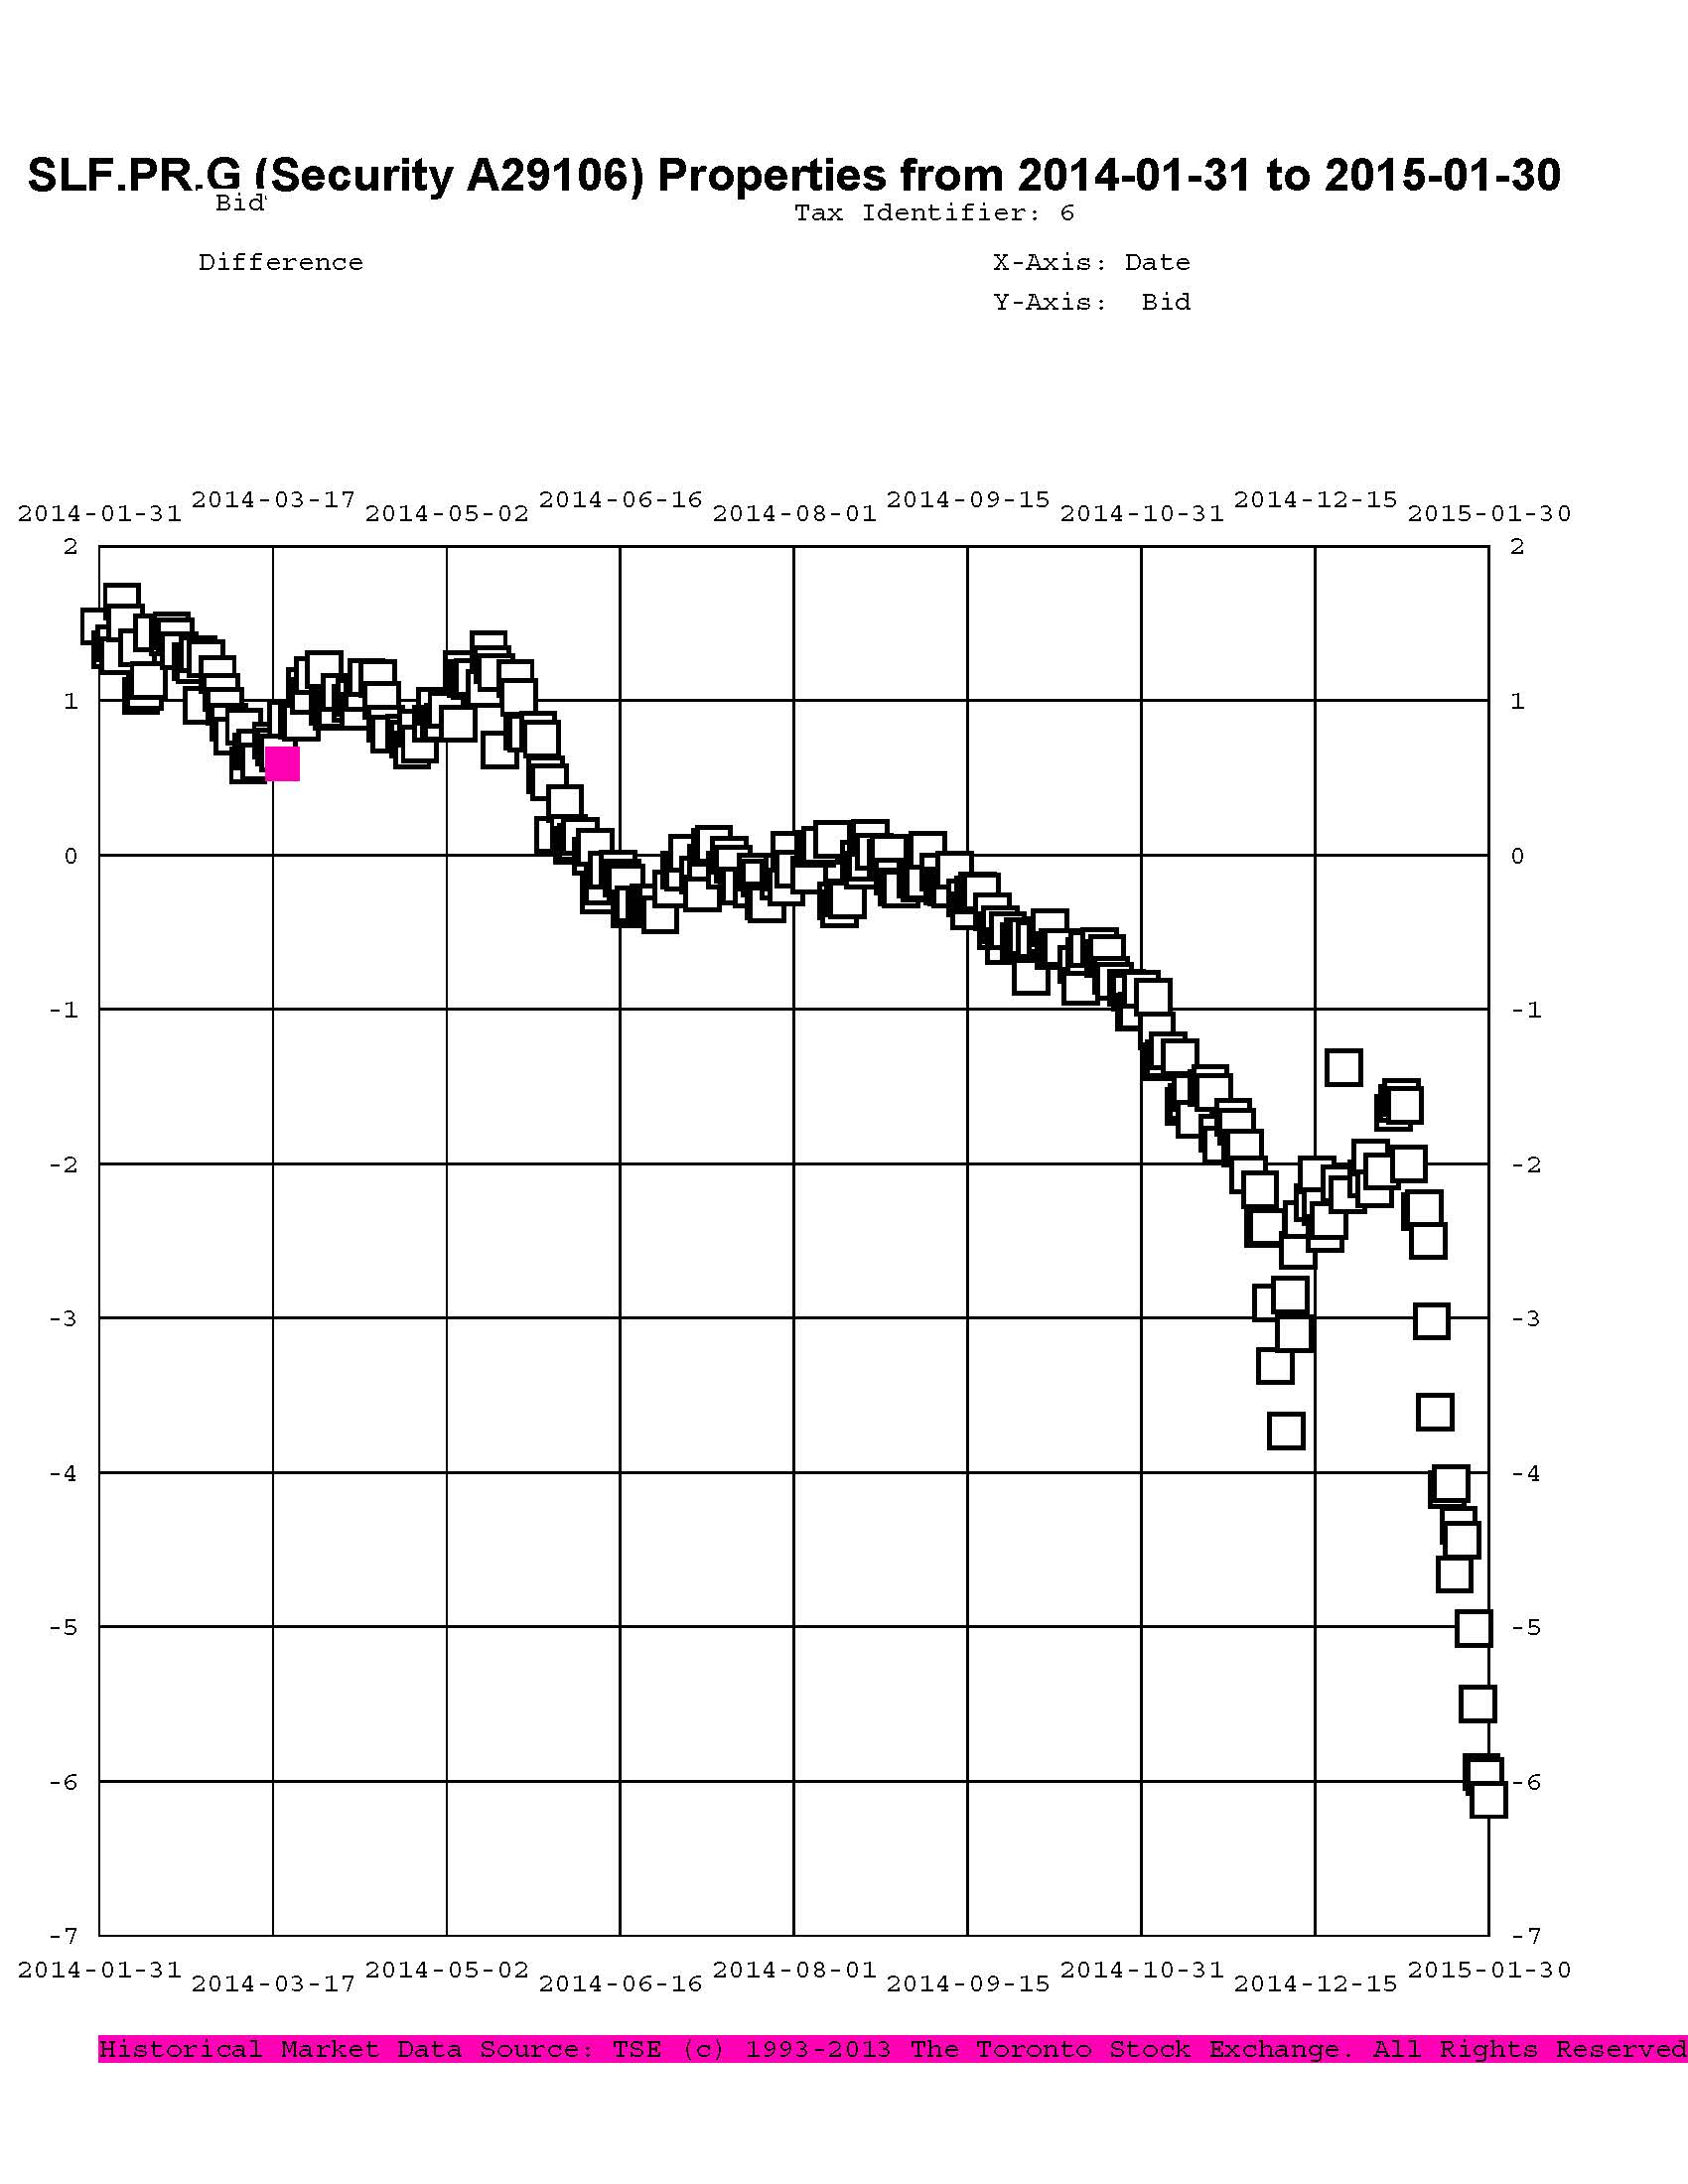
| SLF.PR.G | FixedReset | 3.97 % | YTW SCENARIO Maturity Type : Hard Maturity Maturity Date : 2025-01-31 Maturity Price : 25.00 Evaluated at bid price : 18.35 Bid-YTW : 5.65 % |
| Volume Highlights | |||
| Issue | Index | Shares Traded |
Notes |
| RY.PR.J | FixedReset | 101,699 | Recent new issue. YTW SCENARIO Maturity Type : Limit Maturity Maturity Date : 2045-02-02 Maturity Price : 23.12 Evaluated at bid price : 24.94 Bid-YTW : 3.28 % |
| PWF.PR.P | FixedReset | 56,983 | YTW SCENARIO Maturity Type : Limit Maturity Maturity Date : 2045-02-02 Maturity Price : 18.75 Evaluated at bid price : 18.75 Bid-YTW : 3.04 % |
| BAM.PF.G | FixedReset | 53,520 | Scotia sold two blocks of 10,000 each to TD and crossed another 11,400, all at 24.20. YTW SCENARIO Maturity Type : Limit Maturity Maturity Date : 2045-02-02 Maturity Price : 23.03 Evaluated at bid price : 24.69 Bid-YTW : 3.67 % |
| GWO.PR.N | FixedReset | 41,875 | Desjardins sold blocks of 24,400 and 12,000 to anonymous at 18.28. YTW SCENARIO Maturity Type : Hard Maturity Maturity Date : 2025-01-31 Maturity Price : 25.00 Evaluated at bid price : 18.15 Bid-YTW : 5.75 % |
| SLF.PR.D | Deemed-Retractible | 32,928 | RBC crossed 25,000 at 23.90. YTW SCENARIO Maturity Type : Hard Maturity Maturity Date : 2025-01-31 Maturity Price : 25.00 Evaluated at bid price : 23.61 Bid-YTW : 5.25 % |
| ENB.PR.B | FixedReset | 27,548 | YTW SCENARIO Maturity Type : Limit Maturity Maturity Date : 2045-02-02 Maturity Price : 19.80 Evaluated at bid price : 19.80 Bid-YTW : 3.99 % |
| There were 25 other index-included issues trading in excess of 10,000 shares. | |||
| Wide Spread Highlights | ||
| Issue | Index | Quote Data and Yield Notes |
| ENB.PR.J | FixedReset | Quote: 22.25 – 23.47 Spot Rate : 1.2200 Average : 0.7071 YTW SCENARIO |
| TD.PF.C | FixedReset | Quote: 23.50 – 24.50 Spot Rate : 1.0000 Average : 0.5620 YTW SCENARIO |
| MFC.PR.I | FixedReset | Quote: 25.26 – 26.05 Spot Rate : 0.7900 Average : 0.4792 YTW SCENARIO |
| PVS.PR.C | SplitShare | Quote: 25.66 – 26.50 Spot Rate : 0.8400 Average : 0.5576 YTW SCENARIO |
| ENB.PR.T | FixedReset | Quote: 20.70 – 21.24 Spot Rate : 0.5400 Average : 0.3378 YTW SCENARIO |
| TRP.PR.E | FixedReset | Quote: 23.40 – 24.00 Spot Rate : 0.6000 Average : 0.3981 YTW SCENARIO |