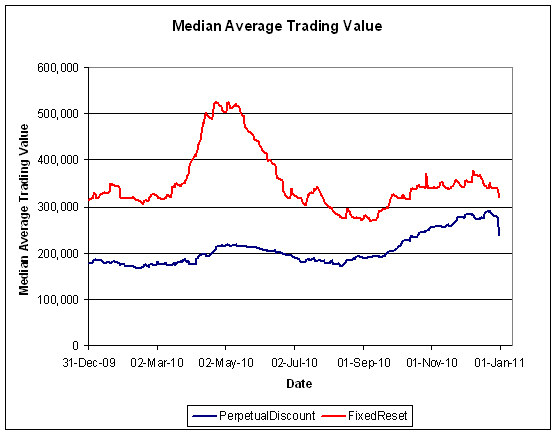
Issue Comments

L.PR.A: DBRS Revises Trend to "Stable"

DBRS has announced that it:

has today confirmed Loblaw Companies Limited’s (Loblaw or the Company) long-term debt ratings at BBB and its Cumulative Redeemable Second Preferred Shares, Series A rating at Pfd-3, and revised the trends to Stable from Negative.

DBRS believes that the management changes and strategic initiatives made in early 2008 have proved successful in stabilizing the business. Loblaw has been able to keep market share almost level and deliver reasonable revenue growth while improving margins for a full year now. The performance over the past year has led to a significant improvement in key credit metrics – lease-adjusted gross debt-to-EBITDAR for the 52 weeks ending June 20, 2009 is now 2.8 times (x) (compared with 3.1x for 2008, and 3.7x for the 52 weeks ending June 14, 2008), a level that is well within the BBB rating category for Loblaw. With solid performance for four quarters in a row, DBRS is prepared to revise the trend on its long-term ratings for Loblaw to Stable from Negative.

DBRS is prepared to take this action despite the fact that operating performance and credit metrics may actually moderate over the near term due to the effects of food price deflation, a weak economic environment, and intense competition. We believe a more stable Canadian food retailing sector, combined with the initiatives taken by Loblaw over the past year and a half to address its internal problems, have strengthened the Company and positioned it to withstand a more challenging environment within the current rating category. DBRS also acknowledges that Loblaw’s intention to increase its capital budget for the remainder of the year (to $1 billion from previous guidance of $750 million) will use much of the free cash flow that could have been used to reduce net debt further.

L.PR.A was last mentioned on PrefBlog when a bond issue offered a pricing clue last May.

L.PR.A is tracked by HIMIPref™. It is relegated to the “Scraps” index on credit concerns.

Market Action

August 5, 2009

Goldman Sachs is making tons of money:

Goldman Sachs Group Inc. made more than $100 million in trading revenue on a record 46 separate days during the second quarter, or 71 percent of the time, breaking the previous high of 34 days in the prior three months.

Trading losses occurred on two days during the months of April, May and June, down from eight in the first quarter, the New York-based bank said today in a filing with the U.S. Securities and Exchange Commission. The company made at least $50 million on 58 of the 65 trading days during the quarter, or 89 percent of the time.

Banks such as Goldman Sachs are benefiting from lower borrowing costs after the Federal Deposit Insurance Corp. in October started guaranteeing bank debt issues that mature within three years. Goldman Sachs said in today’s filing it had $25.1 billion of debt guaranteed by the FDIC under the agency’s Temporary Liquidity Guarantee Program. The bank sold about $30 billion of the FDIC-backed securities between November and March, according to company filings.

There will be howls of outrage when they announce their bonuses next year! How much of this is due to the skill and salesmanship of their traders and sales desks and how much is due to the fact that smiley-boy has a big whack of capital behind him? You can bet that the politics of envy will be a major political theme in the coming year.

However, we must be fair. Particularly with respect to Flash Orders. It is only fair that large, politically connected companies be protected from that horrible competition stuff. Competition, you know, leads to bonuses:

The U.S. Securities and Exchange Commission’s move to ban so-called flash orders may help NYSE Euronext take back market share of U.S. stock trading at the expense of three-year-old rival Direct Edge Holdings LLC.

The debate regarding position limits in commodity futures is getting interesting:

John Hyland, chief investment officer for the world’s largest exchange-traded fund in natural gas, said assertions his company helped drive up energy prices were “self-serving statistical gibberish.”

Hyland’s Alameda, California-based U.S. Commodity Funds LLC owns a family of exchange-traded funds that invest in oil, gasoline, heating oil and natural gas. One of them, the United States Natural Gas Fund, has grown 11-fold since the start of the year, to 347.4 million shares outstanding.

The fund ran out of new shares on July 7 and is seeking permission from the Securities and Exchange Commission to sell a billion more.

The $4.8 billion natural gas fund has at times owned almost 20 percent of the open interest in the near-month natural gas contract on the New York Mercantile Exchange, plus hundreds of thousands of natural gas swaps on the InterContinental Exchange.

Hyland said government-imposed caps would splinter large exchange-traded funds like his into smaller funds, reducing liquidity they provide to the futures market.

[CFTC Chairman Gary] Gensler said in the hearings last week that there is a consensus that position limits are needed in derivatives markets, leaving regulators to answer three questions: What should the limits be, who will set and monitor the rules, and who needs to be exempt?

“Position limits on financial contracts will decrease liquidity, increase transaction costs and increase volatility associated with expiration — all without achieving any of the reforms that the commission seeks,” said [John] Arnold, the founder of $5 billion energy hedge fund Centaurus Advisors LLC in Houston.

It depends a lot on what, precisely, is meant by “Exchange Traded Fund”. If it’s a straight pass-through, with one-share being equal to one barrel of oil, or one cubic meter of natural gas, or whatever, then I have no problems with it being exempt from the position limits. However, if it is indeed a straight pass-through, than this makes a mockery of the notion that it provides liquidity. You do not provide liquidity by taking a position, you suck it up. You do not provide liquidity by holding a position. You only provide liquidity by taking discretionary market action to offset actions of other market participants … and if you do that, you’re not an exchange-traded fund, you’re just another speculator and you should be subject to position limits.

Another rip-roaring day for PerpetualDiscounts, which gained just over 84bp in total return (BMO went ex-dividend) to bring the weighted median YTW below 6% for the first time since September 12, 2008, just before Lehman’s bankruptcy. Very good volume today and FixedReset issues made it back to their accustomed (well, accustomed in the last six months, anyway) dominance of the volume highlights table.

PerpetualDiscounts now yield 5.99%, equivalent to 8.40% interest at the standard conversion factor of 1.4x. Long Corporates now yield 6.1%, so the pre-tax interest equivalent spread is now about 230bp, a widening from the 215bp estimate of July 31 and July 29.

HIMIPref™ Preferred Indices
These values reflect the December 2008 revision of the HIMIPref™ Indices

Values are provisional and are finalized monthly
Index Mean
Current
Yield
(at bid)
Median
YTW
Median
Average
Trading
Value
Median
Mod Dur
(YTW)
Issues Day’s Perf. Index Value
Ratchet 0.00 % 0.00 % 0 0.00 0 0.6047 % 1,252.3
FixedFloater 7.02 % 5.20 % 42,513 17.01 1 1.3072 % 2,188.9
Floater 3.64 % 3.67 % 71,438 18.12 2 0.6047 % 1,564.5
OpRet 4.88 % -4.14 % 139,113 0.09 15 0.2772 % 2,264.2
SplitShare 5.76 % 6.45 % 97,712 4.12 3 0.9449 % 2,014.6
Interest-Bearing 0.00 % 0.00 % 0 0.00 0 0.2772 % 2,070.4
Perpetual-Premium 5.74 % 5.58 % 78,203 13.92 4 0.3505 % 1,852.2
Perpetual-Discount 5.93 % 5.99 % 173,449 13.89 67 0.8442 % 1,732.2
FixedReset 5.49 % 4.03 % 548,833 4.17 40 0.1093 % 2,101.7
Performance Highlights
Issue Index Change Notes
CIU.PR.A Perpetual-Discount -1.47 % YTW SCENARIO
Maturity Type : Limit Maturity
Maturity Date : 2039-08-05
Maturity Price : 20.10
Evaluated at bid price : 20.10
Bid-YTW : 5.83 %
PWF.PR.L Perpetual-Discount 1.01 % YTW SCENARIO
Maturity Type : Limit Maturity
Maturity Date : 2039-08-05
Maturity Price : 21.02
Evaluated at bid price : 21.02
Bid-YTW : 6.12 %
RY.PR.G Perpetual-Discount 1.02 % YTW SCENARIO
Maturity Type : Limit Maturity
Maturity Date : 2039-08-05
Maturity Price : 19.77
Evaluated at bid price : 19.77
Bid-YTW : 5.71 %
RY.PR.B Perpetual-Discount 1.03 % YTW SCENARIO
Maturity Type : Limit Maturity
Maturity Date : 2039-08-05
Maturity Price : 20.61
Evaluated at bid price : 20.61
Bid-YTW : 5.72 %
TD.PR.M OpRet 1.10 % YTW SCENARIO
Maturity Type : Call
Maturity Date : 2009-09-04
Maturity Price : 26.00
Evaluated at bid price : 26.74
Bid-YTW : -26.92 %
GWO.PR.F Perpetual-Discount 1.10 % YTW SCENARIO
Maturity Type : Limit Maturity
Maturity Date : 2039-08-05
Maturity Price : 24.46
Evaluated at bid price : 24.75
Bid-YTW : 6.03 %
CM.PR.J Perpetual-Discount 1.16 % YTW SCENARIO
Maturity Type : Limit Maturity
Maturity Date : 2039-08-05
Maturity Price : 19.20
Evaluated at bid price : 19.20
Bid-YTW : 5.91 %
POW.PR.D Perpetual-Discount 1.16 % YTW SCENARIO
Maturity Type : Limit Maturity
Maturity Date : 2039-08-05
Maturity Price : 20.85
Evaluated at bid price : 20.85
Bid-YTW : 6.06 %
PWF.PR.F Perpetual-Discount 1.22 % YTW SCENARIO
Maturity Type : Limit Maturity
Maturity Date : 2039-08-05
Maturity Price : 21.62
Evaluated at bid price : 21.62
Bid-YTW : 6.12 %
RY.PR.H Perpetual-Discount 1.22 % YTW SCENARIO
Maturity Type : Limit Maturity
Maturity Date : 2039-08-05
Maturity Price : 24.68
Evaluated at bid price : 24.90
Bid-YTW : 5.68 %
GWO.PR.H Perpetual-Discount 1.23 % YTW SCENARIO
Maturity Type : Limit Maturity
Maturity Date : 2039-08-05
Maturity Price : 20.50
Evaluated at bid price : 20.50
Bid-YTW : 6.00 %
CM.PR.G Perpetual-Discount 1.25 % YTW SCENARIO
Maturity Type : Limit Maturity
Maturity Date : 2039-08-05
Maturity Price : 22.45
Evaluated at bid price : 22.61
Bid-YTW : 6.01 %
SLF.PR.E Perpetual-Discount 1.28 % YTW SCENARIO
Maturity Type : Limit Maturity
Maturity Date : 2039-08-05
Maturity Price : 19.04
Evaluated at bid price : 19.04
Bid-YTW : 5.99 %
SLF.PR.C Perpetual-Discount 1.30 % YTW SCENARIO
Maturity Type : Limit Maturity
Maturity Date : 2039-08-05
Maturity Price : 18.75
Evaluated at bid price : 18.75
Bid-YTW : 6.02 %
BAM.PR.G FixedFloater 1.31 % YTW SCENARIO
Maturity Type : Limit Maturity
Maturity Date : 2039-08-05
Maturity Price : 25.00
Evaluated at bid price : 15.50
Bid-YTW : 5.20 %
SLF.PR.B Perpetual-Discount 1.31 % YTW SCENARIO
Maturity Type : Limit Maturity
Maturity Date : 2039-08-05
Maturity Price : 20.14
Evaluated at bid price : 20.14
Bid-YTW : 6.04 %
PWF.PR.I Perpetual-Discount 1.43 % YTW SCENARIO
Maturity Type : Limit Maturity
Maturity Date : 2039-08-05
Maturity Price : 24.44
Evaluated at bid price : 24.75
Bid-YTW : 6.10 %
HSB.PR.D Perpetual-Discount 1.44 % YTW SCENARIO
Maturity Type : Limit Maturity
Maturity Date : 2039-08-05
Maturity Price : 21.10
Evaluated at bid price : 21.10
Bid-YTW : 6.01 %
TD.PR.Q Perpetual-Discount 1.44 % YTW SCENARIO
Maturity Type : Limit Maturity
Maturity Date : 2039-08-05
Maturity Price : 24.39
Evaluated at bid price : 24.61
Bid-YTW : 5.72 %
BNS.PR.J Perpetual-Discount 1.49 % YTW SCENARIO
Maturity Type : Limit Maturity
Maturity Date : 2039-08-05
Maturity Price : 22.37
Evaluated at bid price : 23.09
Bid-YTW : 5.69 %
BAM.PR.P FixedReset 1.50 % YTW SCENARIO
Maturity Type : Call
Maturity Date : 2014-10-30
Maturity Price : 25.00
Evaluated at bid price : 27.00
Bid-YTW : 5.54 %
MFC.PR.C Perpetual-Discount 1.57 % YTW SCENARIO
Maturity Type : Limit Maturity
Maturity Date : 2039-08-05
Maturity Price : 19.36
Evaluated at bid price : 19.36
Bid-YTW : 5.91 %
MFC.PR.B Perpetual-Discount 1.64 % YTW SCENARIO
Maturity Type : Limit Maturity
Maturity Date : 2039-08-05
Maturity Price : 19.83
Evaluated at bid price : 19.83
Bid-YTW : 5.96 %
BAM.PR.J OpRet 1.64 % YTW SCENARIO
Maturity Type : Soft Maturity
Maturity Date : 2018-03-30
Maturity Price : 25.00
Evaluated at bid price : 24.15
Bid-YTW : 6.03 %
TD.PR.R Perpetual-Discount 1.65 % YTW SCENARIO
Maturity Type : Limit Maturity
Maturity Date : 2039-08-05
Maturity Price : 24.46
Evaluated at bid price : 24.68
Bid-YTW : 5.71 %
SLF.PR.D Perpetual-Discount 1.73 % YTW SCENARIO
Maturity Type : Limit Maturity
Maturity Date : 2039-08-05
Maturity Price : 18.78
Evaluated at bid price : 18.78
Bid-YTW : 6.01 %
BAM.PR.M Perpetual-Discount 1.86 % YTW SCENARIO
Maturity Type : Limit Maturity
Maturity Date : 2039-08-05
Maturity Price : 17.01
Evaluated at bid price : 17.01
Bid-YTW : 7.10 %
BAM.PR.N Perpetual-Discount 2.11 % YTW SCENARIO
Maturity Type : Limit Maturity
Maturity Date : 2039-08-05
Maturity Price : 16.90
Evaluated at bid price : 16.90
Bid-YTW : 7.14 %
IAG.PR.A Perpetual-Discount 2.16 % YTW SCENARIO
Maturity Type : Limit Maturity
Maturity Date : 2039-08-05
Maturity Price : 18.42
Evaluated at bid price : 18.42
Bid-YTW : 6.34 %
MFC.PR.A OpRet 2.26 % YTW SCENARIO
Maturity Type : Call
Maturity Date : 2010-07-19
Maturity Price : 26.25
Evaluated at bid price : 26.66
Bid-YTW : 2.79 %
BNA.PR.C SplitShare 2.55 % YTW SCENARIO
Maturity Type : Hard Maturity
Maturity Date : 2019-01-10
Maturity Price : 25.00
Evaluated at bid price : 18.51
Bid-YTW : 8.57 %
RY.PR.F Perpetual-Discount 2.58 % YTW SCENARIO
Maturity Type : Limit Maturity
Maturity Date : 2039-08-05
Maturity Price : 19.85
Evaluated at bid price : 19.85
Bid-YTW : 5.62 %
W.PR.J Perpetual-Discount 2.76 % YTW SCENARIO
Maturity Type : Limit Maturity
Maturity Date : 2039-08-05
Maturity Price : 22.77
Evaluated at bid price : 23.05
Bid-YTW : 6.13 %
Volume Highlights
Issue Index Shares
Traded
Notes
HSB.PR.E FixedReset 109,703 Nesbitt crossed 60,000 at 27.80 and 40,000 at 27.81.
YTW SCENARIO
Maturity Type : Call
Maturity Date : 2014-07-30
Maturity Price : 25.00
Evaluated at bid price : 27.80
Bid-YTW : 4.30 %
ACO.PR.A OpRet 102,553 Desjardins crossed 100,000 at 26.50.
YTW SCENARIO
Maturity Type : Call
Maturity Date : 2009-09-04
Maturity Price : 26.00
Evaluated at bid price : 26.50
Bid-YTW : -5.86 %
RY.PR.A Perpetual-Discount 68,050 RBC crossed blocks of 40,000 and 10,000 shares, both at 19.75.
YTW SCENARIO
Maturity Type : Limit Maturity
Maturity Date : 2039-08-05
Maturity Price : 19.76
Evaluated at bid price : 19.76
Bid-YTW : 5.65 %
BMO.PR.O FixedReset 64,100 YTW SCENARIO
Maturity Type : Call
Maturity Date : 2014-06-24
Maturity Price : 25.00
Evaluated at bid price : 27.77
Bid-YTW : 3.97 %
MFC.PR.D FixedReset 64,030 RBC crossed 50,000 at 28.00.
YTW SCENARIO
Maturity Type : Call
Maturity Date : 2014-07-19
Maturity Price : 25.00
Evaluated at bid price : 28.02
Bid-YTW : 4.13 %
BNS.PR.L Perpetual-Discount 61,581 RBC crossed 50,200 at 19.92.
YTW SCENARIO
Maturity Type : Limit Maturity
Maturity Date : 2039-08-05
Maturity Price : 20.00
Evaluated at bid price : 20.00
Bid-YTW : 5.67 %
There were 54 other index-included issues trading in excess of 10,000 shares.
Market Action

August 4, 2009

The Bank for International Settlements has released a paper by Fabio Panetta, Thomas Faeh, Giuseppe Grande, Corrinne Ho, Michael King, Aviram Levy, Federico M Signoretti, Marco Taboga and Andrea Zaghini, An assessment of financial sector rescue programmes:

We analyse the wide array of rescue programmes adopted in several countries, following Lehman Brothers’ default in September 2008, in order to support banks and other financial institutions. We first provide an overview of the programmes, comparing their characteristics, magnitudes and participation rates across countries. We then consider the effects of the programmes on banks’ risk and valuation, looking at the behaviour of CDS premia and stock prices. We then proceed to analyse the issuance of government guaranteed bonds by banks, examining their impact on banks’ funding and highlighting undesired effects and distortions. Finally, we briefly review the recent evolution of bank lending to the private sector. We draw policy implications, in particular as regards the way of mitigating the distortions implied by such programmes and the need for an exit strategy

Paul Krugman wrote a piece in the New York Times titled Rewarding Bad Actors, which dealt in part with High Frequency Trading:

It’s hard to imagine a better illustration than high-frequency trading. The stock market is supposed to allocate capital to its most productive uses, for example by helping companies with good ideas raise money. But it’s hard to see how traders who place their orders one-thirtieth of a second faster than anyone else do anything to improve that social function.

And there’s a good case that such activities are actually harmful. For example, high-frequency trading probably degrades the stock market’s function, because it’s a kind of tax on investors who lack access to those superfast computers — which means that the money Goldman spends on those computers has a negative effect on national wealth. As the great Stanford economist Kenneth Arrow put it in 1973, speculation based on private information imposes a “double social loss”: it uses up resources and undermines markets.

Far be it from me to dismiss the thoughts of a Nobel-winning economist, but I fail to see his point here – at the very least, it needs elucidation.

Mr. Krugman implies that there is a lower limit to trading reaction speed, below which improvements in reaction time have deleterious effects on national wealth. I don’t see how you would go about defining such a thing. It should also be noted that High Frequency Trading does not necessarily have anything to do with Flash Orders; HFT is simply a method of arbitrage. If, for instance, there is a huge seller of SLF.PR.A, and I can arbitrage that by selling SLF.PR.E to buy it, surely this is a Good Thing for capital markets, and the faster the better? HFT deepens the markets by converting supply and demand for one particular financial instrument into supply and demand for related financial instruments; deepening the market and providing better liquidity for those who want it.

From the point of view of the original seller of SLF.PR.A, I’m doing him a favour … instead of taking trading costs of ten cents per share, he’s only spending nine cents. My nine-cent reward for executing the near-arbitrage (it’s not pure arbitrage since the two issues are not interconvertible) serves as a carrot for my competition … if they can do it faster, stronger, better, the original seller’s cost will drop to eight cents – and they’ll get to keep it all while I go back to the drawing board in an effort to make it seven cents.

But it looks like Flash Orders will be banned. I must say, I’m disappointed with the press coverage of the issue: I haven’t seen an interview anywhere with a supporter (or at least a user) of Flash Orders, willing to stand up on his hind legs and say ‘Flash Orders are Good because …’. But that’s modern journalism for you … all they do nowadays is copy things down from press releases and occasionally call the number at the bottom so they can claim they’ve got an exclusive.

A rip-roaring day for PerpetualDiscounts, with FixedResets doing quite well but trailing badly and shut out of the volume tables.

HIMIPref™ Preferred Indices
These values reflect the December 2008 revision of the HIMIPref™ Indices

Values are provisional and are finalized monthly
Index Mean
Current
Yield
(at bid)
Median
YTW
Median
Average
Trading
Value
Median
Mod Dur
(YTW)
Issues Day’s Perf. Index Value
Ratchet 0.00 % 0.00 % 0 0.00 0 2.0893 % 1,244.8
FixedFloater 7.11 % 5.28 % 42,111 16.90 1 0.3279 % 2,160.6
Floater 3.66 % 3.68 % 72,454 18.10 2 2.0893 % 1,555.1
OpRet 4.89 % -6.03 % 141,272 0.10 15 0.3218 % 2,257.9
SplitShare 5.82 % 6.63 % 97,262 4.12 3 0.4891 % 1,995.7
Interest-Bearing 0.00 % 0.00 % 0 0.00 0 0.3218 % 2,064.7
Perpetual-Premium 5.74 % 5.58 % 76,837 13.86 4 -0.1885 % 1,845.8
Perpetual-Discount 5.97 % 6.04 % 171,813 13.82 67 0.8545 % 1,717.7
FixedReset 5.49 % 4.04 % 556,396 4.15 40 0.2404 % 2,099.4
Performance Highlights
Issue Index Change Notes
W.PR.J Perpetual-Discount -1.02 % YTW SCENARIO
Maturity Type : Limit Maturity
Maturity Date : 2039-08-04
Maturity Price : 22.15
Evaluated at bid price : 22.43
Bid-YTW : 6.30 %
MFC.PR.C Perpetual-Discount 1.01 % YTW SCENARIO
Maturity Type : Limit Maturity
Maturity Date : 2039-08-04
Maturity Price : 19.06
Evaluated at bid price : 19.06
Bid-YTW : 6.00 %
PWF.PR.I Perpetual-Discount 1.04 % YTW SCENARIO
Maturity Type : Limit Maturity
Maturity Date : 2039-08-04
Maturity Price : 24.09
Evaluated at bid price : 24.40
Bid-YTW : 6.18 %
SLF.PR.F FixedReset 1.04 % YTW SCENARIO
Maturity Type : Call
Maturity Date : 2014-07-30
Maturity Price : 25.00
Evaluated at bid price : 27.30
Bid-YTW : 4.27 %
BMO.PR.K Perpetual-Discount 1.04 % YTW SCENARIO
Maturity Type : Limit Maturity
Maturity Date : 2039-08-04
Maturity Price : 23.09
Evaluated at bid price : 23.25
Bid-YTW : 5.75 %
W.PR.H Perpetual-Discount 1.04 % YTW SCENARIO
Maturity Type : Limit Maturity
Maturity Date : 2039-08-04
Maturity Price : 21.89
Evaluated at bid price : 22.25
Bid-YTW : 6.23 %
RY.PR.H Perpetual-Discount 1.07 % YTW SCENARIO
Maturity Type : Limit Maturity
Maturity Date : 2039-08-04
Maturity Price : 24.39
Evaluated at bid price : 24.60
Bid-YTW : 5.75 %
IAG.PR.C FixedReset 1.07 % YTW SCENARIO
Maturity Type : Call
Maturity Date : 2014-01-30
Maturity Price : 25.00
Evaluated at bid price : 27.39
Bid-YTW : 4.03 %
SLF.PR.C Perpetual-Discount 1.09 % YTW SCENARIO
Maturity Type : Limit Maturity
Maturity Date : 2039-08-04
Maturity Price : 18.51
Evaluated at bid price : 18.51
Bid-YTW : 6.10 %
CM.PR.J Perpetual-Discount 1.12 % YTW SCENARIO
Maturity Type : Limit Maturity
Maturity Date : 2039-08-04
Maturity Price : 18.98
Evaluated at bid price : 18.98
Bid-YTW : 5.98 %
RY.PR.X FixedReset 1.13 % YTW SCENARIO
Maturity Type : Call
Maturity Date : 2014-09-23
Maturity Price : 25.00
Evaluated at bid price : 27.78
Bid-YTW : 3.84 %
CIU.PR.A Perpetual-Discount 1.14 % YTW SCENARIO
Maturity Type : Limit Maturity
Maturity Date : 2039-08-04
Maturity Price : 20.40
Evaluated at bid price : 20.40
Bid-YTW : 5.75 %
BAM.PR.M Perpetual-Discount 1.15 % YTW SCENARIO
Maturity Type : Limit Maturity
Maturity Date : 2039-08-04
Maturity Price : 16.70
Evaluated at bid price : 16.70
Bid-YTW : 7.23 %
GWO.PR.I Perpetual-Discount 1.17 % YTW SCENARIO
Maturity Type : Limit Maturity
Maturity Date : 2039-08-04
Maturity Price : 19.02
Evaluated at bid price : 19.02
Bid-YTW : 6.00 %
BNS.PR.K Perpetual-Discount 1.25 % YTW SCENARIO
Maturity Type : Limit Maturity
Maturity Date : 2039-08-04
Maturity Price : 20.99
Evaluated at bid price : 20.99
Bid-YTW : 5.76 %
RY.PR.C Perpetual-Discount 1.32 % YTW SCENARIO
Maturity Type : Limit Maturity
Maturity Date : 2039-08-04
Maturity Price : 20.02
Evaluated at bid price : 20.02
Bid-YTW : 5.76 %
BAM.PR.B Floater 1.33 % YTW SCENARIO
Maturity Type : Limit Maturity
Maturity Date : 2039-08-04
Maturity Price : 10.70
Evaluated at bid price : 10.70
Bid-YTW : 3.71 %
ELF.PR.F Perpetual-Discount 1.35 % YTW SCENARIO
Maturity Type : Limit Maturity
Maturity Date : 2039-08-04
Maturity Price : 19.46
Evaluated at bid price : 19.46
Bid-YTW : 6.89 %
ELF.PR.G Perpetual-Discount 1.38 % YTW SCENARIO
Maturity Type : Limit Maturity
Maturity Date : 2039-08-04
Maturity Price : 17.65
Evaluated at bid price : 17.65
Bid-YTW : 6.81 %
HSB.PR.D Perpetual-Discount 1.41 % YTW SCENARIO
Maturity Type : Limit Maturity
Maturity Date : 2039-08-04
Maturity Price : 20.80
Evaluated at bid price : 20.80
Bid-YTW : 6.10 %
NA.PR.L Perpetual-Discount 1.45 % YTW SCENARIO
Maturity Type : Limit Maturity
Maturity Date : 2039-08-04
Maturity Price : 20.95
Evaluated at bid price : 20.95
Bid-YTW : 5.82 %
MFC.PR.B Perpetual-Discount 1.46 % YTW SCENARIO
Maturity Type : Limit Maturity
Maturity Date : 2039-08-04
Maturity Price : 19.51
Evaluated at bid price : 19.51
Bid-YTW : 6.06 %
BNS.PR.O Perpetual-Discount 1.50 % YTW SCENARIO
Maturity Type : Limit Maturity
Maturity Date : 2039-08-04
Maturity Price : 24.21
Evaluated at bid price : 24.42
Bid-YTW : 5.77 %
BNS.PR.N Perpetual-Discount 1.52 % YTW SCENARIO
Maturity Type : Limit Maturity
Maturity Date : 2039-08-04
Maturity Price : 22.64
Evaluated at bid price : 22.78
Bid-YTW : 5.80 %
SLF.PR.E Perpetual-Discount 1.57 % YTW SCENARIO
Maturity Type : Limit Maturity
Maturity Date : 2039-08-04
Maturity Price : 18.80
Evaluated at bid price : 18.80
Bid-YTW : 6.07 %
GWO.PR.F Perpetual-Discount 1.58 % YTW SCENARIO
Maturity Type : Limit Maturity
Maturity Date : 2039-08-04
Maturity Price : 24.19
Evaluated at bid price : 24.48
Bid-YTW : 6.10 %
TD.PR.O Perpetual-Discount 1.60 % YTW SCENARIO
Maturity Type : Limit Maturity
Maturity Date : 2039-08-04
Maturity Price : 21.60
Evaluated at bid price : 21.60
Bid-YTW : 5.66 %
BNA.PR.C SplitShare 1.63 % YTW SCENARIO
Maturity Type : Hard Maturity
Maturity Date : 2019-01-10
Maturity Price : 25.00
Evaluated at bid price : 18.05
Bid-YTW : 8.93 %
TD.PR.P Perpetual-Discount 1.65 % YTW SCENARIO
Maturity Type : Limit Maturity
Maturity Date : 2039-08-04
Maturity Price : 23.21
Evaluated at bid price : 23.38
Bid-YTW : 5.65 %
RY.PR.W Perpetual-Discount 1.89 % YTW SCENARIO
Maturity Type : Limit Maturity
Maturity Date : 2039-08-04
Maturity Price : 21.61
Evaluated at bid price : 21.61
Bid-YTW : 5.69 %
SLF.PR.B Perpetual-Discount 1.90 % YTW SCENARIO
Maturity Type : Limit Maturity
Maturity Date : 2039-08-04
Maturity Price : 19.88
Evaluated at bid price : 19.88
Bid-YTW : 6.12 %
MFC.PR.A OpRet 2.08 % YTW SCENARIO
Maturity Type : Soft Maturity
Maturity Date : 2015-12-18
Maturity Price : 25.00
Evaluated at bid price : 26.07
Bid-YTW : 3.45 %
BAM.PR.J OpRet 2.15 % YTW SCENARIO
Maturity Type : Soft Maturity
Maturity Date : 2018-03-30
Maturity Price : 25.00
Evaluated at bid price : 23.76
Bid-YTW : 6.27 %
PWF.PR.E Perpetual-Discount 2.24 % YTW SCENARIO
Maturity Type : Limit Maturity
Maturity Date : 2039-08-04
Maturity Price : 21.96
Evaluated at bid price : 22.35
Bid-YTW : 6.18 %
SLF.PR.A Perpetual-Discount 2.38 % YTW SCENARIO
Maturity Type : Limit Maturity
Maturity Date : 2039-08-04
Maturity Price : 19.79
Evaluated at bid price : 19.79
Bid-YTW : 6.09 %
BAM.PR.K Floater 2.86 % YTW SCENARIO
Maturity Type : Limit Maturity
Maturity Date : 2039-08-04
Maturity Price : 10.80
Evaluated at bid price : 10.80
Bid-YTW : 3.68 %
HSB.PR.C Perpetual-Discount 2.88 % YTW SCENARIO
Maturity Type : Limit Maturity
Maturity Date : 2039-08-04
Maturity Price : 21.47
Evaluated at bid price : 21.77
Bid-YTW : 5.92 %
Volume Highlights
Issue Index Shares
Traded
Notes
SLF.PR.B Perpetual-Discount 182,531 YTW SCENARIO
Maturity Type : Limit Maturity
Maturity Date : 2039-08-04
Maturity Price : 19.88
Evaluated at bid price : 19.88
Bid-YTW : 6.12 %
RY.PR.B Perpetual-Discount 50,395 YTW SCENARIO
Maturity Type : Limit Maturity
Maturity Date : 2039-08-04
Maturity Price : 20.40
Evaluated at bid price : 20.40
Bid-YTW : 5.78 %
BAM.PR.B Floater 44,318 YTW SCENARIO
Maturity Type : Limit Maturity
Maturity Date : 2039-08-04
Maturity Price : 10.70
Evaluated at bid price : 10.70
Bid-YTW : 3.71 %
CM.PR.I Perpetual-Discount 39,083 YTW SCENARIO
Maturity Type : Limit Maturity
Maturity Date : 2039-08-04
Maturity Price : 19.65
Evaluated at bid price : 19.65
Bid-YTW : 6.03 %
BNS.PR.N Perpetual-Discount 33,803 YTW SCENARIO
Maturity Type : Limit Maturity
Maturity Date : 2039-08-04
Maturity Price : 22.64
Evaluated at bid price : 22.78
Bid-YTW : 5.80 %
CM.PR.H Perpetual-Discount 33,097 YTW SCENARIO
Maturity Type : Limit Maturity
Maturity Date : 2039-08-04
Maturity Price : 20.11
Evaluated at bid price : 20.11
Bid-YTW : 6.02 %
There were 44 other index-included issues trading in excess of 10,000 shares.
Miscellaneous News

Treasury to Increase TIPS Issuance

The US Department of the Treasury has announced:

The balance of our financing requirements will be met with weekly bills; monthly 52-week bills; monthly 2-year, 3-year, 5-year, and 7-year notes; the September and October 10-year note and 30-year bond reopenings; and the October 5-year and 10-year TIPS reopenings.

Currently we believe our existing suite of nominal securities is sufficient to address our borrowing needs; however, market participants should expect auction sizes to continue to rise in a gradual manner over the medium term. In addition, to increase our flexibility, issuance of Treasury inflation-indexed securities will also increase gradually.

Nevertheless, Treasury will continue to monitor projected financing needs and make adjustments to the auction calendar, if necessary. These include, but are not limited to, the reintroduction or establishment of other benchmark securities or other changes to the auction calendar for existing nominal and inflation-indexed securities.

Treasury is committed to issuing TIPS in a regular and predictable manner across the yield curve. These securities are an important part of our overall debt management strategy, and market participants can expect issuance to gradually increase in FY 2010.

Additionally, to potentially improve liquidity in the TIPS program and better capture the premium associated with inflation protection, Treasury will consider replacing 20-year TIPS with 30-year TIPS.

Any potential changes to the TIPS program will be announced at the November 2009 refunding.

Across the Curve comments that in typical market fashion, this announcement resulted in an increase to TIPS prices:

TIPS bonds are besting their nominal rivals. In announcing that it would tinker with TIPS issuance the Treasury averred that increased offerings would not occur until 2010.

The widening of breakevens represents the howls of the shorts who had planned for an increase in issuance at this instant. Thirty year breakevens have moved to 227 basis points from 220 late yesterday.

The Wall Street Journal reports that increases to TIPS sizes is due to pressure from China:

China, the largest holder of U.S. government debt, is among investors that have indicated to the Treasury that they want to buy more of the securities, which offer protection against rising inflation, the people said.

Officials from the U.S. and China discussed TIPS issuance at high-level talks in Washington last week.

China is getting assertive! They roiled the market a while ago when they decreased their holdings of Agencies and now they’re demanding inflation protection. Well, he who pays the piper … I have always thought that America’s fiscal profligacy will not reverse until it sinks in on Joe Sixpack’s political thoughts that the rate he pays on his mortgage is set in Beijing.

MAPF

MAPF Performance: July 2009

The fund performed well as the preferred share recovery now looks pretty solid. As noted in the report of Index Performance, July 2009, both the FixedReset and PerpetualDiscount posted strong gains, particularly in the latter half of the month following the TXPR Revision.

The fund’s performance was helped by its overweighting in PerpetualDiscount issues, as discussed in the post MAPF Portfolio Composition, but managed to outperform even the pure measure of PerpetualDiscount total return due to security selection and frequent trading. This has been accomplished while remaining fully invested in a portfolio with an overall composition that did not change much through the month – which is exactly what I seek to accomplish in managing the fund.

The fund’s Net Asset Value per Unit as of the close July 31 was $11.8181.

Returns to July 31, 2009
Period MAPF Index CPD
according to
Claymore
One Month +7.59% +4.46% +3.35%
Three Months +21.95% +11.49% +8.96%
One Year +56.59% +6.50% +5.24%
Two Years (annualized) +20.61% -0.79%  
Three Years (annualized) +15.38% -0.30%  
Four Years (annualized) +12.58% +0.54%  
Five Years (annualized) +11.51% ++1.43%  
Six Years (annualized) +12.76% +2.16%  
Seven Years (annualized) +12.85% +2.75%  
Eight Years (annualized) +12.65% +2.91%  
The Index is the BMO-CM “50”
MAPF returns assume reinvestment of dividends, and are shown after expenses but before fees.
CPD Returns are for the NAV and are after all fees and expenses.
Figures for Omega Preferred Equity (which are after all fees and expenses) for 1-, 3- and 12-months are +4.2%, +10.5% and +4.9%, respectively, according to Morningstar after all fees & expenses
Figures for Jov Leon Frazer Preferred Equity Fund (which are after all fees and expenses) for 1-, 3- and 12-months are N/A, N/A & N/A, respectively, according to Morningstar and the Globe and Mail
Figures for AIC Preferred Income Fund (which are after all fees and expenses) for 1-, 3- and 12-months are +2.5%, +4.1% & N/A, respectively

MAPF returns assume reinvestment of dividends, and are shown after expenses but before fees. Past performance is not a guarantee of future performance. You can lose money investing in Malachite Aggressive Preferred Fund or any other fund. For more information, see the fund’s main page.

I am very pleased with the returns, but implore Assiduous Readers not to project this level of outperformance for the indefinite future. The past year in the preferred share market has been filled with episodes of panic and euphoria, together with many new entrants who do not appear to know what they are doing; perfect conditions for a disciplined quantitative approach.

All I can say about the fund’s relative returns in the past year is … sometimes everything works. The fund seeks to earn incremental return by selling liquidity (that is, taking the other side of trades that other market participants are strongly motivated to execute), which can also be referred to as ‘trading noise’. There have been a lot of strongly motivated market participants in the past year, generating a lot of noise! Things won’t always be this good … but for as long as it lasts the fund will attempt to make hay while the sun shines.

A good example of “selling liquidity” is the fund’s accumulation of a position in SLF.PR.B during the month.

Trades Contributing to
the Accumulation of SLF.PR.B
July, 2009
Date SLF.PR.C SLF.PR.E SLF.PR.B
6/30
Bid
16.76 17.03 18.46
7/20 Sold
17.61
  Bought
18.65
7/22 Sold
18.06
  Bought
18.98
7/23 Sold
18.25
Sold
18.87
Bought
19.00
7/31
Closing Bid
18.31 18.51 19.52
Dividends
Ex-Date
     
This is an attempt to show fairly the effect of numerous trades in tabular form. The trades shown are not necessarily precise dollar-for-dollar swaps. Trade details will be released on the main MAPF web page in the future.

It may also be noted that SLF.PR.B still has an elevated yield relative to the average level for the Sun Life PerpetualDiscount issues:

SLF PerpetualDiscounts
Comparison, 2009-7-31
At Closing Bid
Ticker YTW
SLF.PR.A 6.23%
SLF.PR.B 6.24%
SLF.PR.C 6.16%
SLF.PR.D 6.15%
SLF.PR.E 6.16%

I believe that the trading opportunities amongst the SLF PerpetualDiscounts were triggered by a major seller of SLF.PR.A, which had an influence on the other issues that propogated at different rates while also influenced by a broad general demand for PerpetualDiscounts. In support of this hypothisis, I have uploaded three graphs (prepared by my firm’s analytical software, HIMIPref™):

This is mere explanation after the fact, however. At the time of trade, all that really mattered was that the fund could pick up yield by swapping between issues with identical credit quality and almost identical terms.

Another example of profitable trading was discussed as part of the post on portfolio composition.

There’s plenty of room for new money left in the fund. Just don’t expect the current level of outperformance every year, OK? While I will continue to exert utmost efforts to outperform, it should be borne in mind that beating the index by 500bp represents a good year, and there will almost inevitably be periods of underperformance in the future.

The yields available on high quality preferred shares remain elevated, which is reflected in the current estimate of sustainable income.

Calculation of MAPF Sustainable Income Per Unit
Month NAVPU Portfolio
Average
YTW
Leverage
Divisor
Securities
Average
YTW
Sustainable
Income
June, 2007 9.3114 5.16% 1.03 5.01% 0.4665
September 9.1489 5.35% 0.98 5.46% 0.4995
December, 2007 9.0070 5.53% 0.942 5.87% 0.5288
March, 2008 8.8512 6.17% 1.047 5.89% 0.5216
June 8.3419 6.034% 0.952 6.338% $0.5287
September 8.1886 7.108% 0.969 7.335% $0.6006
December, 2008 8.0464 9.24% 1.008 9.166% $0.7375
March 2009 $8.8317 8.60% 0.995 8.802% $0.7633
June 10.9846 7.05% 0.999 7.057% $0.7752
July 2009 11.8181 6.44% 0.993 6.485% $0.7664
NAVPU is shown after quarterly distributions.
“Portfolio YTW” includes cash (or margin borrowing), with an assumed interest rate of 0.00%
“Securities YTW” divides “Portfolio YTW” by the “Leverage Divisor” to show the average YTW on the securities held; this assumes that the cash is invested in (or raised from) all securities held, in proportion to their holdings.
“Sustainable Income” is the resultant estimate of the fund’s dividend income per unit, before fees and expenses.

As discussed in the post MAPF Portfolio Composition: July 2009, the fund has positions in splitShares (almost all BNA.PR.C) and an operating retractible, both of which have high yields that are not sustainable: at some point they will be called or mature and the funds will have to be reinvested. Therefore, both of these positions skew the calculation upwards.. Since the yield on these positions is higher than that of the perpetuals despite the fact that the term is limited, the sustainability of the calculated “sustainable yield” is suspect, as discussed in August, 2008.

Significant positions were also held in Fixed-Reset issues on July 31; all of which currently have their yields calculated with the presumption that they will be called by the issuers at par at the first possible opportunity. It is the increase in exposure to the lower-yielding Fixed-Reset class that accounts for the apparent stall in the increase of sustainable income per unit in the past seven months. In December 2008, FixedReset exposure was zero; it is now 11.3%. Exposure to the extraordinarily high-yielding SplitShare class has also been reduced since December due to credit concerns.

However, if the entire portfolio except for the PerpetualDiscounts were to be sold and reinvested in these issues, the yield of the portfolio would be the 6.14% shown in the July 31 Portfolio Composition analysis (which is in excess of the 6.06% index yield on July 31). Given such reinvestment, the sustainable yield would be 11.8181 * 0.0614 = $0.7256, an increase from the $0.7228 derived by a similar calculation last month.

Different assumptions lead to different results from the calculation, but the overall positive trend is apparent. I’m very pleased with the results! It will be noted that if there was no trading in the portfolio, one would expect the sustainable yield to be constant (before fees and expenses). The success of the fund’s trading is showing up in

  • the very good performance against the index
  • the long term increases in sustainable income per unit

As has been noted, the fund has maintained a credit quality equal to or better than the index; outperformance is due to constant exploitation of trading anomalies.

Again, there are no predictions for the future! The fund will continue to trade between issues in an attempt to exploit market gaps in liquidity, in an effort to outperform the index and keep the sustainable income per unit – however calculated! – growing.

MAPF

MAPF Portfolio Composition: July 2009

Trading activity eased slightly in July, with portfolio turnover of about 100%, while the market extended its gains.

Trades were, as ever, triggered by a desire to exploit transient mispricing in the preferred share market (which may the thought of as “selling liquidity”), rather than any particular view being taken on market direction, sectoral performance or credit anticipation.

MAPF Sectoral Analysis 2009-7-31
HIMI Indices Sector Weighting YTW ModDur
Ratchet 0% N/A N/A
FixFloat 0% N/A N/A
Floater 0% N/A N/A
OpRet 0% N/A N/A
SplitShare 10.1% (-0.6) 8.99%% 7.01
Interest Rearing 0% N/A N/A
PerpetualPremium 0.6% (+0.6) 5.49% 2.64
PerpetualDiscount 71.9 (-0.3) 6.14% 13.69
Fixed-Reset 11.3% (-0.2) 4.18% 4.22
Scraps (OpRet) 5.2% (-0.4) 11.59% 6.00
Cash +0.7% (+0.6) 0.00% 0.00
Total 100% 6.44% 11.37
Totals and changes will not add precisely due to rounding. Bracketted figures represent change from June month-end. Cash is included in totals with duration and yield both equal to zero.

The “total” reflects the un-leveraged total portfolio (i.e., cash is included in the portfolio calculations and is deemed to have a duration and yield of 0.00.). MAPF will often have relatively large cash balances, both credit and debit, to facilitate trading. Figures presented in the table have been rounded to the indicated precision.

Not much change in the sectoral distribution!

Credit distribution is:

MAPF Credit Analysis 2009-7-31
DBRS Rating Weighting
Pfd-1 0.3% (-0.1)
Pfd-1(low) 81.5% (+14.3)
Pfd-2(high) 2.0% (-11.8)
Pfd-2 0.3% (+0.3)
Pfd-2(low) 9.8% (-3.4)
Pfd-3(high) 5.2% (-0.4)
Cash +0.7% (+0.6)
Totals will not add precisely due to rounding. Bracketted figures represent change from June month-end.

The shift from Pfd-2(high) to Pfd-1(low) is attributable to sale of some POW issues (Pfd-2(high)) in the PerpetualDiscount sector to fund the purchase of GWO PerpetualDiscounts (Pfd-1(low)):

Trades Contributing to
the Shift from Pfd-2(high) to Pfd-1(low)
July, 2009
Date POW.PR.B GWO.PR.H GWO.PR.G
6/30
Bid
20.10 18.70 20.61
7/16 Sold
20.43
Bought
18.75
 
7/17 Sold
20.46
Bought
18.75
 
7/23 Sold
20.96
  Bought
20.50
7/24 Sold
21.00
  Bought
20.75
7/31
Closing Bid
21.45 20.10 21.78
Dividends
Ex-Date
     
This is an attempt to show fairly the effect of numerous trades in tabular form. The trades shown are not necessarily precise dollar-for-dollar swaps. Trade details will be released on the main MAPF web page in the future.

The fund does not set any targets for overall credit quality; trades are executed one by one. Variances in overall credit will be constant as opportunistic trades are executed. The overall credit quality of the portfolio is now superior to the credit quality of CPD at August month-end (when adjusted for the downgrades of BCE and the banks).

Claymore provides the following ratings breakdown:

Ratings Breakdown
as of 12/31/08
Pfd-1 61.15%
Pfd-2 23.26%
Pfd-3 15.60%

Three events have occurred since the Dec. 31 calculation date of CPD’s credit quality:

Liquidity Distribution is:

MAPF Liquidity Analysis 2009-7-31
Average Daily Trading Weighting
<$50,000 0.3% (-3.0)
$50,000 – $100,000 11.2% (-10.0)
$100,000 – $200,000 5.8% (-20.1)
$200,000 – $300,000 49.6% (+34.5)
>$300,000 31.9% (-1.6%)
Cash +0.7% (+0.6)
Totals will not add precisely due to rounding. Bracketted figures represent change from June month-end.

There is no real pattern to the increase in liquidity experienced this month. For instance, a positions in SLF.PR.C (ATV = 167,986) and SLF.PR.E (ATV = 185,774) were swapped into SLF.PR.B (ATV = 239,639). The trades from POW to GWO (partially noted above) also contributed to the increase, as did trades from BPO into YPG.

MAPF is, of course, Malachite Aggressive Preferred Fund, a “unit trust” managed by Hymas Investment Management Inc. Further information and links to performance, audited financials and subscription information are available the fund’s web page. A “unit trust” is like a regular mutual fund, but is sold by offering memorandum rather than prospectus. This is cheaper, but means subscription is restricted to “accredited investors” (as defined by the Ontario Securities Commission) and those who subscribe for $150,000+. Fund past performances are not a guarantee of future performance. You can lose money investing in MAPF or any other fund.

A similar portfolio composition analysis has been performed on The Claymore Preferred Share ETF (symbol CPD) as of August 29. When comparing CPD and MAPF:

  • MAPF credit quality is better
  • MAPF liquidity is similar (although CPD now has a lot of entries in the ‘super-heavy’ >300,000 class)
  • MAPF Yield is higher
  • Weightings in
    • MAPF is more exposed to PerpetualDiscounts
    • MAPF is much less exposed to Operating Retractibles
    • MAPF is more exposed to SplitShares
    • MAPF is less exposed to FixFloat / Floater / Ratchet
    • MAPF weighting in FixedResets is much lower
Index Construction / Reporting

Index Performance: July 2009

Performance of the HIMIPref™ Indices for July, 2009, was:

Total Return
Index Performance
July 2009
Three Months
to
July 30, 2009
Ratchet +2.74% * +25.62% *
FixFloat +1.14% +37.20% **
Floater +2.74% +25.62%
OpRet +1.91% +5.28%
SplitShare +4.48% +12.48%
Interest +1.91%**** +3.98%****
PerpetualPremium +5.74%*** +12.05%***
PerpetualDiscount +5.74% +12.05%
FixedReset +3.03% +7.98%
* The last member of the RatchetRate index was transferred to Scraps at the February, 2009, rebalancing; subsequent performance figures are set equal to the Floater index
** The last member of the FixedFloater index was transferred to Scraps at the February, 2009, rebalancing. Performance figures to 2009-5-29 are set equal to the Floater index. The FixedFloater index acquired a member on 2009-5-29.
*** The last member of the PerpetualPremium index was transferred to PerpetualDiscount at the October, 2008, rebalancing; subsequent performance figures are set equal to the PerpetualDiscount index. The PerpetualPremium index acquired four new members at the July, 2009, rebalancing.
**** The last member of the InterestBearing index was transferred to Scraps at the June, 2009, rebalancing; subsequent performance figures are set equal to the OperatingRetractible index
Passive Funds (see below for calculations)
CPD +3.35% +8.96%
DPS.UN +4.45% +13.62%
Index
BMO-CM 50 +4.46% +11.45%

I believe the rather startling underperformance of CPD relative to DPS.UN is due to the former overweighting and the latter underweighting FixedReset issues which, while having (unsustainably!) strong results over the past three months, have underperformed PerpetualDiscounts. A measure of payback from the results for the period ending November, 2008 in which the relative performance of these two preferred share classes was … somewhat different!

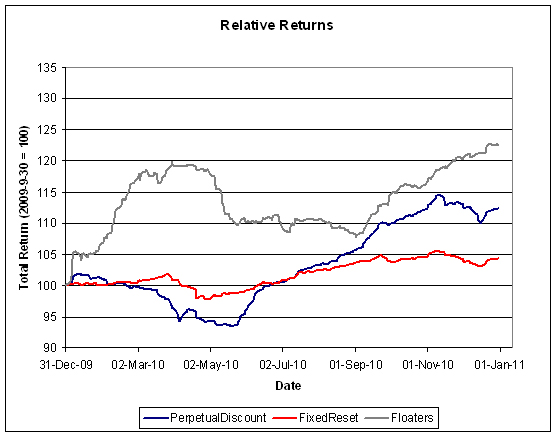
Index performance over the trailing year is starting to look a little more normal – quite a feat when you consider that it includes the wild October-January period! Normal, that is, except for FloatingRate issues:


Click for big

Claymore has published NAV and distribution data (problems with the page in IE8 can be kludged by using compatibility view) for its exchange traded fund (CPD) and I have derived the following table:

CPD Return, 1- & 3-month, to July, 2009
Date NAV Distribution Return for Sub-Period Monthly Return
April 30 15.27      
May 29, 2009 15.88 0.00   +3.99%
June 25 15.88 0.2100 +1.32% +1.38%
June 30, 2009 15.89   +0.06%
July 31, 2009 16.42     +3.35%
Quarterly Return +8.96%

CPD was hurt by its July rebalancing, a phenomenon that I have remarked on previously. Assiduous Readers will recall that the July Rebalancing added (net) ten Fixed Resets vs a deletion of (net) six PerpetualDiscounts effective “at the open July 20”. Taking this as equivalent to the close on Friday July 17, let’s take a quick peek at how that particular decision has worked out.


Click for big

Claymore currently holds $224,222,293 in CPD assets, a stunning increase from the $84,005,161 reported in the Dec 31/08 Annual Report. It may well be that CPD’s migration towards liquidity at all cost (as defined by the TXPR index) has an entirely valid rationale … but it sure ain’t doing returns much good! I will note that July’s index churn is nothing new considering that the portfolio has been churned on every semi-annual rebalancing since inception; so one cannot draw a straight line between the near-tripling of assets and the July rebalancing.

The DPS.UN NAV for July 29 has been published so we may calculate the approximate July returns – which is kind of a nightmare this month because it includes the June distribution. First, it is necessary to look at CPD for the period June 24-26 …

CPD Return, June 24-26
Date NAV Distribution Return for Sub-Period Monthly Return
June 24, 2009 16.04      
June 25 15.88 0.21   +0.31%
June 26, 2009 15.87     -0.06%
June 24-26 Return +0.25%

This figure is required in order to estimate the NAV for DPS.UN on June 26.

DPS.UN NAV Return, July-ish 2009
Date NAV Distribution Return for period
Estimated June Ending Stub** -0.375%
June 24, 2009 18.56    
June 26, 2009 18.3064*** 0.30 +0.25%***
July 29, 2009 19.03   +3.95%
Estimated July Ending Stub +0.61% *
Estimated July Return +4.45%
** CPD had a NAV of $16.04 on June 24, paid $0.21 June 25 with a NAV of 15.88 and a NAV of $15.89 on June 30. The return for the period was therefore +0.375%. This figure is subtracted the DPS.UN period return to arrive at an estimate for the calendar month.
* CPD had a NAV of $16.32 on July 29 and a NAV of $16.42 on July 31. The return for the period was therefore +0.61%. This figure is added to the DPS.UN period return to arrive at an estimate for the calendar month.
*** The June 26 NAV following the distribution has been estimated by assuming that DPS.UN and CPD had the same return for the period June 24-26; see table above.
The July return for DPS.UN’s NAV is therefore the product of three period returns, -0.375%, +0.25%, +3.95% and +0.61% to arrive at an estimate for the calendar month of +4.45%

Now, to see the DPS.UN quarterly NAV approximate return, we refer to the calculations for May and June

DPS.UN NAV Returns, three-month-ish to end-July-ish, 2009
May-ish +6.35%
June-ish +2.28%
July-ish +4.45%
Three-months-ish +13.62%
Issue Comments

Best & Worst Performers: July 2009

These are total returns, with dividends presumed to have been reinvested at the bid price on the ex-date. The list has been restricted to issues in the HIMIPref™ indices.

July 2009
Issue Index DBRS Rating Monthly Performance Notes (“Now” means “July 31”)
BAM.PR.K Floater Pfd-2(low) -3.23% Was the third-worst performer in June.
PWF.PR.J OpRet Pfd-1(low) -0.27% Now with a pre-tax bid-YTW of 3.37% based on a bid of 25.76 and a softMaturity 2013-7-30 at 25.00.
CM.PR.A OpRet Pfd-1(low) +0.19% Now with a pre-tax bid-YTW of 13.74% based on a bid of 25.91 and a call 2009-8-30 at 25.50. Since dividend is $1.325 and CM saves $0.25 p.a. on the redemption price, it will probably survive until softMaturity 2011-7-30, when it will have realized a yield of 3.42% … but you’re taking your chances!
BAM.PR.H OpRet Pfd-2(low) +0.28% Now with a pre-tax bid-YTW of 5.17% based on a bid of 25.50 and a softMaturity 2012-3-30 at 25.00.
MFC.PR.A OpRet Pfd-1(low) +0.71% Now with a pre-tax bid-YTW of 3.82% based on a bid of 25.54 and a softMaturity 2015-12-18 at 25.00.
SLF.PR.C Perpetual-Discount Pfd-1(low) +9.25% Now with a pre-tax bid-YTW of 6.16% based on a bid of 18.31 and a limitMaturity.
SLF.PR.D Perpetua-lDiscount Pfd-1(low) +9.62% Now with a pre-tax bid-YTW of 6.15% based on a bid of 18.35 and a limitMaturity.
CIU.PR.A Perpetual-Discount Pfd-2(high) +9.92% Now with a pre-tax bid-YTW of 5.81% based on a bid of 20.17 and a limitMaturity. Was the fourth-worst performer in June.
BNA.PR.C SplitShare Pfd-2(low) +10.65% Now with a pre-tax bid-YTW of 9.15% based on a bid of 17.76 and a hardMaturity 2019-1-10 at 25.00. Was the best performer in June.
TRI.PR.B Floater Pfd-2(low) +10.93% Moved to Scraps at July rebalancing on volume concerns. Was the worst performer in June.
Index Construction / Reporting

HIMIPref™ Index Rebalancing: July 2009

HIMI Index Changes, July 31, 2009
Issue From To Because
TRI.PR.B FloatingRate Scraps Volume
CU.PR.A PerpetualDiscount PerpetualPremium Price
BMO.PR.L PerpetualDiscount PerpetualPremium Price
ENB.PR.A PerpetualDiscount PerpetualPremium Price
CU.PR.B PerpetualDiscount PerpetualPremium Price

At long last, the PerpetualPremium index has members again! It disappeared at the October 2008 Rebalancing, when CL.PR.B fell below 25.00. That issue nearly made it back into premium territory this month, but the bid at the close was exactly 25.00 … and when that happens, the issue in question doesn’t move.

There were the following intra-month changes:

HIMI Index Changes during July 2009
Issue Action Index Because
BNA.PR.D Add SplitShare New Issue
BNA.PR.A Delete SplitShare Redeemed