FixedReset Index Yield Sets New All-Time Low

November 4th, 2010

As briefly noted yesterday, the FixedReset Index set a new all-time low yield record as of the close November 3 with a mark of 2.88%.


Click for Big

This is all the more impressive since changes to the index in October added three lower-quality, higher-yielding issues to the index, which had an effect on the determination of the median yield.

To celebrate, I am publishing the constituents of the FixedReset index, sorted in various ways:

Given that the DEX Short-Term Corporate Index yields about 2.5% and the ZCS short term corporate ETF yields 2.4% before fees, a yield of 2.88% is not entirely unreasonable: the interest-equivalent is 4.03%, giving a pre-tax spread of about 150bp to cover things like the additional credit risk and extension risk of the FixedResets. But I’m not entirely convinced that the market actually thinks that way.

IAG Silent on Regulatory Change

November 4th, 2010

Industrial Alliance has released its third quarter financials, and managed to do so without mentioning any prospects for regulatory change. This is the same policy as was followed with the 2Q10 Shareholders’ Report.

However, it was another good quarter:

Top-line growth in the third quarter continued to show strong momentum. Premiums and deposits increased 15% to $1.4 billion and the value of new business rose 44% to $41.4 million. For the nine-month period, premiums and deposits were up 31% over 2009 and 7% over 2007 – the Company’s record year. This growth is fuelled primarily by the Individual Wealth Management sector that continues to benefit from stock market gains and high net sales.

Top-line growth in the third quarter continued to be strong for the fourth quarter in a row. Almost all sectors contributed to this growth, with Individual Wealth Management in the lead as a result of the upswing in equity markets. For the period ended September 30th, this sector had gross sales of $686.7 million, up 29% over the previous year, and net sales of $243.3 million, up 52% over 2009. For the first nine months of 2010, Industrial Alliance ranked second in Canada for net sales of segregated funds, with a 34.1% market share, and fifth in terms of net mutual fund sales.

There are a few changes planned for their asset mix and hedging practice:

Management has taken a number of initiatives to reduce its sensitivity to interest rate risk. These initiatives are in the process of being implemented and will include a 5% increase in the proportion of stocks backing long-term liabilities. Had these initiatives been in place at September 30, 2010, the Company expects that it would be able to absorb a 15% decline in equity markets and that provisions for future policy benefits would not have to be strengthened as long as the S&P/TSX remains above 10,500 points.

Additionally, as part of its risk management process, the Company has implemented a dynamic hedging program to manage the equity risk related to its guaranteed annuity (GMWB) product, effective October 20th, 2010. The GMWB portfolio represents approximately $1.5 billion of assets under management, including $900 million in equities. The Company also entered into a reinsurance agreement during the third quarter to share 60% of the longevity risk related to its $2.5 billion insured annuity block of business.

As far as current sensitivities are concerned:

The Company’s sensitivity analysis varies from one quarter to another according to numerous factors, including changes in the economic and financial environment and the normal evolution of the Company’s business. The results of these analyses show that the leeway the Company has to absorb potential market downturns remains very high overall.

At September 30, 2010, the analysis was as follows:

  • Stocks matched to the long-term liabilities – The Company believes that it will not have to strengthen its provisions for future policy benefits for stocks matched to long-term liabilities as long as the S&P/TSX index remains above 9,400 points.
  • Solvency ratio – The Company believes that the solvency ratio will stay above 175% as long as the S&P/TSX index remains above 7,650 points, and will stay above 150% as long as the S&P/TSX index remains above 6,450 points.
  • Ultimate reinvestment rate (“URR”) – The Company estimates that a 10 basis point decrease (or increase) in the ultimate reinvestment rate would require the provisions for future policy benefits to be strengthened (or would allow them to be released) by some $44 million after taxes.
  • Initial reinvestment rate (“IRR”) – The Company estimates that a 10 basis point decrease (or increase) in the initial reinvestment rate would require the provisions for future policy benefits to be strengthened (or would allow them to be released) by some $25 million after taxes.

They estimate that a sudden 10% decline in equity markets would take $18-million off their net income; unfortunately, they neither provide pro-forma figures reflecting the asset mix changes, nor provide estimates of the effect of larger equity market declines – which will, of course, not be proportional to the adverse effect of such a normal correction.

SLF Coy on Capital Rule Changes

November 4th, 2010

Sun Life Financial has released its 3Q10 Financials. They had a decent – not great – quarter, but I’m more interested in their commentary on the capital rules:

In Canada, the Office of the Superintendent of Financial Institutions Canada (OSFI) is considering a number of changes to the insurance company capital rules, including new guidelines that would establish stand-alone capital adequacy requirements for operating life insurance companies, such as Sun Life Assurance, and that would update OSFI’s regulatory guidance for non-operating insurance companies acting as holding companies, such as Sun Life Financial Inc.

These proposals from the US Treasury (hopping mad about AIG) are now over a year old and can’t be implemented too soon according to me. Julie Dickson alluded to the possibility in a speech.

In addition, OSFI may change the definition of available regulatory capital for determining regulatory capital to align insurance definitions with any changed definitions that emerge for banks under the proposed new Basel Capital Accord.

Presumably this (mainly) refers to efforts to make the loss-absorption potential of regulatory capital more explicit (although the proposals are framed in such a way that it simply represents a regulatory-political end-run around the bankruptcy courts).

OSFI is considering more sophisticated risk-based modeling approaches to Minimum Continuing Capital and Surplus Requirements (MCCSR), which could apply to segregated funds and other life insurance products. In particular, OSFI is considering how advanced modeling techniques can produce more robust and risk-sensitive capital requirements for Canadian life insurers. This process includes internal models for segregated fund guarantee exposures. On October 29, 2010 OSFI released a draft advisory, for consultation with the industry and other stakeholders, setting out revised criteria for determining segregated fund capital requirements using an approved model. It is proposed that the new criteria, when finalized, will apply to qualifying segregated fund guarantee models for business written on or after January 1, 2011. The Company is in the process of reviewing the advisory to determine the potential impact of the proposed changes, and will continue to actively participate in the accompanying consultation process.

It is very disappointing that they are not more specific, given that implementation is two months’ away.

In particular, the draft advisory on changes to existing capital requirements in respect of new segregated fund business may result in an increase in the capital requirements for variable annuity and segregated fund policies currently sold by the Company in the United States and Canada on and after the date the new rules come into effect. The Company competes with providers of variable annuity and segregated fund products that operate under different accounting and regulatory reporting bases in different countries, which may create differences in capital requirements, profitability and reported earnings on these products that may cause the Company to be at a disadvantage compared to some of its competitors in certain of its businesses. In addition, the final changes implemented as a result of OSFI’s review of internal models for in-force segregated fund guarantee exposures may materially change the capital required to support the Company’s in-force variable annuity and segregated fund guarantee business.

Scary words, but no meat in the sandwich.

Similar was their commentary on the proposed rules regarding hedging:

On July 30, 2010 the International Accounting Standards Board (IASB) issued an exposure draft for comment, which sets out recognition, measurement and disclosure principles for insurance contracts. The insurance contracts standard under IFRS, as currently drafted, proposes that liabilities be discounted at a rate that is independent of the assets used to support those liabilities. This is in contrast to current rules under Canadian GAAP, where changes in the measurement of assets supporting actuarial liabilities is largely offset by a corresponding change in the measurement of the liabilities.

The Company is in the process of reviewing the exposure draft, and is working with a number of industry groups and associations, including the Canadian Life and Health Insurance Association, which submitted a comment letter to the IASB on October 15, 2010. It is expected that measurement changes on insurance contracts, if implemented as drafted, will result in fundamental differences from current provisions in Canadian GAAP, which will in turn have a significant impact on the Company’s business activities. In addition, the IASB has a project on accounting for financial instruments, with changes to classification, measurement, impairment and hedging. It is expected the mandatory implementation of both these standards will be no earlier than 2013.

The IASB continues to make changes to other IFRSs and has a number of ongoing projects. The Company continues to monitor all of the IASB projects that are in progress with regards to the 2011 IFRS changeover plan to ensure timely implementation and accounting.

The proposed new standard has been discussed on PrefBlog. The CLHIA letter does not appear to have been made public by the CLHIA but has been published by IFRS. I can’t say I find the CLHIA arguments – or those of the sell-side analysts quoted in the appendix – particularly convincing. It boils down to another round of the market-value vs. historical cost debate, but they spend more time discussing why fair value will be so inconvenient than on why it is inferior.

As far as earnings are concerned:

Sun Life Financial reported net income attributable to common shareholders of $453 million for the quarter ended September 30, 2010, compared to a loss of $140 million in the third quarter of 2009. Net income in the third quarter of 2010 was favourably impacted by $156 million from improved equity market conditions, and $49 million from assumption changes and management actions. The Company increased its mortgage sectoral allowance by $57 million, which reduced net income by $40 million, in anticipation of continued pressure in the U.S. commercial mortgage market, however overall credit experience continued to show improvement over the prior year. The net impact from interest rates on third quarter results was not material as the unfavourable impact of lower interest rates was largely offset by favourable movement in interest rate swaps used for asset-liability management.

In its interim MD&A for the third quarter of 2009, the Company provided a range for its “estimated 2010 adjusted earnings from operations”(2) of $1.4 billion to $1.7 billion. Based on the assumptions and methodology used to determine the Company’s estimated adjusted earnings from operations, the Company’s adjusted earnings from operations for the third quarter of 2010 were $353 million and $1,087 million for the nine months ended September 30, 2010. Additional information can be found in this news release under the heading Estimated 2010 Adjusted Earnings from Operations.

So it looks like, at best, they’re going to just squeeze in to the bottom of that range.

Q3 2010 adjusted earnings from operations

($ millions) Q3’10
————————————————————————-
Adjusted earnings from operations(1) (after-tax) 353
Adjusting items:
Net equity market impact 156
Management actions and updates to actuarial estimates and
assumptions 49
Tax 16
Sectoral allowance in anticipation of continued pressure in
the U.S. commercial mortgage market (40)
Net interest rate impact (15)
Currency impact (6)
Other experience gains (losses) (includes $32 million
unfavourable mortality/morbidity experience and $4 million
unfavourable credit impact) (60)
————————————————————————-
Common shareholders’ net income 453
————————————————————————-

and

Market risk sensitivities

September 30, 2010
————————————————————————-
Changes in Net income(3)
interest rates(1) ($ millions) MCCSR(4)
————————————————————————-
1% increase 225 – 325 Up to 8 percentage points increase
1% decrease (375) – (475) Up to 15 percentage points decrease
————————————————————————-

Changes in equity markets(2)
————————————————————————-
10% increase 75 – 125 Up to 5 percentage points increase
10% decrease (175) – (225) Up to 5 percentage points decrease
————————————————————————-
————————————————————————-
25% increase 125 – 225 Up to 5 percentage points increase
25% decrease (575) – (675) Up to 15 percentage points decrease
————————————————————————-

Given that the Globe & Mail reports .. :

[UBS analyst Peter] Rozenberg calculated that the weighted average equity markets in the United States, Canada, Japan and Hong Kong increased 9.7 per cent quarter over quarter.

… it is a bit disappointing not to see a better match-up between the published sensitivity to a 10% equity market decline and the adjusting entry in the derivation of operating earnings.

It is also disappointing to see that their commentary on potential regulatory changes is so similar to their commentary in the 2Q10 report.

November 3, 2010

November 3rd, 2010

Naked access has been banned:

SEC commissioners voted 5-0 today to approve a rule that requires brokers to implement pre-trade risk controls when clients use the firms’ identification codes to trade directly on exchanges. Agency officials proposed the regulation in January, saying they were concerned that a computer malfunction or human error might trigger an order that would erode a broker’s capital.

The SEC rule targets so-called naked-sponsored access, in which a customer uses a broker’s identification code while bypassing pre-trade risk controls. The tactic is used by traders whose strategy of buying and selling thousands of shares in milliseconds would be slowed if they executed through a broker.

I would have thought that the potential for erosion of the brokers’ capital was the brokers’ problem. But nowadays, I guess, everything is a public utility.

The FOMC statement was pretty much as expected:

Employers remain reluctant to add to payrolls. Housing starts continue to be depressed. Longer-term inflation expectations have remained stable, but measures of underlying inflation have trended lower in recent quarters.

To promote a stronger pace of economic recovery and to help ensure that inflation, over time, is at levels consistent with its mandate, the Committee decided today to expand its holdings of securities. The Committee will maintain its existing policy of reinvesting principal payments from its securities holdings. In addition, the Committee intends to purchase a further $600 billion of longer-term Treasury securities by the end of the second quarter of 2011, a pace of about $75 billion per month. The Committee will regularly review the pace of its securities purchases and the overall size of the asset-purchase program in light of incoming information and will adjust the program as needed to best foster maximum employment and price stability.

Voting against the policy was Thomas M. Hoenig. Mr. Hoenig believed the risks of additional securities purchases outweighed the benefits. Mr. Hoenig also was concerned that this continued high level of monetary accommodation increased the risks of future financial imbalances and, over time, would cause an increase in long-term inflation expectations that could destabilize the economy.

The FRBNY gave details of the implementation; it should be noted that they are also reinvesting principal repayments received from their mortgage portfolio. However, the market was unimpressed by the term-structure of the proposed purchases:

Treasury 30-year bond fell the most in two months after the Federal Reserve said it will buy fewer of the securities than anticipated by investors in its $600 billion program of purchases to boost the economy.

The difference between rates on 30-year bonds and Treasury Inflation Protected Securities touched the highest since May 2008 on concern the Fed will be successful in reigniting inflation.

“The yield curve should start to steepen because the Fed will focus on 5- to 6- years,” said William Larkin, a fixed income portfolio manager in Salem, Massachusetts at Cabot Money Management, which manages $500 million. “The risk once they finish is that inflation will be elevated. There’s a good chance we’ll be rip-roaring in terms of growth and inflation.”

Thirty-year bond yields rose 13 basis points to yield 4.06 percent at 4:02 p.m. in New York, the biggest rise since Sept. 9. The 3.875 percent bonds due in August 2040 rose [sic – I think they meant “declined” – JH] 2 8/32, or $22.50 per $1,000, to 96 26/32.

The difference between rates on 30-year bonds and Treasury Inflation Protected Securities, touched 2.74 percent, the highest since May 2008 when the financial crisis was intensifying.

The Potash takeover has been blocked; apparently if Canadians are allowed sell their (minority) position in the company at a good price, we’re too damn stupid to reinvest the money and will just waste it on beer and prostitutes. I eagerly await the next sermon on productivity.

Today’s most surprising news is that Premier Dad has done something intelligent:

Premier Dalton McGuinty announced Wednesday that 75 PhD students will receive full four-year scholarships, each worth $40,000 annually, starting in the 2011-12 school years. The program is billed as the first of its kind in Canada.

It remains to be seen just what fields of study will be emphasized.

The Canadian preferred share market had another good day, with both PerpetualDiscounts and FixedResets up 20bp, on continued high volume (Desjardins had a good day!). This is getting really dull. Remember the good old days of the Panic of 2007, when you read this blog just to find out how much money you’d lost? And it took half an hour just to scan the Performance Highlights table? That was fund. FixedResets set a new all-time yield low … I’ll post about it in a while.

PerpetualDiscounts now yield 5.37%, equivalent to 7.52% interest at the standard equivalency factor of 1.4x. Long Corporates now yield 5.2% (OK, a little over. Sue me) so the pre-tax interest-equivalent spread (also called the Seniority Spread) is now about 230bp, a slight (and perhaps meaningless) tightening from the 235bp reported on October 29.

HIMIPref™ Preferred Indices
These values reflect the December 2008 revision of the HIMIPref™ Indices

Values are provisional and are finalized monthly
Index Mean
Current
Yield
(at bid)
Median
YTW
Median
Average
Trading
Value
Median
Mod Dur
(YTW)
Issues Day’s Perf. Index Value
Ratchet 0.00 % 0.00 % 0 0.00 0 0.3739 % 2,207.1
FixedFloater 4.94 % 3.52 % 26,120 19.18 1 1.1494 % 3,402.8
Floater 2.70 % 2.37 % 56,997 21.33 4 0.3739 % 2,383.1
OpRet 4.80 % 3.31 % 79,275 1.88 9 -0.0467 % 2,387.7
SplitShare 5.86 % -14.48 % 65,974 0.09 2 0.4056 % 2,403.5
Interest-Bearing 0.00 % 0.00 % 0 0.00 0 -0.0467 % 2,183.3
Perpetual-Premium 5.63 % 5.12 % 160,469 3.09 24 0.0530 % 2,021.3
Perpetual-Discount 5.35 % 5.37 % 257,574 14.80 53 0.2031 % 2,039.0
FixedReset 5.20 % 2.88 % 344,769 3.23 50 0.2047 % 2,289.4
Performance Highlights
Issue Index Change Notes
IAG.PR.C FixedReset -1.53 % YTW SCENARIO
Maturity Type : Call
Maturity Date : 2014-01-30
Maturity Price : 25.00
Evaluated at bid price : 27.08
Bid-YTW : 3.67 %
BMO.PR.K Perpetual-Discount -1.37 % YTW SCENARIO
Maturity Type : Limit Maturity
Maturity Date : 2040-11-03
Maturity Price : 24.21
Evaluated at bid price : 24.44
Bid-YTW : 5.37 %
BNA.PR.C SplitShare 1.07 % YTW SCENARIO
Maturity Type : Hard Maturity
Maturity Date : 2019-01-10
Maturity Price : 25.00
Evaluated at bid price : 22.75
Bid-YTW : 5.89 %
MFC.PR.B Perpetual-Discount 1.15 % YTW SCENARIO
Maturity Type : Limit Maturity
Maturity Date : 2040-11-03
Maturity Price : 21.20
Evaluated at bid price : 21.20
Bid-YTW : 5.57 %
BAM.PR.G FixedFloater 1.15 % YTW SCENARIO
Maturity Type : Limit Maturity
Maturity Date : 2040-11-03
Maturity Price : 25.00
Evaluated at bid price : 22.00
Bid-YTW : 3.52 %
MFC.PR.E FixedReset 1.20 % YTW SCENARIO
Maturity Type : Call
Maturity Date : 2014-10-19
Maturity Price : 25.00
Evaluated at bid price : 26.91
Bid-YTW : 3.69 %
MFC.PR.C Perpetual-Discount 1.28 % YTW SCENARIO
Maturity Type : Limit Maturity
Maturity Date : 2040-11-03
Maturity Price : 20.51
Evaluated at bid price : 20.51
Bid-YTW : 5.57 %
ELF.PR.G Perpetual-Discount 1.54 % YTW SCENARIO
Maturity Type : Limit Maturity
Maturity Date : 2040-11-03
Maturity Price : 20.50
Evaluated at bid price : 20.50
Bid-YTW : 5.85 %
Volume Highlights
Issue Index Shares
Traded
Notes
BNS.PR.K Perpetual-Discount 176,198 Desjardins crossed blocks of 76,200 and 86,700, both at 24.00.
YTW SCENARIO
Maturity Type : Limit Maturity
Maturity Date : 2040-11-03
Maturity Price : 23.73
Evaluated at bid price : 24.00
Bid-YTW : 5.02 %
TD.PR.R Perpetual-Premium 120,060 Desjardins crossed blocks of 69,000 shares, 32,900 and 11,800, all at 25.70.
YTW SCENARIO
Maturity Type : Call
Maturity Date : 2017-05-30
Maturity Price : 25.00
Evaluated at bid price : 25.70
Bid-YTW : 5.14 %
CM.PR.P Perpetual-Premium 94,780 Desjardins crossed blocks of 25,000 and 68,400, both at 25.26.
YTW SCENARIO
Maturity Type : Call
Maturity Date : 2012-11-28
Maturity Price : 25.00
Evaluated at bid price : 25.21
Bid-YTW : 5.12 %
SLF.PR.C Perpetual-Discount 85,594 RBC crossed blocks of 50,000 and 22,800, both at 20.69.
YTW SCENARIO
Maturity Type : Limit Maturity
Maturity Date : 2040-11-03
Maturity Price : 20.83
Evaluated at bid price : 20.83
Bid-YTW : 5.41 %
BAM.PR.T FixedReset 81,735 Recent new issue.
YTW SCENARIO
Maturity Type : Limit Maturity
Maturity Date : 2040-11-03
Maturity Price : 23.07
Evaluated at bid price : 24.92
Bid-YTW : 4.19 %
BMO.PR.L Perpetual-Premium 64,960 Desjardins crossed 56,700 at 26.10.
YTW SCENARIO
Maturity Type : Call
Maturity Date : 2017-06-24
Maturity Price : 25.00
Evaluated at bid price : 26.02
Bid-YTW : 5.05 %
There were 54 other index-included issues trading in excess of 10,000 shares.

MAPF Performance: October 2010

November 3rd, 2010

The fund had another good month in October.

The fund’s Net Asset Value per Unit as of the close September 30 was $11.6856.

Returns to October 29, 2010
Period MAPF Index CPD
according to
Claymore
One Month +2.59% +2.02% +1.40%
Three Months +8.80% +5.85% +4.70%
One Year +21.24% +14.27% +10.82%
Two Years (annualized) +42.59% +16.00% +13.07% *
Three Years (annualized) +24.25% +5.72% +3.56%
Four Years (annualized) +16.77% +2.95%  
Five Years (annualized) +14.60% +3.37%  
Six Years (annualized) +13.20% +3.48%  
Seven Years (annualized) +13.51% +3.78%  
Eight Years (annualized) +15.05% +4.22%  
Nine Years (annualized) +13.13% +4.14%  
The Index is the BMO-CM “50”
MAPF returns assume reinvestment of dividends, and are shown after expenses but before fees.
CPD Returns are for the NAV and are after all fees and expenses.
* CPD does not directly report its two-year returns. The figure shown is the square root of product of the current one-year return and the similar figure reported for October 2009.
Figures for Omega Preferred Equity (which are after all fees and expenses) for 1-, 3- and 12-months are +1.45%, +4.97% and +12.58%, respectively, according to Morningstar after all fees & expenses
Figures for Jov Leon Frazer Preferred Equity Fund Class I Units (which are after all fees and expenses) for 1-, 3- and 12-months are +1.15%, +3.56% & +9.06% respectively, according to Morningstar
Figures for Manulife Preferred Income Fund (formerly AIC Preferred Income Fund) (which are after all fees and expenses) for 1-, 3- and 12-months are +0.99%, +2.79% & +7.55%, respectively
Figures for Horizons AlphaPro Preferred Share ETF are not yet available (inception date 2010-11-23)

MAPF returns assume reinvestment of dividends, and are shown after expenses but before fees. Past performance is not a guarantee of future performance. You can lose money investing in Malachite Aggressive Preferred Fund or any other fund. For more information, see the fund’s main page. The fund is available either directly from Hymas Investment Management or through a brokerage account at Odlum Brown Limited.

Sometimes everything works … sometimes the trading works, but sectoral shifts overwhelm the increment … sometimes nothing works. The fund seeks to earn incremental return by selling liquidity (that is, taking the other side of trades that other market participants are strongly motivated to execute), which can also be referred to as ‘trading noise’. There have been a lot of strongly motivated market participants in the recent past, generating a lot of noise! Unfortunately, the conditions of the Panic of 2007 may never be repeated in my lifetime … but the fund will simply attempt to make trades when swaps seem profitable, whether that implies monthly turnover of 10% or 100%.

The fund’s returns were helped along by the overweighting in deeply discounted PerpetualDiscounts; as discussed in MAPF Portfolio Composition: October 2010, volatility has been rising while yields have been falling, which resulted in this type of issue strongly outperforming.


Click for Big

There’s plenty of room for new money left in the fund. I have shown in recent issues of PrefLetter that market pricing for FixedResets is demonstrably stupid and I have lots of confidence – backed up by my bond portfolio management experience in the markets for Canadas and Treasuries, and equity trading on the NYSE & TSX – that there is enough demand for liquidity in any market to make the effort of providing it worthwhile (although the definition of “worthwhile” in terms of basis points of outperformance changes considerably from market to market!) I will continue to exert utmost efforts to outperform but it should be borne in mind that there will almost inevitably be periods of underperformance in the future.

The yields available on high quality preferred shares remain elevated, which is reflected in the current estimate of sustainable income.

Calculation of MAPF Sustainable Income Per Unit
Month NAVPU Portfolio
Average
YTW
Leverage
Divisor
Securities
Average
YTW
Capital
Gains
Multiplier
Sustainable
Income
per
current
Unit
June, 2007 9.3114 5.16% 1.03 5.01% 1.1883 0.3926
September 9.1489 5.35% 0.98 5.46% 1.1883 0.4203
December, 2007 9.0070 5.53% 0.942 5.87% 1.1883 0.4448
March, 2008 8.8512 6.17% 1.047 5.89% 1.1883 0.4389
June 8.3419 6.034% 0.952 6.338% 1.1883 $0.4449
September 8.1886 7.108% 0.969 7.335% 1.1883 $0.5054
December, 2008 8.0464 9.24% 1.008 9.166% 1.1883 $0.6206
March 2009 $8.8317 8.60% 0.995 8.802% 1.1883 $0.6423
June 10.9846 7.05% 0.999 7.057% 1.1883 $0.6524
September 12.3462 6.03% 0.998 6.042% 1.1883 $0.6278
December 2009 10.5662 5.74% 0.981 5.851% 1.0000 $0.6182
March 2010 10.2497 6.03% 0.992 6.079% 1.0000 $0.6231
June 10.5770 5.96% 0.996 5.984% 1.0000 $0.6329
September 11.3901 5.43% 0.980 5.540% 1.0000 $0.6310
October 2010 11.6856 5.25% 0.994 5.282% 1.0000 $0.6172
NAVPU is shown after quarterly distributions of dividend income and annual distribution of capital gains.
Portfolio YTW includes cash (or margin borrowing), with an assumed interest rate of 0.00%
The Leverage Divisor indicates the level of cash in the account: if the portfolio is 1% in cash, the Leverage Divisor will be 0.99
Securities YTW divides “Portfolio YTW” by the “Leverage Divisor” to show the average YTW on the securities held; this assumes that the cash is invested in (or raised from) all securities held, in proportion to their holdings.
The Capital Gains Multiplier adjusts for the effects of Capital Gains Dividends. On 2009-12-31, there was a capital gains distribution of $1.989262 which is assumed for this purpose to have been reinvested at the final price of $10.5662. Thus, a holder of one unit pre-distribution would have held 1.1883 units post-distribution; the CG Multiplier reflects this to make the time-series comparable. Note that Dividend Distributions are not assumed to be reinvested.
Sustainable Income is the resultant estimate of the fund’s dividend income per current unit, before fees and expenses. Note that a “current unit” includes reinvestment of prior capital gains; a unitholder would have had the calculated sustainable income with only, say, 0.9 units in the past which, with reinvestment of capital gains, would become 1.0 current units.

Significant positions were held in Fixed-Reset issues on October 29; all of which (with the exception of YPG.PR.D) currently have their yields calculated with the presumption that they will be called by the issuers at par at the first possible opportunity. This presents another complication in the calculation of sustainable yield.

However, if the entire portfolio except for the PerpetualDiscounts were to be sold and reinvested in these issues, the yield of the portfolio would be the 5.54% shown in the MAPF Portfolio Composition: October 2010 analysis (which is in excess of the 5.41% index yield on October 29). Given such reinvestment, the sustainable yield would be $11.6856 * 0.0554 = $0.6474, a slight increase from the 0.6435 reported last month.

It is no surprise that this estimate is down, since there will be a drag on the calculation in up-markets due to presence of shorter-term issues (or, at least, presumed shorter term issues!); the question is whether the positive effect of these issues in down markets will outweight their negative effect in up-markets – all I can say is … it has in the past!

Different assumptions lead to different results from the calculation, but the overall positive trend is apparent. I’m very pleased with the results! It will be noted that if there was no trading in the portfolio, one would expect the sustainable yield to be constant (before fees and expenses). The success of the fund’s trading is showing up in

  • the very good performance against the index
  • the long term increases in sustainable income per unit

As has been noted, the fund has maintained a credit quality equal to or better than the index; outperformance is due to constant exploitation of trading anomalies.

Again, there are no predictions for the future! The fund will continue to trade between issues in an attempt to exploit market gaps in liquidity, in an effort to outperform the index and keep the sustainable income per unit – however calculated! – growing.

MAPF Portfolio Composition: October 2010

November 3rd, 2010

Turnover picked up slightly in October to 28%

Trades were, as ever, triggered by a desire to exploit transient mispricing in the preferred share market (which may be thought of as “selling liquidity”), rather than any particular view being taken on market direction, sectoral performance or credit anticipation.

MAPF Sectoral Analysis 2010-10-29
HIMI Indices Sector Weighting YTW ModDur
Ratchet 0% N/A N/A
FixFloat 0% N/A N/A
Floater 0% N/A N/A
OpRet 0% N/A N/A
SplitShare 1.4% (+0.8) 6.00% 6.70
Interest Rearing 0% N/A N/A
PerpetualPremium 8.6% (+3.2) 5.83% 10.40
PerpetualDiscount 74.6% (-5.2) 5.54% 14.60
Fixed-Reset 10.2% (+2.0) 2.91% 3.14
Scraps (FixedReset) 3.6% (-0.4) 6.53% 12.87
Cash 1.6% (-0.4) 0.00% 0.00
Total 100% 5.25% 12.66
Totals and changes will not add precisely due to rounding. Bracketted figures represent change from September month-end. Cash is included in totals with duration and yield both equal to zero.

The “total” reflects the un-leveraged total portfolio (i.e., cash is included in the portfolio calculations and is deemed to have a duration and yield of 0.00.). MAPF will often have relatively large cash balances, both credit and debit, to facilitate trading. Figures presented in the table have been rounded to the indicated precision.

Prices of PerpetualDiscounts increased during the month, as did implied volatility. The fund increased its position in near-par PerpetualDiscounts over the month.

Following last month’s performance report, analysis of the data using the Straight Perpetual Implied Volatility Calculator produces the following table:

Fits to Implied Volatility
Issuer 2010-10-29 2010-09-30
Yield Volatility Yield Volatility
PWF 4.40% 25% 5.35% 14%
CM 4.80% 17% 5.10% 16%
GWO 0.99% 35% 5.50% 12%

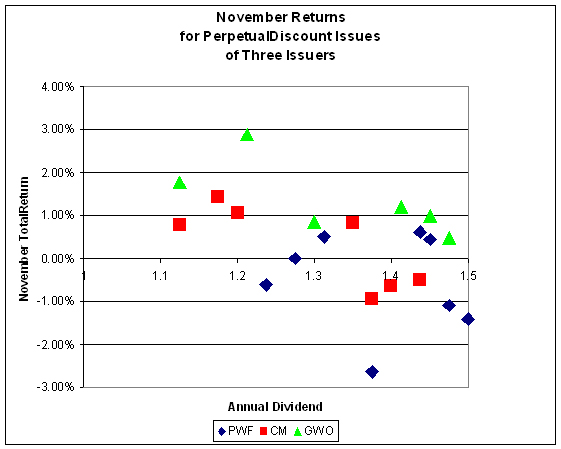
As discussed in the October edition of PrefLetter, the implied volatility calculated for GWO is ludicrously high and implies a ridiculous assessment of the probability distribution of future yields; now it appears that PWF issues are headed that way as well.

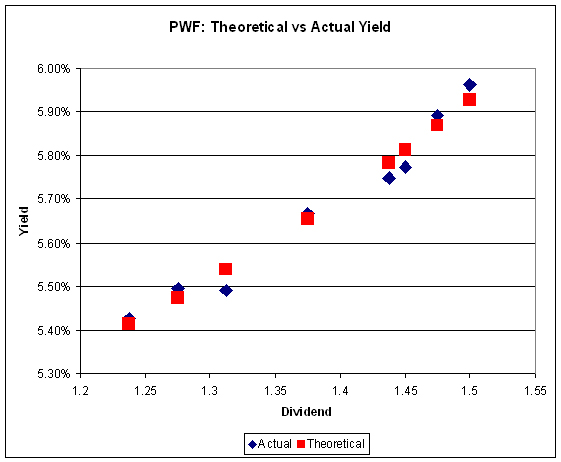
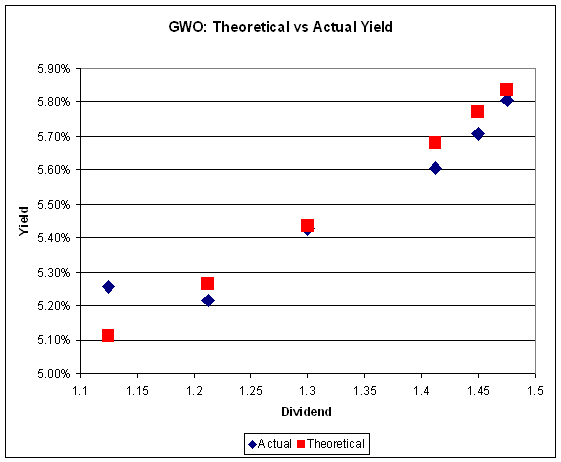
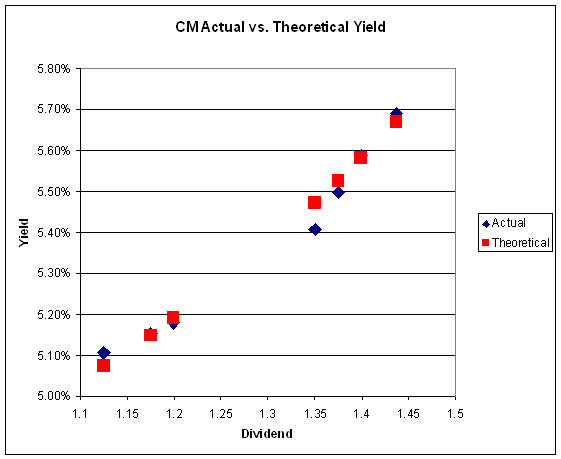
Graphs from the Straight Perpetual Volatility Calculator for October 29 are:


Click for Big


Click for Big


Click for Big

The yield pick-up for holding high-coupon Straights is such one should no longer automatically buy the deepest-discount issue in a series!

Credit distribution is:

MAPF Credit Analysis 2010-10-29
DBRS Rating Weighting
Pfd-1 0 (0)
Pfd-1(low) 64.6% (+5.3)
Pfd-2(high) 13.2% (-9.0)
Pfd-2 0 (0)
Pfd-2(low) 17.0% (+4.4)
Pfd-3(high) 3.6% (-0.4)
Cash 1.6% (-0.4)
Totals will not add precisely due to rounding. Bracketted figures represent change from September month-end.

The decline in holdings of issues rated Pfd-2(high) was due mainly to swaps out of MFC.PR.D:

MAPF October Swaps out of MFD.PR.D
Date MFC.PR.D RY.PR.P BNS.PR.X RY.PR.R
9/30
Bid
27.49 27.76 28.16 27.81
10/6 Sold
27.74
Bot
27.72
  Bot
27.82
10/7 Sold
27.74
Bot
27.73
Bot
27.56
 
10/29
Bid
27.84 27.60 27.95 27.62
Dividends   10/22
0.391
10/1
0.391
10/22
0.391
This table attempts to present fairly a simplified summary of a sequence of trades. Full disclosure of actual trades, prices and commissions will be made at the time of publication of the 2010 Financial Statements.

Liquidity Distribution is:

MAPF Liquidity Analysis 2010-10-29
Average Daily Trading Weighting
<$50,000 0.0% (0)
$50,000 – $100,000 12.9 (+3.9)
$100,000 – $200,000 24.2% (+4.0)
$200,000 – $300,000 20.0% (-3.6)
>$300,000 41.2% (-3.9)
Cash 1.6% (-0.4)
Totals will not add precisely due to rounding. Bracketted figures represent change from September month-end.

MAPF is, of course, Malachite Aggressive Preferred Fund, a “unit trust” managed by Hymas Investment Management Inc. Further information and links to performance, audited financials and subscription information are available the fund’s web page. The fund may be purchased either directly from Hymas Investment Management or through a brokerage account at Odlum Brown Limited. A “unit trust” is like a regular mutual fund, but is sold by offering memorandum rather than prospectus. This is cheaper, but means subscription is restricted to “accredited investors” (as defined by the Ontario Securities Commission) and those who subscribe for $150,000+. Fund past performances are not a guarantee of future performance. You can lose money investing in MAPF or any other fund.

A similar portfolio composition analysis has been performed on the Claymore Preferred Share ETF (symbol CPD) as of August 31, 2010, and published in the September, 2010, PrefLetter. When comparing CPD and MAPF:

  • MAPF credit quality is better
  • MAPF liquidity is a higher
  • MAPF Yield is higher
  • Weightings in
    • MAPF is much more exposed to PerpetualDiscounts
    • MAPF is much less exposed to Operating Retractibles
    • MAPF is slightly more exposed to SplitShares
    • MAPF is less exposed to FixFloat / Floater / Ratchet
    • MAPF weighting in FixedResets is much lower

November 2, 2010

November 2nd, 2010

Our Government Motors investment has a long way to go:

But for the U.S. to break even through sales of the rest of its stake, the share price may need to rise more than 60% from its initial level, to about $50.

The initial public offering plan envisions the shares would be priced at $26 to $29 each, these people said. The actual price of the stock to be sold in the IPO would be set about Nov. 17, and the sale would take place the following day.

More subsidies urgently required!

Merkel is stepping up calls for an EU default mechanism:

Measures being drafted by the European Union will result in rules with “more bite” to protect the euro, Merkel said in a speech today in Bruges, Belgium. Along with steps to prevent EU members running up excessive debt, a crisis mechanism enshrined in EU treaties is necessary for the longer term, she said.

“We will set it up in such a way that European taxpayers will no longer be on the hook for possible new mistakes and turmoil on the financial markets,” Merkel said. “Private investors must also make a contribution.”

European officials including Spanish Prime Minister Jose Luis Rodriguez Zapatero are concerned that announcing bond investors will have to shoulder a greater part of any future bailout will spook traders at a time when Ireland and Portugal are struggling to cut their budget deficits.

European Central Bank President Jean-Claude Trichet told EU leaders last week he’s concerned that talk of a debt restructuring mechanism from 2013 would hurt the bonds of the euro-region’s so-called periphery nations, according to an EU official familiar with the talks.

Irish bonds fell for a sixth day, sending the 10-year yield to a record, and Greek bonds dropped for a seventh day, the longest losing streak since April.

Rules, schmules. They’re only as effective as the political will to enforce them – Germany and France both demanded exemptions from the 3% deficit cap; turned a willful blind eye to the Greek crisis as it was developing; and participated in the Greek bail-out contrary to the EU’s no-bailout rules.

The Depositary Trust Company is now publishing average daily General Collateral repo rates. The Treasury Market Practices Group applauds the move:

The Treasury Market Practices Group (“TMPG”) today applauded the announcement by the Depository Trust and Clearing Corporation (“DTCC”) to introduce the publication of three overnight general collateral repo rate indices and corresponding transaction volumes.

These new data, which will be published daily, reflect activity on DTCC’s GCF Repo dealer-to-dealer trading platform for the three most active collateral categories traded: Treasury securities, agency debt securities, and agency mortgage-backed securities. Publication of these data, made at the request of the TMPG, provides useful information in a form that has not been available to market participants until now.

“The publication of these indices by DTCC is a major step on the critical path of enhanced transparency in the secured funding markets,” said Tom Wipf, the chairman of the TMPG. “This collaboration demonstrates the shared commitment of TMPG and DTCC in support of the integrity and efficiency of the Treasury, agency debt, and mortgage-backed securities markets.”

God knows why. Greater transparency leads to fairer markets for the little guys, which leads to less profit for the well capitalized big guys, which leads to … surprise! a withdrawal of capital from the market. We’ve seen this countless times and every single time the market in question becomes a little thinner and a little more brittle. If that’s what we want, fine … but not once have I seen a regulatory decision take explicit account of the trade-off.

It will soon be easier to confine people who look at you funny, given all the complaints that private citizens can get in trouble for shooting people who are running away. While worried, I am also entertained by the slow oscillations of the pendulum … how long will it be before some looney-tune exercises his new citizen’s arrest rights in a manner that is unpopular?

It was yet another good day for the Canadian preferred share market, with PerpetualDiscounts up 28bp and FixedResets gaining 19bp, taking the median weighted average yield on the latter index back down to 2.93%. The all-time low yield for this index was 2.89%, set on September 23; today’s level ranks #3 all-time. Volume returned to very strong levels.

And how about that BMO.PR.N, eh? Now with a pre-tax bid-YTW of 2.23%, based on a bid of 28.34 and a call 2014-3-27 at 25.00. I note that the BMO Capital Trust BOATS Series D, 5.474%, (prospectus on SEDAR dated September 23, 2004) are indicated at 108.97 to yield 3.15% to a presumed call December 31, 2014. Note that given current market conditions the call would not be in the economic best interests of BMO; but there is also the thought that OSFI will demand redemption due to concerns over the loss-absorption potential of the issue (this issue can convert into 5% preferred shares, but only if Very Bad Things happen). One way or another, BMO.PR.N is yielding at an interest-equivalent rate of 3.12% at the standard conversion factor of 1.4x.

HIMIPref™ Preferred Indices
These values reflect the December 2008 revision of the HIMIPref™ Indices

Values are provisional and are finalized monthly
Index Mean
Current
Yield
(at bid)
Median
YTW
Median
Average
Trading
Value
Median
Mod Dur
(YTW)
Issues Day’s Perf. Index Value
Ratchet 0.00 % 0.00 % 0 0.00 0 0.1162 % 2,198.9
FixedFloater 5.00 % 3.58 % 27,170 19.12 1 1.1628 % 3,364.2
Floater 2.71 % 2.38 % 55,298 21.28 4 0.1162 % 2,374.2
OpRet 4.79 % 3.15 % 77,780 1.89 9 0.4351 % 2,388.8
SplitShare 5.88 % -16.37 % 66,542 0.09 2 -0.1013 % 2,393.8
Interest-Bearing 0.00 % 0.00 % 0 0.00 0 0.4351 % 2,184.4
Perpetual-Premium 5.64 % 5.03 % 160,524 3.09 24 0.3199 % 2,020.2
Perpetual-Discount 5.36 % 5.40 % 253,396 14.79 53 0.2784 % 2,034.9
FixedReset 5.21 % 2.93 % 338,152 3.23 50 0.1926 % 2,284.8
Performance Highlights
Issue Index Change Notes
BAM.PR.J OpRet 1.01 % YTW SCENARIO
Maturity Type : Soft Maturity
Maturity Date : 2018-03-30
Maturity Price : 25.00
Evaluated at bid price : 26.88
Bid-YTW : 4.31 %
SLF.PR.B Perpetual-Discount 1.10 % YTW SCENARIO
Maturity Type : Limit Maturity
Maturity Date : 2040-11-02
Maturity Price : 21.79
Evaluated at bid price : 22.14
Bid-YTW : 5.47 %
BAM.PR.G FixedFloater 1.16 % YTW SCENARIO
Maturity Type : Limit Maturity
Maturity Date : 2040-11-02
Maturity Price : 25.00
Evaluated at bid price : 21.75
Bid-YTW : 3.58 %
BAM.PR.R FixedReset 1.18 % YTW SCENARIO
Maturity Type : Call
Maturity Date : 2021-07-30
Maturity Price : 25.00
Evaluated at bid price : 26.61
Bid-YTW : 4.19 %
RY.PR.H Perpetual-Premium 1.24 % YTW SCENARIO
Maturity Type : Call
Maturity Date : 2017-06-23
Maturity Price : 25.00
Evaluated at bid price : 26.12
Bid-YTW : 4.83 %
GWO.PR.G Perpetual-Discount 1.26 % YTW SCENARIO
Maturity Type : Limit Maturity
Maturity Date : 2040-11-02
Maturity Price : 23.86
Evaluated at bid price : 24.15
Bid-YTW : 5.44 %
PWF.PR.K Perpetual-Discount 1.44 % YTW SCENARIO
Maturity Type : Limit Maturity
Maturity Date : 2040-11-02
Maturity Price : 23.08
Evaluated at bid price : 23.30
Bid-YTW : 5.33 %
MFC.PR.B Perpetual-Discount 1.50 % YTW SCENARIO
Maturity Type : Limit Maturity
Maturity Date : 2040-11-02
Maturity Price : 20.96
Evaluated at bid price : 20.96
Bid-YTW : 5.63 %
SLF.PR.G FixedReset 1.53 % YTW SCENARIO
Maturity Type : Limit Maturity
Maturity Date : 2040-11-02
Maturity Price : 23.45
Evaluated at bid price : 25.91
Bid-YTW : 3.22 %
BAM.PR.I OpRet 1.63 % YTW SCENARIO
Maturity Type : Call
Maturity Date : 2010-12-02
Maturity Price : 25.50
Evaluated at bid price : 26.86
Bid-YTW : -45.78 %
IAG.PR.E Perpetual-Premium 2.70 % YTW SCENARIO
Maturity Type : Call
Maturity Date : 2019-01-30
Maturity Price : 25.00
Evaluated at bid price : 26.20
Bid-YTW : 5.39 %
Volume Highlights
Issue Index Shares
Traded
Notes
TD.PR.S FixedReset 163,605 TD crossed block of 100,000 and 52,500, both at 26.57.
YTW SCENARIO
Maturity Type : Call
Maturity Date : 2013-08-30
Maturity Price : 25.00
Evaluated at bid price : 26.61
Bid-YTW : 2.52 %
BMO.PR.J Perpetual-Discount 123,855 RBC crossed blocks of 74,500 and 30,000, both at 22.90.
YTW SCENARIO
Maturity Type : Limit Maturity
Maturity Date : 2040-11-02
Maturity Price : 22.72
Evaluated at bid price : 22.89
Bid-YTW : 4.91 %
BNS.PR.P FixedReset 115,424 RBC crossed 100,000 at 26.55.
YTW SCENARIO
Maturity Type : Call
Maturity Date : 2013-05-25
Maturity Price : 25.00
Evaluated at bid price : 26.59
Bid-YTW : 2.36 %
BAM.PR.T FixedReset 109,183 Recent new issue.
YTW SCENARIO
Maturity Type : Limit Maturity
Maturity Date : 2040-11-02
Maturity Price : 23.01
Evaluated at bid price : 24.76
Bid-YTW : 4.22 %
RY.PR.X FixedReset 108,850 Desjardins crossed blocks of 12,900 and 83,000, both at 27.90.
YTW SCENARIO
Maturity Type : Call
Maturity Date : 2014-09-23
Maturity Price : 25.00
Evaluated at bid price : 27.87
Bid-YTW : 3.03 %
CM.PR.I Perpetual-Discount 63,477 RBC crossed blocks of 39,000 and 11,000, both at 22.56.
YTW SCENARIO
Maturity Type : Limit Maturity
Maturity Date : 2040-11-02
Maturity Price : 22.43
Evaluated at bid price : 22.58
Bid-YTW : 5.23 %
There were 52 other index-included issues trading in excess of 10,000 shares.

Index Performance: October 2010

November 2nd, 2010

Performance of the HIMIPref™ Indices for October, 2010, was:

Total Return
Index Performance
October 2010
Three Months
to
October 29, 2010
Ratchet +1.81% *** +5.11% ***
FixFloat +1.81% ** +5.11% **
Floater +1.81% +5.11%
OpRet +0.13% +1.38%
SplitShare +1.50% +7.48%
Interest +0.13%**** +1.38%****
PerpetualPremium +1.07% +4.06
PerpetualDiscount +2.31% +8.70%
FixedReset +0.71% +2.17%
** The last member of the FixedFloater index was transferred to Scraps at the June, 2010, rebalancing; subsequent performance figures are set equal to the Floater index
*** The last member of the RatchetRate index was transferred to Scraps at the July, 2010, rebalancing; subsequent performance figures are set equal to the Floater index
**** The last member of the InterestBearing index was transferred to Scraps at the June, 2009, rebalancing; subsequent performance figures are set equal to the OperatingRetractible index
Passive Funds (see below for calculations)
CPD +1.40% +4.73%
DPS.UN +0.17% +5.92%
Index
BMO-CM 50 +2.02% +5.84%
TXPR Total Return +1.55% +5.16%

CPD again took a good hit on its tracking error against TXPR, down 15bp on the month and 43bp on the quarter. The advertised MER of 0.48% implies these figures should be 4bp and 12bp in the absence of trading frictions. I’m happy! One man’s market impact cost is another man’s market-making gain, and if Claymore is incurring market impact costs in the neighborhood of 100bp p.a., that’s over $5-million on the table to be divvied up by guys like me.

The pre-tax interest equivalent spread of PerpetualDiscounts over Long Corporates (which I also refer to as the Seniority Spread) ended the month at 235bp, a significant decline from the 265bp reported at September month-end. Long corporate yields declined to 5.2% from 5.3% during the period while PerpetualDiscounts had a larger decline in dividend terms, from 5.69% to 5.41%, which became from 7.97% to 7.57% in interest-equivalent terms at the standard conversion factor of 1.4x. I would be happier with long corporates in the 6.00-6.25% range with a seniority spread in the range of 100-150bp, but what do I know? The market has never shown any particular interest in my happiness.

Long Corporates reached a plateau in October:


Click for Big

Charts related to the Seniority Spread and the Bozo Spread (PerpetualDiscount Current Yield less FixedReset Current Yield) are published in PrefLetter.

The trailing year returns are starting to look a bit more normal.


Click for big

Floaters have had a wild ride; the latest decline is presumably due to the idea that the BoC will be slower rather than faster in hiking the overnight rate. I’m going to keep publishing updates of this graph until the one-year trailing return for the sector no longer looks so gigantic:


Click for big

Volumes are on their way back up Volume may be under-reported due to the influence of Alternative Trading Systems (as discussed in the November PrefLetter), but I am biding my time before incorporating ATS volumes into the calculations, to see if the effect is transient or not.


Click for big

Compositions of the passive funds were discussed in the September, 2010, edition of PrefLetter.

Claymore has published NAV and distribution data (problems with the page in IE8 can be kludged by using compatibility view) for its exchange traded fund (CPD) and I have derived the following table:

CPD Return, 1- & 3-month, to October 29, 2010
Date NAV Distribution Return for Sub-Period Monthly Return
July 30, 2010 16.66    
August 26 16.76 0.069 +1.01% +1.12%
August 31 16.78   +0.11%
September 27 17.12 0.069 +2.44% +2.14%
September 30 17.07   -0.29%
October 26 17.21 0.069 +1.22% +1.40%
October 29, 2010 17.24   +0.17%
Quarterly Return +4.73%

Claymore currently holds $559,641,405 (advisor & common combined) in CPD assets, up about $24-million from the $486,846,162 reported at August month-end and up about $186-million from the $373,729,364 reported at year-end. Their tracking error does not seem to be affecting their ability to gather assets!

The DPS.UN NAV for September 1 has been published so we may calculate the approximate August returns.

DPS.UN NAV Return, September-ish and October-ish 2010
Date NAV Distribution Return for sub-period Return for period
September 1, 2010 20.57      
September 28 21.17 ** 0.30 +4.38%  
September 29 21.12   -0.23%  
October 27 21.12   0.00%  
Estimated September Beginning Stub +0.24% *
Estimated September Ending Stub 0.0% ***
Estimated October Ending Stub +0.17% *****
Estimated September Return +4.39% ****
Estimated October Return +0.17% ******
*CPD had a NAVPU of 16.82 on September 1 and 16.78 on August 31, hence the total return for the period for CPD was +0.24%. The return for DPS.UN in this period is presumed to be equal.
**CPD had a NAVPU of 17.11 on September 28 and 17.07 on September 29, therefore the return for the day was -0.23%. The reported NAV of DPS.UN was 21.12 on September 29, so, assuming returns were approximately equal for the day, the NAV would have been 21.17
***CPD had a NAVPU of 17.07 on September 29 and 17.07 on September 30, hence the total return for the period for CPD was +0.00%. The return for DPS.UN in this period is presumed to be equal.
**** The estimated September return for DPS.UN’s NAV is therefore the product of four period returns, +0.24%, +4.38%, -0.23% and 0.00% to arrive at an estimate for the calendar month of +4.39%
*****CPD had a NAVPU of 17.21 on October 27 and 17.24 on October 29, hence the total return for the period for CPD was +0.17%. The return for DPS.UN in this period is presumed to be equal.
**** The estimated October return for DPS.UN’s NAV is therefore the product of three period returns, +0.00%, +0.00%, +0.17% to arrive at an estimate for the calendar month of +0.17%

Note that Sentry Select claims September performance of 3.7%, but I believe this is price-based, whereas my calculations are NAV-based. DPS.UN currently trades at a discount of about 4% to its NAV.

Now, to see the DPS.UN quarterly NAV approximate return, we refer to the calculations for August:

DPS.UN NAV Returns, three-month-ish to end-October-ish, 2010
August-ish +1.29%
September-ish +4.39%
October-ish +0.17%
Three-months-ish +5.92%

Sentry Select is now publishing performance data for DPS.UN, but this appears to be price-based, rather than NAV-based. I will continue to report NAV-based figures.

OSFI Releases New Seg Fund Risk Guidelines

November 2nd, 2010

The Office of the Superintendent of Financial Institutions has released Revised Guidance for Companies that Determine Segregated Fund Guarantee Capital Requirements Using an Approved Model. This is the change we were told to expect in August.

The guts of the change appears to be distribution and correlation requirements for equity indices:

New minimum quantitative calibration criteria are mandated for the scenarios used to model the returns of the following total return equity indexes (henceforth referred to as “listed indexes”):

  • TSX
  • Canadian small cap equity, mid cap equity and specialty equity
  • S&P 500
  • US small cap equity, mid cap equity and specialty equity
  • MSCI World Equity and MSCI EAFE

The actual investment return scenarios for each of the listed indexes used in the determination of total requirements must meet the criteria specified in the following table.

Furthermore, the arithmetic average of the actual investment return scenarios for each listed index over any one-year period (including the one-year period starting on the valuation date) cannot be greater than 10%. All of these criteria must be met for the scenarios of a listed index to be in accordance with the new minimum calibration criteria.

Modeled scenarios of TSX total return indexes must continue to satisfy the CIA calibration criteria at all percentiles over the five- and ten-year time horizons as published in the CIA’s March 2002 report, in addition to the criteria above. Modeled scenarios of S&P 500 total return indexes must satisfy the American Academy of Actuaries’ calibration criteria for equities [footnote] at all percentiles over the five-, ten- and twenty-year time horizons, in addition to the criteria above.

The scenarios used to model returns of an equity index that is not one of the listed indexes need not meet the same calibration criteria, but must still be consistent with the calibrated scenarios used to model the returns of the listed indexes.

Correlation: The scenarios used to model returns for different equity indexes should be positively correlated with one another. Unless it can be justified otherwise, the correlation between the returns generated for any two equity indexes (whether or not they are listed) should be at least 70%. If scenarios are generated using a model that distinguishes between positive and negative trend market phases (e.g. the regime-switching lognormal model with two regimes) then, unless it can be justified otherwise, the scenarios should be such that there is a very high probability that different equity indexes will be in the same market phase at the same time, and a very low probability that different equity indexes will be in different phases at the same time.

Footnote: For example, as published in the June 2005 document entitled “Recommended Approach for Setting Regulatory Risk-Based Capital Requirements for Variable Annuities and Similar Products”.

The table excised from the quotation above is:

  Time Period
  6 Months 1 Year
Left Tail Criteria    
2.5th percentile of return not greater than -25% -35%
5th percentile of return not greater than -18% -26%
10th percentile of return not greater than -10% -15%
Right Tail Criteria    
90th percentile of return not less than 20% 30%
95th percentile of return not less than 25% 38%
97.5th percentile of return not less than 30% 45%

These criteria equate, very approximately, to a mean expected return of 8% and a standard deviation of 20.5%. Interested readers can fiddle with the variables and log-normal distributions in the comments.

The American Academy of Actuaries’ Recommended Approach for Setting Regulatory Risk-Based Capital Requirements for Variable Annuities and Similar Products notes:

Short period distributions of historic equity returns typically show negative skewness, positive kurtosis (fat tails) with time varying volatility and increased volatility in bear markets. The measure of kurtosis declines when looking at returns over longer time horizons and successive application of a short-term model with finite higher moments will result in longer horizon returns that converge towards normality. Ideally the distribution of returns for a given model should reflect these characteristics. Of course, due to random sampling, not every scenario would show such attributes.

Unfortunately, at longer time horizons the small sample sizes of the historic data make it much more difficult to make credible inferences about the characteristics of the return distribution, especially in the tails. As such, the calibration criteria are derived from a model (fitted to historic S&P500 monthly returns) and not based solely on empirical observations. However, the calibration points are not strictly taken from one specific model for market returns; instead, they have been adjusted slightly to permit several well known and reasonable models (appropriately parameterized) to pass the criteria. Statistics for the observed data are offered as support for the recommendations.

… and they also provide a table:

Table 1: Calibration Standard for Total Return Wealth Ratios
Percentile 1 Year 5 Years 10 Years 20 Years
2.5% 0.78 0.72 0.79 n/a
5.0% 0.84 0.81 0.94 1.51
10.0% 0.90 0.94 1.16 2.10
90.0% 1.28 2.17 3.63 9.02
95.0% 1.35 2.45 4.36 11.70
2.5% 1.42 2.72 5.12 n/a

where:

The ‘wealth factors’ are defined as gross accumulated values (i.e., before the deduction of fees and charges) with complete reinvestment of income and maturities, starting with a unit investment. These can be less than 1, with “1” meaning a zero return over the holding period.

To interpret the above values, consider the 5-year point of 0.72 at the α = 2.5th percentile. This value implies that there is a 2.5 percent probability of the accumulated value of a unit investment being less than 0.72 in 5-years time, ignoring fees and expenses and without knowing the initial state of the process (i.e., this is an unconditional probability). For left-tail calibration points (i.e., those quantiles less than 50%), lower factors after model calibration are required. For right-tail calibration points (quantiles above 50%), the model must produce higher factors.

To my astonishment, I was able to find a copy of CIA Document 202012 (sounds like an analysis of the Mayan calendar) via the World Bank. I will refer to it as Final Report of the CIA Task Force on Segregated Fund Investment Guarantees. Ths calibration is:

Table 1
Accumulation Period 2.5th percentile 5th percentile 10th percentile
One Year 0.76 0.82 0.90
Five Years 0.75 0.85 1.05
Ten Years 0.85 1.05 1.35

The new standard has a significantly nastier left-tail than the prior standards:

Comparison of Left Tails
One Year Horizon
Standard 2.5th %-ile 5th %-ile 10th %-ile
OSFI New -35% -26% -15%
American -22% -16% -10%
Canadian -24% -18% -10%

However, in the absence of information regarding the insurers’ models together with detailed data, it is impossible to determine how capital requirements will be affected by the change. This could be a welcome first step towards rationalizing seg fund capital requirements; it could also be window-dressing that OSFI knows will have no effect but makes them look tough. As suggested by Desjardins, we will simply have to wait for commentary in the coming batch of quarterly reports. It will be noted that GWO, SLF and MFC have all warned about the potential for adverse change.

For myself, I am disappointed that while OSFI is addressing intricacies of model calibration, it is not mandating additional disclosures or reviewing their highly politicized cover-up from the Fall of 2008. It became quite apparent during the Panic of 2007 that the currently mandated disclosure of the effect of a 10% decline in equity prices is nowhere near good enough to allow investors to take an informed view on the adequacy of capitalization. Would it really be so difficult and so invasive to mandate a table showing the effects on capital and comprehensive income of the effects of 10%, 20% and 30% declines?

SPL.A Wound Up

November 2nd, 2010

Mulvihill Pro-AMS RSP Split Share Corp. has announced:

that its shareholders approved a special resolution amending the Articles of the Fund to terminate the Fund in advance of the redemption date originally scheduled for December 31, 2013. As a result of such approval, the Fund will redeem all Class A Shares and Class B Shares on October 29, 2010 for the redemption amounts to which holders are entitled. It is expected that the last trading day for the shares will be October 28, 2010 and the proceeds from the redemption of the Class A Shares and Class B Shares are expected to be paid in approximately 10 business days from the redemption date. No action need be taken by holders of Class A Shares or Class B Shares to receive their redemption amounts.

Given the small size of the Fund, operating costs are becoming a greater burden on the net asset value while
trading liquidity has been significantly reduced. Redeeming all Class A Shares and Class B Shares on October 29, 2010 will preserve value for shareholders. As a result of the redemption, the Class A Shares and Class B Shares of the Fund will be de-listed by the Toronto Stock Exchange.

The NAV of SPL.A was 8.49 as of October 29. As of the June 30, 2010, financial statements the fund value was $8.92-million.

SPL.A was last mentioned on PrefBlog when its credit rating was discontinued by DBRS. SPL.A was tracked by HIMIPref&trades;, but was relegated to the Scraps index at the October 2002 rebalancing on volume concerns. It was downgraded to Pfd-3 by DBRS as of April 9, 2003.