MAPF Performance: May 2010

June 4th, 2010

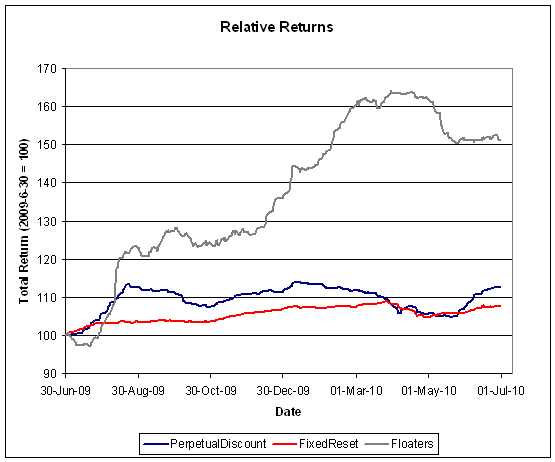
The fund had a positive month in May following three consecutive losses, and outperformed all the relevant indices and passive funds as the Floating Rate sector took a large loss. The Seniority Spread declined marginally (and perhaps spuriously) from 320bp on April 30 to 315bp on May 31.

The fund’s Net Asset Value per Unit as of the close May 31 was $10.1623.

Returns to May 31, 2010
Period MAPF Index CPD
according to
Claymore
One Month +1.10% +0.30% +0.94%
Three Months -3.25% -2.29% -2.11%
One Year +20.07% 11.29% +7.73%
Two Years (annualized) +23.43% +2.76% +0.64%*
Three Years (annualized) +16.09% +1.16% -0.89%
Four Years (annualized) +13.26% +1.13%  
Five Years (annualized) +11.61% +1.51%  
Six Years (annualized) +11.37% +2.37%  
Seven Years (annualized) +12.74% +2.63%  
Eight Years (annualized) +11.94% +3.27%  
Nine Years (annualized) +12.43% +3.11%  
The Index is the BMO-CM “50”
MAPF returns assume reinvestment of dividends, and are shown after expenses but before fees.
CPD Returns are for the NAV and are after all fees and expenses.
* CPD does not directly report its two-year returns. The figure shown is the square root of product of the current one-year return and the similar figure reported for May 2009.
Figures for Omega Preferred Equity (which are after all fees and expenses) for 1-, 3- and 12-months are +0.4%, -2.4% and +10.3%, respectively, according to Morningstar after all fees & expenses
Figures for Jov Leon Frazer Preferred Equity Fund Class I Units (which are after all fees and expenses) for 1-, 3- and 12-months are +0.6%, -2.5% & +5.5% respectively, according to Morningstar
Figures for AIC Preferred Income Fund (which are after all fees and expenses) for 1-, 3- and 12-months are +0.4%, -2.5% & +4.6%, respectively

MAPF returns assume reinvestment of dividends, and are shown after expenses but before fees. Past performance is not a guarantee of future performance. You can lose money investing in Malachite Aggressive Preferred Fund or any other fund. For more information, see the fund’s main page.

I am very pleased with the returns over the past year (which, now that the market and the fund’s returns have moderated, are now merely incredible, as opposed to “ridiculous” or “nonsensical”), but implore Assiduous Readers not to project this level of outperformance for the indefinite future. The year in the preferred share market was filled with episodes of panic and euphoria, together with many new entrants who do not appear to know what they are doing; perfect conditions for a disciplined quantitative approach.

Sometimes everything works … sometimes the trading works, but sectoral shifts overwhelm the increment … sometimes nothing works. The fund seeks to earn incremental return by selling liquidity (that is, taking the other side of trades that other market participants are strongly motivated to execute), which can also be referred to as ‘trading noise’. There have been a lot of strongly motivated market participants in the past year, generating a lot of noise! The conditions of the past year may never be repeated in my lifetime … but the fund will simply attempt to make trades when swaps seem profitable, whether that implies monthly turnover of 10% or 100%.

There’s plenty of room for new money left in the fund. Just don’t expect the current level of outperformance every year, OK? While I will continue to exert utmost efforts to outperform, it should be borne in mind that beating the index by 500bp represents a good year, and there will almost inevitably be periods of underperformance in the future.

The yields available on high quality preferred shares remain elevated, which is reflected in the current estimate of sustainable income.

Calculation of MAPF Sustainable Income Per Unit
Month NAVPU Portfolio
Average
YTW
Leverage
Divisor
Securities
Average
YTW
Capital
Gains
Multiplier
Sustainable
Income
per
current
Unit
June, 2007 9.3114 5.16% 1.03 5.01% 1.1883 0.3926
September 9.1489 5.35% 0.98 5.46% 1.1883 0.4203
December, 2007 9.0070 5.53% 0.942 5.87% 1.1883 0.4448
March, 2008 8.8512 6.17% 1.047 5.89% 1.1883 0.4389
June 8.3419 6.034% 0.952 6.338% 1.1883 $0.4449
September 8.1886 7.108% 0.969 7.335% 1.1883 $0.5054
December, 2008 8.0464 9.24% 1.008 9.166% 1.1883 $0.6206
March 2009 $8.8317 8.60% 0.995 8.802% 1.1883 $0.6423
June 10.9846 7.05% 0.999 7.057% 1.1883 $0.6524
September 12.3462 6.03% 0.998 6.042% 1.1883 $0.6278
December 2009 10.5662 5.74% 0.981 5.851% 1.0000 $0.6182
March 2010 10.2497 6.03% 0.992 6.079% 1.0000 $0.6231
May 2010 10.1623 6.35% 0.995 6.382% 1.0000 $0.6486
NAVPU is shown after quarterly distributions of dividend income and annual distribution of capital gains.
Portfolio YTW includes cash (or margin borrowing), with an assumed interest rate of 0.00%
The Leverage Divisor indicates the level of cash in the account: if the portfolio is 1% in cash, the Leverage Divisor will be 0.99
Securities YTW divides “Portfolio YTW” by the “Leverage Divisor” to show the average YTW on the securities held; this assumes that the cash is invested in (or raised from) all securities held, in proportion to their holdings.
The Capital Gains Multiplier adjusts for the effects of Capital Gains Dividends. On 2009-12-31, there was a capital gains distribution of $1.989262 which is assumed for this purpose to have been reinvested at the final price of $10.5662. Thus, a holder of one unit pre-distribution would have held 1.1883 units post-distribution; the CG Multiplier reflects this to make the time-series comparable. Note that Dividend Distributions are not assumed to be reinvested.
Sustainable Income is the resultant estimate of the fund’s dividend income per current unit, before fees and expenses. Note that a “current unit” includes reinvestment of prior capital gains; a unitholder would have had the calculated sustainable income with only, say, 0.9 units in the past which, with reinvestment of capital gains, would become 1.0 current units.

Significant positions were held in Fixed-Reset issues on April 30; all of which (with the exception of YPG.PR.C) currently have their yields calculated with the presumption that they will be called by the issuers at par at the first possible opportunity. A split-share issue (BNA.PR.C) is also held; since this has a maturity date, the yield cannot be regarded as permanently sustainable. This presents another complication in the calculation of sustainable yield.

However, if the entire portfolio except for the PerpetualDiscounts were to be sold and reinvested in these issues, the yield of the portfolio would be the 6.44% shown in the MAPF Portfolio Composition: May 2010 analysis (which is in excess of the 6.29% index yield on May 31). Given such reinvestment, the sustainable yield would be $10.1623 * 0.0644 = $0.6545 , whereas similar calculations for April and March result in $0.6503 and $0.6457, respectively.

Different assumptions lead to different results from the calculation, but the overall positive trend is apparent. I’m very pleased with the results! It will be noted that if there was no trading in the portfolio, one would expect the sustainable yield to be constant (before fees and expenses). The success of the fund’s trading is showing up in

  • the very good performance against the index
  • the long term increases in sustainable income per unit

As has been noted, the fund has maintained a credit quality equal to or better than the index; outperformance is due to constant exploitation of trading anomalies.

Again, there are no predictions for the future! The fund will continue to trade between issues in an attempt to exploit market gaps in liquidity, in an effort to outperform the index and keep the sustainable income per unit – however calculated! – growing.

FIG.PR.A: Mass Retraction Prior to Warrant Expiry

June 3rd, 2010

Faircourt Asset Management, on behalf of Faircourt Income & Growth Split Trust, has announced:

that it has received requests for redemptions totaling approximately 6.4 million Units of the Trust. Payment will be made on July 22nd, 2010 based on the Net Asset Value per Trust Unit calculated using a three day volume weighted average price for exchange-traded securities held by the Trust, determined as of June 30, 2010 less costs of funding the redemption, including commissions.

The Trust currently has approximately 4.9 million Warrants outstanding, at an exercise price of $4.00 per unit while the current Net Asset Value of the Trust as at the close of business June 2nd is $4.57 or $4.34 on fully diluted basis. The Warrants will expire on June 25th, 2010. Holders of Warrants desiring to exercise Warrants and purchase Units should ensure that subscriptions and payment in full of the Subscription Price are received by the Warrant Agent prior to 4:01 p.m. (Toronto time) on June 25, 2010. Warrants submitted to the Warrant Agent for exercise on June 25, 2010 will be exercised in accordance with the practices and procedures of the Warrant Agent and the applicable CDS Participants

The fund, advised by Acuity Investment Management Inc., is most notable for having the Capital Units underperform the benchmark by over 20% annually in the five years to 2009-12-31. There were 9,806,610 units outstanding as of year-end, so this announcement reflects a mass churning by unitholders – assuming they exercise their warrants, which are in-the-money. Otherwise, of course, it’s just a plain mass-retraction.

FIG.PR.A was last mentioned on PrefBlog when the Capital Units’ dividend was reinstated. FIG.PR.A is tracked by HIMIPref™ but is relegated to the Scraps index on credit concerns.

June 3, 2010

June 3rd, 2010

Covered bonds are seeing increased issuance:

About $5.7 billion of the securities have been sold or are being marketed this week worldwide, almost double last week’s volume, data compiled by Bloomberg show. Bank of Montreal, Canada’s fourth-largest bank, sold $2 billion of the bonds due in 2015.

The increase in covered bond sales contrasts with a decline in issuance for corporate debt, which fell to $70 billion last month, less than half April’s tally and the least since 2003.

It’s a nice trend, one that I hope continues and widens. It would be very nice if, for instance, long bonds secured by long lived assets (real-estate, etc.) were more available. The pendulum has swung too far in favour of companies’ equity holders.

The BMO Covered Bonds were USD, private placement, five-year, 2.85% coupon. Sounds good? Tough luck, Charlie, the regulators are protecting you from them.

DBRS comments:

Despite the above strengths, the Covered Bonds have the following challenges. First, a weakened housing market in Canada could result in higher defaults and loss severities than the assumptions used for credit protection assessment. This risk is significantly mitigated by the mortgage insurance covering principal and interest provided by AAA-rated CMHC. Second, BMO may be required to add mortgages to maintain the Cover Pool, incurring substitution and potential credit deterioration risk. These risks are mitigated by the mortgage insurance provided by CMHC and the ongoing monitoring of the Cover Pool to ensure the overcollateralization available (at least 3% as of May 31, 2010) is commensurate with the AAA rating assigned. Third, there is an inherent liquidity gap between the scheduled repayments of the Covered Bonds and the repayment of underlying mortgage loans over time. This risk is mitigated by the overcollateralized Cover Pool, the buildup of a reserve fund if BMO’s rating falls below A (low) or R-1 (middle) and the extendible maturity date for 12 months upon a default by BMO. Lastly, there is no specific covered bond legislative framework in Canada. This risk is mitigated by the contractual obligations of the transaction parties, supported by the well developed commercial and bankruptcy laws in Canada, satisfactory opinions provided by legal counsel to BMO and a generally creditor-friendly legal environment in Canada.

The legal framework problem is alleged to be under review, as discussed on PrefBlog on March 9 and by Ogilvy Renault, inter alia.

The SEC’s Market Structure Roundtable kicked off with a speech by Mary Shapiro:

Our roundtable is also informed by a more recent event: the severe, albeit brief, market disruption of May 6. For 20 minutes that afternoon, U.S. financial markets failed to execute their essential price discovery function, experiencing a decline and recovery that was unprecedented in its speed and scope. That period of fluctuating prices both directly harmed investors who traded based on flawed price discovery signals and undermined investors’ faith in the integrity and fairness of the markets

Her first conclusion – of direct harm – is a little hard to follow. There were two types of traders who traded during that period: value investors and idiots. The former made money. Shouldn’t we consider harm to idiots to be a good thing? I haven’t seen many signs of undermined faith, either. Meanwhile, Luis Aguilar appears to be lobbying for a post-SEC job as “investor advocate”.

On February 5 I discussed a form of solar power that actually has a chance of being more than a feel-good exercise; now, another method is attracting attention:

“We’ve produced tens of thousands of gallons, and by the end of 2010, I hope I can say we’ve produced hundreds of thousands,” [Solazyme cofounder] Wolfson, 39, says. “In the next two years, we should get the cost down to the $60 to $80-a-barrel range.”

At that price, Solazyme’s algae fuel would compete with $80-a-barrel oil.

Algae proponents differ on growing methods. Open ponds, the choice of most researchers, rely on photosynthesis. Algae grow and fill with oil as they use sunlight to convert carbon dioxide into sugar and chemical energy. Ponds, though, can get infested by pesky, low-oil native organisms or become the targets of microscopic aquatic creatures.

Solazyme is trying fermentation, producing its algae without light in metal vats. This requires adding sugar or other feedstock before the algae are dried and the oil extracted.

There’s hope for the world yet, evidenced by attitudes towards greenwashing:

When asked for their reasons for not living more greenly, 46 per cent of Canadians cited their belief that companies are “greenwashing,” lying about or exaggerating their products’ environmental sustainability. This cynicism beat out cost and inconvenience as reasons for not helping the environment.

smoking …:

In the new survey, 13 per cent of people in Grades 10 to 12 called themselves current smokers, up from 11 per cent during the previous survey period. While only 3 per cent of those in Grades 6 to 9 called themselves current smokers, unchanged from 2006-2007, that number rose from 2 per cent in 2004-2005.

“It is a troubling development,” [senior policy analyst at the Canadian Cancer Society] Mr. [Rob] Cunningham said. “The overwhelming majority of smokers begin as teens or preteens.”

… and Facebook …:

Privacy concerns don’t seem to have scared Canadians off Facebook.

More than 912,000 Canadians signed up for the site last month, a six-per-cent increase in membership.

Good, bad, indifferent … diversity of views and rejection of preaching platitudes can only be a good thing.

There was another strong advance in the Canadian preferred share market, this time on moderate volume, as PerpetualDiscounts gained 50bp and FixedResets were up 6bp. There were no losers on the performance table and PerpetualDiscounts dominated the volume highlights.

The Financial Post’s block trade reporter continues to be inoperable.

HIMIPref™ Preferred Indices
These values reflect the December 2008 revision of the HIMIPref™ Indices

Values are provisional and are finalized monthly
Index Mean
Current
Yield
(at bid)
Median
YTW
Median
Average
Trading
Value
Median
Mod Dur
(YTW)
Issues Day’s Perf. Index Value
Ratchet 2.62 % 2.75 % 44,240 20.87 1 0.2326 % 2,122.2
FixedFloater 5.19 % 3.26 % 29,101 19.98 1 0.9634 % 3,084.9
Floater 2.41 % 2.80 % 92,327 20.18 3 0.0734 % 2,241.3
OpRet 4.89 % 3.86 % 96,796 2.82 11 0.1561 % 2,310.7
SplitShare 6.45 % 5.64 % 106,497 0.08 2 -0.0667 % 2,150.5
Interest-Bearing 0.00 % 0.00 % 0 0.00 0 0.1561 % 2,112.9
Perpetual-Premium 0.00 % 0.00 % 0 0.00 0 0.4975 % 1,843.0
Perpetual-Discount 6.15 % 6.22 % 206,512 13.61 77 0.4975 % 1,744.5
FixedReset 5.47 % 4.25 % 424,071 3.52 45 0.0580 % 2,160.2
Performance Highlights
Issue Index Change Notes
BNS.PR.L Perpetual-Discount 1.00 % YTW SCENARIO
Maturity Type : Limit Maturity
Maturity Date : 2040-06-03
Maturity Price : 19.13
Evaluated at bid price : 19.13
Bid-YTW : 5.97 %
CM.PR.D Perpetual-Discount 1.02 % YTW SCENARIO
Maturity Type : Limit Maturity
Maturity Date : 2040-06-03
Maturity Price : 23.45
Evaluated at bid price : 23.75
Bid-YTW : 6.13 %
PWF.PR.L Perpetual-Discount 1.04 % YTW SCENARIO
Maturity Type : Limit Maturity
Maturity Date : 2040-06-03
Maturity Price : 20.41
Evaluated at bid price : 20.41
Bid-YTW : 6.34 %
CM.PR.G Perpetual-Discount 1.05 % YTW SCENARIO
Maturity Type : Limit Maturity
Maturity Date : 2040-06-03
Maturity Price : 21.71
Evaluated at bid price : 22.04
Bid-YTW : 6.20 %
CM.PR.P Perpetual-Discount 1.11 % YTW SCENARIO
Maturity Type : Limit Maturity
Maturity Date : 2040-06-03
Maturity Price : 22.37
Evaluated at bid price : 22.80
Bid-YTW : 6.09 %
SLF.PR.E Perpetual-Discount 1.12 % YTW SCENARIO
Maturity Type : Limit Maturity
Maturity Date : 2040-06-03
Maturity Price : 18.08
Evaluated at bid price : 18.08
Bid-YTW : 6.24 %
W.PR.H Perpetual-Discount 1.18 % YTW SCENARIO
Maturity Type : Limit Maturity
Maturity Date : 2040-06-03
Maturity Price : 21.50
Evaluated at bid price : 21.50
Bid-YTW : 6.51 %
SLF.PR.C Perpetual-Discount 1.19 % YTW SCENARIO
Maturity Type : Limit Maturity
Maturity Date : 2040-06-03
Maturity Price : 17.86
Evaluated at bid price : 17.86
Bid-YTW : 6.24 %
PWF.PR.G Perpetual-Discount 1.33 % YTW SCENARIO
Maturity Type : Limit Maturity
Maturity Date : 2040-06-03
Maturity Price : 23.44
Evaluated at bid price : 23.70
Bid-YTW : 6.30 %
PWF.PR.E Perpetual-Discount 1.38 % YTW SCENARIO
Maturity Type : Limit Maturity
Maturity Date : 2040-06-03
Maturity Price : 21.85
Evaluated at bid price : 22.10
Bid-YTW : 6.30 %
POW.PR.A Perpetual-Discount 1.56 % YTW SCENARIO
Maturity Type : Limit Maturity
Maturity Date : 2040-06-03
Maturity Price : 22.60
Evaluated at bid price : 22.85
Bid-YTW : 6.22 %
PWF.PR.F Perpetual-Discount 1.59 % YTW SCENARIO
Maturity Type : Limit Maturity
Maturity Date : 2040-06-03
Maturity Price : 21.10
Evaluated at bid price : 21.10
Bid-YTW : 6.31 %
ENB.PR.A Perpetual-Discount 1.59 % YTW SCENARIO
Maturity Type : Limit Maturity
Maturity Date : 2040-06-03
Maturity Price : 23.36
Evaluated at bid price : 23.65
Bid-YTW : 5.84 %
Volume Highlights
Issue Index Shares
Traded
Notes
TD.PR.S FixedReset 111,335 YTW SCENARIO
Maturity Type : Call
Maturity Date : 2013-08-30
Maturity Price : 25.00
Evaluated at bid price : 25.71
Bid-YTW : 4.23 %
CM.PR.J Perpetual-Discount 101,612 YTW SCENARIO
Maturity Type : Limit Maturity
Maturity Date : 2040-06-03
Maturity Price : 18.40
Evaluated at bid price : 18.40
Bid-YTW : 6.20 %
ELF.PR.F Perpetual-Discount 84,200 YTW SCENARIO
Maturity Type : Limit Maturity
Maturity Date : 2040-06-03
Maturity Price : 19.30
Evaluated at bid price : 19.30
Bid-YTW : 7.00 %
CM.PR.H Perpetual-Discount 71,310 YTW SCENARIO
Maturity Type : Limit Maturity
Maturity Date : 2040-06-03
Maturity Price : 19.53
Evaluated at bid price : 19.53
Bid-YTW : 6.23 %
SLF.PR.A Perpetual-Discount 57,925 YTW SCENARIO
Maturity Type : Limit Maturity
Maturity Date : 2040-06-03
Maturity Price : 18.94
Evaluated at bid price : 18.94
Bid-YTW : 6.28 %
CM.PR.I Perpetual-Discount 54,470 YTW SCENARIO
Maturity Type : Limit Maturity
Maturity Date : 2040-06-03
Maturity Price : 19.24
Evaluated at bid price : 19.24
Bid-YTW : 6.20 %
There were 26 other index-included issues trading in excess of 10,000 shares.

MAPF Portfolio Composition: May 2010

June 3rd, 2010

Turnover picked up a little in May to about 17%.

Trades were, as ever, triggered by a desire to exploit transient mispricing in the preferred share market (which may the thought of as “selling liquidity”), rather than any particular view being taken on market direction, sectoral performance or credit anticipation.

MAPF Sectoral Analysis 2010-5-31
HIMI Indices Sector Weighting YTW ModDur
Ratchet 0% N/A N/A
FixFloat 0% N/A N/A
Floater 0% N/A N/A
OpRet 0% N/A N/A
SplitShare 4.0% (-0.2) 8.37% 6.84
Interest Rearing 0% N/A N/A
PerpetualPremium 0.0% (0) N/A N/A
PerpetualDiscount 81.3% (+3.1) 6.44% 13.29
Fixed-Reset 9.2% (-3.0) 4.53% 3.61
Scraps (FixedReset) 4.9% (-0.1) 7.24% 12.18
Cash 0.5% (0) 0.00% 0.00
Total 100% 6.35% 12.01
Totals and changes will not add precisely due to rounding. Bracketted figures represent change from April month-end. Cash is included in totals with duration and yield both equal to zero.

The “total” reflects the un-leveraged total portfolio (i.e., cash is included in the portfolio calculations and is deemed to have a duration and yield of 0.00.). MAPF will often have relatively large cash balances, both credit and debit, to facilitate trading. Figures presented in the table have been rounded to the indicated precision.

Credit distribution is:

MAPF Credit Analysis 2010-5-31
DBRS Rating Weighting
Pfd-1 0 (0)
Pfd-1(low) 61.0% (-5.9)
Pfd-2(high) 17.3% (+0.1)
Pfd-2 0 (0)
Pfd-2(low) 16.3% (+6.0)
Pfd-3(high) 4.9% (-0.1)
Cash 0.5% (0)
Totals will not add precisely due to rounding. Bracketted figures represent change from April month-end.

The decline in credit quality was due to the purchase of W.PR.J from a grab-bag of issues, mainly MFC.PR.C and MFC.PR.D:

Major MAPF Trades Affecting Credit Quality
Date W.PR.J MFC.PR.C MFC.PR.D
4/30
Bid
21.50 17.85 26.83
5/7 Bot
21.46
Sold
18.14
Sold
27.00
5/30
Bid
21.62 18.07 26.87
Dividends   5/22
Missed 0.28125
5/22
Missed 0.4125
Only major trades are shown. Details are incomplete and approximate. All trades wil be published at the time the Semi-annual report is released.

Liquidity Distribution is:

MAPF Liquidity Analysis 2010-5-31
Average Daily Trading Weighting
<$50,000 0.0% (0)
$50,000 – $100,000 0.0% (0)
$100,000 – $200,000 27.4% (+3.3)
$200,000 – $300,000 48.5% (+3.4)
>$300,000 23.6% (-6.7)
Cash 0.5% (0)
Totals will not add precisely due to rounding. Bracketted figures represent change from April month-end.

MAPF is, of course, Malachite Aggressive Preferred Fund, a “unit trust” managed by Hymas Investment Management Inc. Further information and links to performance, audited financials and subscription information are available the fund’s web page. A “unit trust” is like a regular mutual fund, but is sold by offering memorandum rather than prospectus. This is cheaper, but means subscription is restricted to “accredited investors” (as defined by the Ontario Securities Commission) and those who subscribe for $150,000+. Fund past performances are not a guarantee of future performance. You can lose money investing in MAPF or any other fund.

A similar portfolio composition analysis has been performed on the Claymore Preferred Share ETF (symbol CPD) as of August 17, 2010, and published in the September PrefLetter. When comparing CPD and MAPF:

  • MAPF credit quality is better
  • MAPF liquidity is a little better
  • MAPF Yield is higher
  • Weightings in
    • MAPF is much more exposed to PerpetualDiscounts
    • MAPF is much less exposed to Operating Retractibles
    • MAPF is more exposed to SplitShares
    • MAPF is less exposed to FixFloat / Floater / Ratchet
    • MAPF weighting in FixedResets is much lower

FRBNY Staff Propose Floating Rate Contingent Capital

June 3rd, 2010

The Federal Reserve Bank of New York has released Staff Report #448, by Suresh Sundaresan and Zhenyu Wang, titled Design of Contingent Capital with a Stock Price Trigger for Mandatory Conversion:

The proposal for banks to issue contingent capital that must convert into common equity when the banks’ stock price falls below a specified threshold, or “trigger,” does not in general lead to a unique equilibrium in equity and contingent capital prices. Multiple or no equilibrium arises because both equity and contingent capital are claims on the assets of the issuing bank. For a security to be robust to price manipulation, it must have a unique equilibrium. For a unique equilibrium to exist, mandatory conversion cannot result in any value transfers between equity holders and contingent capital investors. The necessary condition for unique equilibrium is usually not satisfied by contingent capital with a fixed coupon rate; however, contingent capital with a floating coupon rate is shown to have a unique equilibrium if the coupon rate is set equal to the risk-free rate. This structure of contingent capital anchors its value to par throughout the time before conversion, making it implementable in practice. Although contingent capital with a unique equilibrium is robust to price manipulation, the no-value-transfer condition may preclude it from generating the desired incentives for bank managers and demand from investors.

They commence with an overview of the market and current issuance:

Recently there have been a few issues of junior debt with such conversion provisions. Lloyds Bank recently issued the so called contingent convertible (CC, or “Coco bonds”). These bonds will convert into ordinary shares if the consolidated core tier one ratio of Lloyds falls below 5%. The bonds themselves are subordinated bonds, which prior to conversion count as the lower tier 2 capital, but count as core tier 1 in the context of the Financial Services Authority (FSA) stress tests. They will count as core tier 1 for all purposes upon conversion. Swiss regulators are encouraging Swiss banks to issue contingent capital. In Germany, preferred stocks have been issued with similar features.

I didn’t know about the German prefs!

The authors are obsessed with value transfer:

The main thrust of our paper is the following: when triggers for mandatory conversion are placed directly on equity prices, there is a need to ensure that conversion does not transfer value between equity and CC holders. The economic intuition behind CC design problem is as follows. In the contingent capital (CC) proposed in the literature, junior debt converts to equity shares when the stock price reaches a certain threshold at low level. This sounds like a normal and innocuous feature. However, the unusual part of the CC design is that conversion into equity is mandatory as soon as stock price hits a trigger level from above. Since common stock is the residual claim of bank’s value, it must be priced together with the CC. Keeping firm value fixed, a dollar more for the CC value must be associated with a dollar less for the equity value.8 Therefore, a value transfer between equity and CC disturbs equilibrium by moving the stock price up or down, depending on the conversion ratio specified. The design of the conversion ratio must ensure that there is no such value transfer. The design proposals in the literature usually ensure that there is no value transfer at maturity, but do not ensure it before maturity.

Basically – as far as I can tell, the case against value transfer is not made explicit – value transfer will create an incentive for manipulation. If a Contingent Capital issue has a price and conversion feature such that conversion will be profitable, it will be in the interest of the investor to attack the bank stock in an attempt to force this conversion. My problem with this obsession is that I don’t have a problem with that and don’t think the regulators should, either. The potential for value transfer has been discussed on PrefBlog, in the post Payoff Structure of Contingent Capital with Trigger = Conversion.

The only way to prevent this is to ensure that there is no value transfer at conversion. This requires that at all possible conversion times, the value of converted shares must be exactly equal to the market value of the un-converted CC. This requirement implies that the conversion ratio usually cannot be chosen ex-ante once the trigger level has been chosen: this is due to the fact that the trigger level multiplied by the conversion ratio must equal the market value of the un-converted CC. However, there is one scenario when we can select the conversion ratio ex-ante: this corresponds to the design of CC such that the coupon payments are indexed in such a way that the CC always sells at par. In this case, we can set the conversion ratio as simply the par value divided by the trigger level of stock price at which mandatory conversion will occur. We explore this design possibility further in the paper.

In order to ensure that the CC is always priced at par, they take a huge leap:

To use the par value for conversion ratio, we need to focus on a structure that makes the market value of the CC immune to changes in interest rates and default risk. For example, if the CC had no default risk, then by selecting the coupon rate at each instant to be the instantaneously risk-free rate we can assure that the CC will trade at par. See Cox, Ingersoll and Ross (1980) for a proof of this assertion

It has been a long time since I’ve read the Cox, Ingersoll & Ross paper and, frankly, I don’t remember that conclusion. But I don’t need to remember it, since it’s nonsense. It implies that there is a zero (or at least constant) liquidity premium: if I am holding short term paper, it’s because I may want cash in the near future. Why would I buy long dated paper that I might be able to turn into a known quantity of cash when I can buy actual Treasury Bills that will definitely turn into cash? I need a premium to buy the long stuff, and that premium will be based on my assessment of the likelihood of my actually needing the cash. The premium will change according to my – and the market’s – changing assessment of the potential need. That’s basic Liquidity Hypothesis stuff.

With default risk, however, no design of floating coupons will actually guarantee that the CC will sell at par. However, by choosing the coupon to reflect the market rates on short-term default-risky bank obligations it is possible to keep the price close to the par value. For example, if the coupon is tied to London Inter-bank Offered Rates (LIBOR) then the price of CC, which is a bank floater should remain close to par.

There are notes like this already – for instance Scotiabank’s perps:

August 2085 Floating US $182 million bearing interest at a floating rate of the offered rate for six-month Eurodollar deposits plus 0.125%. Redeemable on any interest payment date. Total repurchases in 2009 amounted to approximately US $32 million

There was a craze for securities of this type in the late 1980’s. It collapsed. Just like Monthly Auction Preferred Shares and all the other crap that seeks to fund long term debt at short term rates [and who knows? Maybe FixedResets will be the next example!]

This disregard of financial history mars the paper, but there are some other good references and notes:

Consistent with many other observers (e.g., Acharya, Thakor and Mehran, 2010), we note that the mandatory conversion of junior debt should automatically result in suspension of dividends to all common stock holders. Holding other factors the same, this should serve to alleviate the selling pressure: any attempt to short the stock by the holders of CC will also result in losses in foregone future dividends on their long positions.

I don’t agree.

However, it is nice to see a Fed paper looking at the type of CC structure that I have been arguing in favour of for a long time! It’s also pleasant to see a proper paper, with proper references and no outright fabrications, unlike those produced by Julie Dickson of OSFI.

FRBNY Staff Examine Sub-Prime RMBS Credit Ratings

June 2nd, 2010

The Federal Reserve Bank of New York has released Staff Report #449 by Adam Ashcraft, Paul Goldsmith-Pinkham and James Vickery titled MBS Ratings and the Mortgage Credit Boom:

We study credit ratings on subprime and Alt-A mortgage-backed-securities (MBS) deals issued between 2001 and 2007, the period leading up to the subprime crisis. The fraction of highly rated securities in each deal is decreasing in mortgage credit risk (measured either ex ante or ex post), suggesting that ratings contain useful information for investors. However, we also find evidence of significant time variation in risk-adjusted credit ratings, including a progressive decline in standards around the MBS market peak between the start of 2005 and mid-2007. Conditional on initial ratings, we observe underperformance (high mortgage defaults and losses and large rating downgrades) among deals with observably higher risk mortgages based on a simple ex ante model and deals with a high fraction of opaque lowdocumentation loans. These findings hold over the entire sample period, not just for deal cohorts most affected by the crisis.


Click for Big

Figure plots average net nonprime MBS ratings revisions by calendar quarter of deal issuance. Covers subprime and Alt-A deals in our sample issued between Q1:2001 and Q4:2007. Y-axis measures the average net number of rating notches that securities issued in calendar quarter have been downgraded between issuance and August 2009, weighted by security original face value.

Figure 1 plots net rating revisions on subprime and Alt-A MBS issued since 2001. While net rating revisions are small for earlier vintages, MBS issued since 2005 have experienced historically large downgrades, by 3-10 rating notches on average, depending on the vintage. Critics interpret these facts as evidence of important flaws in the credit rating process, either due to incentive problems associated with the “issuer-pays” rating model, or simply insufficient diligence or competence (e.g. US Senate, 2010; White, 2009; Fons, 2008).1 In their defense however, rating agencies argue that recent MBS performance primarily reflects a set of large, unexpected shocks, including an unprecedented decline in home prices, and a financial crisis, events which surprised most market participants.

They look at the problem of relative risk:

The second part of our analysis examines how well credit ratings order relative risks across MBS deals from within a given cohort. Here we focus on studying variation in realized performance. If credit ratings are informative, mortgages underlying deals rated more optimistically (i.e. lower subordination, or equivalently a larger fraction of highly-rated securities), should perform better expost, in terms of lower mortgage default and loss rates. Furthermore, prior information available when the deal was initially rated should not be expected to systematically predict deal performance, after controlling for credit ratings. This is because this prior information should already be reflected in the ratings themselves, to the extent it is informative about default risk.

I strongly disagree with their assertions in thelast two sentences, which is simply a variation on the Efficient Market Hypothesis. As I have repeatedly stressed, financial markets represent a chaotic system, which is a system in which various factors leading to the result can interact in unusual ways – a small difference at time 0 can eventually be shown to lead to an enormous difference at time t.

If I work for a garden center and predict fine planting weather for the following weekend – which turns out to be disastrously wrong – the discovery that I neglected to account for a butterfly flapping its wings in China an extra time does not make me incompetent and does not prove that the conflict of interest presented by the nature of my employment corrupted my obectivity. Either conclusion could be true, but require a lot more proof than the premises stated.

Mind you, the authors’ data is much more obviously relevant to the problem than in the garden-centre scenario:

We find higher subordination is generally correlated with worse ex-post mortgage performance, as expected. However, conditional on subordination, time dummies and credit enhancement features, we also find significant variation in performance across different types of deals. First, MBS deals backed by loans with observably risky characteristics such as low FICO scores and high leverage (summarized by the projected default rate from our simple ex-ante model) perform poorly relative to initial subordination levels. Moreover, deals with a high share of low- and no-documentation loans (“low doc”), perform disproportionately poorly, even relative to other types of observably risky deals. This suggests such deals were not rated conservatively enough ex-ante.

Importantly, they show that these correlations are robust throughout the period of interest:

These findings hold robustly across several different measures of deal performance: (i) early-payment defaults; (ii) rating downgrades; (iii) cumulative losses; (iv) cumulative defaults. In some cases, our results are magnified for deals issued during the period of peak MBS issuance from the start of 2005 to mid-2007. However, perhaps most notably, we repeat our analysis separately for each annual deal cohort between 2001 and 2007. We find that the underperformance of low-doc and observably high risk deals holds surprisingly robustly over the entire sample period, including earlier deal vintages not significantly affected by the crisis. Indeed, these differences in performance can be observed even only based on performance data publicly available before the crisis starts.

This is an important test, but still does not prove incompetence or corruption. It is important to consider what information was available during the peak period – had these correlations shown up at that time? They address this question in the section “Loan Level Model”:

While we are careful to estimate the model parameters only using prior available data, a “look-back” bias may also arise if our choice of explanatory variables or model structure is influenced by knowledge of the evolution of the crisis. To minimize these concerns, we deliberately choose a simple model structure (a basic logit), and consider only explanatory variables that CRAs also used in the rating process. For example, Moody’s (2003) description of their primary subprime ratings model lists as inputs all the main variables included in our default model specification.8 We emphasize that this default model is intentionally simple, to avoid look-back biases, and in several respects is less complex than the models used by rating agencies themselves.9 Any shortcomings of our model lower the benchmark against which credit ratings are compared as a predictor of deal performance (see Section 7 for further discussion).

The literature review is CRA-hostile, ranging from the trivial:

Bolton et al. (2008) assume each CRA has a private signal of the quality of a security to be rated, which can be either reported truthfully or misreported. Misreporting leads to an exogenous reputation cost if detected, but generates higher fee income from security issuers in the current period. Bolton et al show ratings inflation is more severe when reputation costs are low relative to current rating profits, suggesting CRAs are more likely to misreport risk during booms.

… to the more interesting:

Turning to structured finance ratings, Benmelech and Dlugosz (2010) document the wave of recent downgrades across different types of collateralized debt obligations (CDOs). They find evidence that securities rated by only one CRA are downgraded more frequently, which is interpreted as evidence of rating shopping. Griffin and Tang (2009) find that published CDO ratings by a CRA are less accurate than the direct output of that CRA’s internal model, suggesting judgmental adjustments were applied to model-generated ratings that worsened rating quality. Coval, Jurek and Stafford (2009) show default probabilities for structured finance bonds are very sensitive to correlation assumptions. Studying MBS, He, Qian and Strahan (2009) present evidence that large security issuers receive more generous ratings, particularly for securities issued from 2004-06. (Unlike this paper, however, these authors are not able to control for information on deal structure or underlying mortgage collateral). Cohen (2010) finds evidence that measures of rating shopping incentives, such as the market share of each CRA, affects commercial MBS subordination.

Kisgen and Strahan (2009) present evidence that ratings influence prices through their role in financial regulation. They show the certification of DBRS by the SEC shifts prices in the direction of their DBRS rating amongst bonds already rated by DBRS. Adelino (2009) finds performance of junior triple-A MBS bonds is uncorrelated with initial prices, suggesting triple-A investors relied excessively on credit ratings, rather than conducting due diligence. Chernenko and Sunderam (2009) find ratings variation around the investment grade boundary creates market segmentation that affects credit supply and firm investment.

It is interesting to contrast Kisgen and Strahan’s point with the prior adoration of the Efficient Market Hypothesis!

The authors conclude in part:

Our evidence does suggest that ratings are informative, and also rejects a simple story that credit rating standards deteriorate uniformly over the pre-crisis period. However, we find evidence of apparently significant time-series variation in subordination levels; most robustly, we observe a significant decline in risk-adjusted subordination levels between the start of 2005 and mid-2007.

Our analysis also suggests MBS ratings did not fully reflect publicly available data. Observably high-risk deals, measured by a simple ex-ante model, significantly underperform relative to their initial subordination levels. Deals with a high share of low-documentation mortgages also perform disproportionately worse compared to other types of risky deals. These two results are evident even for earlier vintages, and can be identified even only using pre-crisis data.

Our results are not conclusive about the role of explicit agency frictions in the rating process. However, two of our results appear consistent with recent theoretical literature modeling these frictions: (i) the poor performance relative to ratings of deals backed by opaque low-documentation loans, and (ii) the observed decline in risk-adjusted subordination around the peak of MBS issuance, when incentive problems are likely most severe. Further analysis of the importance of explicit rating shopping and other incentive problems is, we believe, an important topic for future research.


Click for Big

[The above chart presents] conditional and risk-adjusted AAA subordination for subprime and Alt-A deals, respectively. Risk-adjusted subordination reflects residual changes in credit ratings after controlling for the variables in Table 5 (such as the model-projected default rate, insurance dummy etc.)

June 2, 2010

June 2nd, 2010

The Financial Crisis Inquiry Commission kicks off its hearings on credit ratings today, including testimony from Raymond W. McDaniel, Chairman and Chief Executive Officer, Moody’s Corporation:

  • Credit Rating Agencies are commenters, not gatekeepers
  • Credit Ratings are not investment advice
  • Rating analysts do not structure or underwrite securities
  • Investors should not rely on rely on ratings to buy, sell or hold securities (investors must do their own work – you cannot outsource responsibility)
  • Every business model has conflicts of interest that must be managed
  • Concerns about rating shopping do not stem from the business model

Commission Chairman Angelidies, determined to display his prejudice, has been quoted:

In his opening remarks, Chairman Phil Angelides said, “To be blunt, the picture is not pretty.” He added that “Moody’s did very well. The investors who relied on Moody’s ratings did not do so well.”

Angelides characterized the ratings service as a “triple-A factory,” saying that it assigned the top grade to 42,625 residential mortgage-backed securities from 2000 to 2007.

“In 2006 alone, Moody’s gave 9,029 mortgage-backed securities a triple-A rating,” said Angelides, whose panel was created to investigate the causes of the financial crisis as Congress debates the most sweeping overhaul of banking regulations since the Great Depression. “To put that in perspective, Moody’s currently bestows its triple-A rating on just four American corporations.”

Another day of fine returns in the Canadian preferred share market. “They” should “raise interest rates” more often! PerpetualDiscounts were up 31bp, while FixedResets gained 4bp as volume continued at slightly elevated levels.

No details of block trades are given today – the usual data source has been 404ed and it appears that the Financial Post has not yet completed implementation of the new publication mechanism – either that, or I can’t figure out the easy-to-use intuitive interface!

PerpetualDiscounts now yield 6.23%, equivalent to 8.72% interest at the standard equivalency factor of 1.4x. Long corporates are now at about 5.65%, so the pre-tax interest-equivalent spread (also called the Seniority Spread) now stands at about 305bp, a 10bp tightening from the 315bp recorded at month end.

HIMIPref™ Preferred Indices
These values reflect the December 2008 revision of the HIMIPref™ Indices

Values are provisional and are finalized monthly
Index Mean
Current
Yield
(at bid)
Median
YTW
Median
Average
Trading
Value
Median
Mod Dur
(YTW)
Issues Day’s Perf. Index Value
Ratchet 2.62 % 2.77 % 43,910 20.89 1 1.1765 % 2,117.3
FixedFloater 5.24 % 3.31 % 30,220 19.94 1 -0.4317 % 3,055.4
Floater 2.41 % 2.79 % 96,134 20.20 3 -0.0734 % 2,239.6
OpRet 4.90 % 3.84 % 97,954 0.96 11 0.1279 % 2,307.1
SplitShare 6.44 % 5.88 % 106,610 0.08 2 -0.0888 % 2,151.9
Interest-Bearing 0.00 % 0.00 % 0 0.00 0 0.1279 % 2,109.6
Perpetual-Premium 0.00 % 0.00 % 0 0.00 0 0.3124 % 1,833.8
Perpetual-Discount 6.18 % 6.23 % 207,937 13.56 77 0.3124 % 1,735.9
FixedReset 5.47 % 4.23 % 430,364 3.53 45 0.0404 % 2,158.9
Performance Highlights
Issue Index Change Notes
ENB.PR.A Perpetual-Discount -1.98 % YTW SCENARIO
Maturity Type : Limit Maturity
Maturity Date : 2040-06-02
Maturity Price : 23.01
Evaluated at bid price : 23.28
Bid-YTW : 5.94 %
BAM.PR.E Ratchet 1.18 % YTW SCENARIO
Maturity Type : Limit Maturity
Maturity Date : 2040-06-02
Maturity Price : 22.87
Evaluated at bid price : 21.50
Bid-YTW : 2.77 %
CIU.PR.A Perpetual-Discount 1.20 % YTW SCENARIO
Maturity Type : Limit Maturity
Maturity Date : 2040-06-02
Maturity Price : 19.35
Evaluated at bid price : 19.35
Bid-YTW : 5.99 %
GWO.PR.F Perpetual-Discount 1.22 % YTW SCENARIO
Maturity Type : Limit Maturity
Maturity Date : 2040-06-02
Maturity Price : 23.02
Evaluated at bid price : 23.30
Bid-YTW : 6.33 %
PWF.PR.G Perpetual-Discount 1.26 % YTW SCENARIO
Maturity Type : Limit Maturity
Maturity Date : 2040-06-02
Maturity Price : 23.14
Evaluated at bid price : 23.39
Bid-YTW : 6.39 %
PWF.PR.H Perpetual-Discount 1.33 % YTW SCENARIO
Maturity Type : Limit Maturity
Maturity Date : 2040-06-02
Maturity Price : 22.53
Evaluated at bid price : 22.80
Bid-YTW : 6.38 %
Volume Highlights
Issue Index Shares
Traded
Notes
RY.PR.X FixedReset 313,475 YTW SCENARIO
Maturity Type : Call
Maturity Date : 2014-09-23
Maturity Price : 25.00
Evaluated at bid price : 27.00
Bid-YTW : 4.31 %
IGM.PR.B Perpetual-Discount 95,285 YTW SCENARIO
Maturity Type : Limit Maturity
Maturity Date : 2040-06-02
Maturity Price : 22.83
Evaluated at bid price : 22.96
Bid-YTW : 6.51 %
CM.PR.J Perpetual-Discount 33,126 YTW SCENARIO
Maturity Type : Limit Maturity
Maturity Date : 2040-06-02
Maturity Price : 18.30
Evaluated at bid price : 18.30
Bid-YTW : 6.24 %
POW.PR.D Perpetual-Discount 30,100 YTW SCENARIO
Maturity Type : Limit Maturity
Maturity Date : 2040-06-02
Maturity Price : 20.02
Evaluated at bid price : 20.02
Bid-YTW : 6.35 %
CM.PR.H Perpetual-Discount 27,345 YTW SCENARIO
Maturity Type : Limit Maturity
Maturity Date : 2040-06-02
Maturity Price : 19.43
Evaluated at bid price : 19.43
Bid-YTW : 6.27 %
CM.PR.I Perpetual-Discount 26,900 YTW SCENARIO
Maturity Type : Limit Maturity
Maturity Date : 2040-06-02
Maturity Price : 19.15
Evaluated at bid price : 19.15
Bid-YTW : 6.22 %
There were 32 other index-included issues trading in excess of 10,000 shares.

EMA.PR.A Slides on Opening Day with Derisory Volume

June 2nd, 2010

Emera has announced:

that it has completed its public offering of six million Cumulative 5-Year Rate Reset First Preferred Shares, Series A for aggregate gross proceeds of $150 million. The offering was first announced on May 25, 2010 when Emera entered into an agreement with a syndicate of underwriters in Canada led by Scotia Capital Inc., RBC Capital Markets and CIBC World Markets Inc.

The net proceeds of the offering will be used for general corporate purposes.

The aggregate gross proceeds of $150-million implies that the $50-million greenshoe was not exercised, while the low volume implies the underwriters had trouble flogging the issue.

EMA.PR.A is a FixedReset, 4.40%+184, announced May 25.

It traded 26,700 shares today in a range of 24.70-00 before closing at 24.75-89, 27×10.

Vital statistics are:

EMA.PR.A FixedReset YTW SCENARIO
Maturity Type : Limit Maturity
Maturity Date : 2040-06-02
Maturity Price : 24.70
Evaluated at bid price : 24.75
Bid-YTW : 4.53 %

EMA.PR.A is tracked by HIMIPref™, but has been relegated to the Scraps index on credit concerns.

Index Performance: May 2010

June 2nd, 2010

Performance of the HIMIPref™ Indices for May, 2010, was:

Total Return
Index Performance
Mayl 2010
Three Months
to
May 31, 2010
Ratchet -3.08% +4.62%
FixFloat -4.77% +3.41%
Floater -6.61% -4.88%
OpRet 0.00% -0.22%
SplitShare +0.78% +0.69%
Interest 0.00%**** -0.22%****
PerpetualPremium -0.17% -4.04%
PerpetualDiscount +1.31% -4.41%
FixedReset +1.27% -1.34%
**** The last member of the InterestBearing index was transferred to Scraps at the June, 2009, rebalancing; subsequent performance figures are set equal to the OperatingRetractible index
Passive Funds (see below for calculations)
CPD +0.93% -2.17%
DPS.UN +0.22% -0.82%
Index
BMO-CM 50 +0.30% -2.30%
TXPR Total Return +0.97% -2.07%

The pre-tax interest equivalent spread of PerpetualDiscounts over Long Corporates (which I also refer to as the Seniority Spread) ended the month at +315bp, a slight (an possibly spurious) decline from the +320bp recorded on April 30.

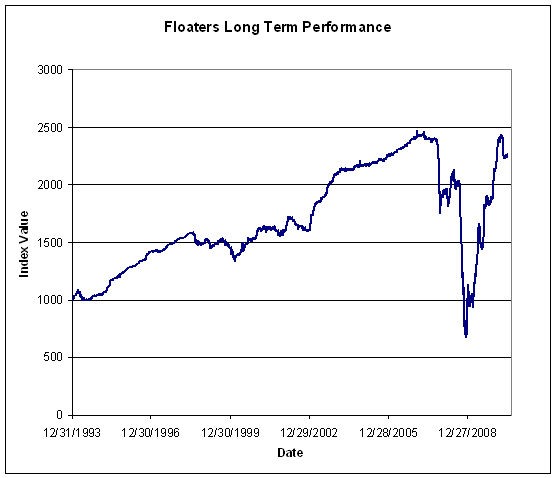
The trailing year returns are starting to look a bit more normal, as the Floater index has now lost the value of the incredible +33.18% return recorded in May 2009 and replaced it with this month’s total return of -6.61%.


Click for big

Floaters have had a wild ride, with May 2010 being their worst month since June 2009:


Click for big

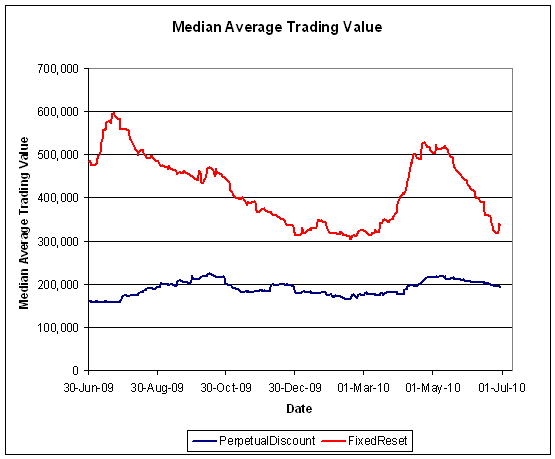
FixedReset volume declined during the month after their burst of activity in April when they performed poorly. Volume may be under-reported due to the influence of Alternative Trading Systems (as discussed in the November PrefLetter), but I am biding my time before incorporating ATS volumes into the calculations, to see if the effect is transient or not.


Click for big

Compositions of the passive funds were discussed in the September, 2009, edition of PrefLetter.

Claymore has published NAV and distribution data (problems with the page in IE8 can be kludged by using compatibility view) for its exchange traded fund (CPD) and I have derived the following table:

CPD Return, 1- & 3-month, to May 31, 2010
Date NAV Distribution Return for Sub-Period Monthly Return
February 26, 2010 16.83      
March 26 16.64 0.21 +0.12% -0.96%
March 31, 2010 16.46 0.00 -1.08%
April 30 16.11     -2.13%
May 31, 2010 16.26     +0.93%
Quarterly Return -2.17%

Claymore currently holds $431,929,434 (advisor & common combined) in CPD assets, up about $3-million from the $428,556,482 reported last month and up about $58-million from the $373,729,364 reported at year-end. The monthly increase in AUM of about 0.77% is smaller than the total return of +0.93%, implying that the ETF experienced a small net redemption in May.

The DPS.UN NAV for May 26 has been published so we may calculate the approximate May returns.

DPS.UN NAV Return, May-ish 2010
Date NAV Distribution Return for sub-period Return for period
April 28, 2010 19.45      
May 26, 2010 19.34     -0.57%
Estimated April Ending Stub +0.06% *
Estimated May Ending Stub +0.74% **
Estimated May Return +0.22% ***
*CPD had a NAVPU of 16.12 on April 28 and 16.11 on April 30, hence the total return for the period for CPD was -0.06%. The return for DPS.UN in this period is presumed to be equal.
**CPD had a NAVPU of 16.14 on May 26 and 16.26 on May 31, hence the total return for the period for CPD was +0.74%. The return for DPS.UN in this period is presumed to be equal.
*** The estimated April return for DPS.UN’s NAV is therefore the product of three period returns, -0.57%, +0.06% and +0.74% to arrive at an estimate for the calendar month of +0.22%

Now, to see the DPS.UN quarterly NAV approximate return, we refer to the calculations for March and April:

DPS.UN NAV Returns, three-month-ish to end-May-ish, 2010
March-ish +1.47%
April-ish -2.47%
May-ish +0.22%
Three-months-ish -0.82%

Best & Worst Performers: May 2010

June 1st, 2010

These are total returns, with dividends presumed to have been reinvested at the bid price on the ex-date. The list has been restricted to issues in the HIMIPref™ indices.

May 2010
Issue Index DBRS Rating Monthly Performance Notes (“Now” means “May 31”)
BAM.PR.K Floater Pfd-2(low) -10.17%  
BAM.PR.B Floater Pfd-2(low) -9.56%  
BAM.PR.G FixFloat Pfd-2(low) -4.77% The third-best performer in April and a regular guest on this table – as have been all Floating Rate issues throughout the Credit Crunch! Strong Pair with BAM.PR.E
BAM.PR.E Ratchet Pfd-2(low) -3.08% Strong Pair with BAM.PR.G
IAG.PR.A Perpetual-Discount Pfd-2(high) -2.26% Now with a pre-tax bid-YTW of 6.52% based on a bid of 17.66 and a limitMaturity.
POW.PR.A Perpetual-Discount Pfd-2(high) +3.33% Now with a pre-tax bid-TTW of 6.37% based on a bid of 22.33 and a limitMaturity.
POW.PR.C Perpetual-Discount Pfd-2(high) +3.87% Now with a pre-tax bid-TTW of 6.38% based on a bid of 23.07 and a limitMaturity.
CIU.PR.A Perpetual-Discount Pfd-2(high) +4.20% Now with a pre-tax bid-TTW of 6.06% based on a bid of 19.12 and a limitMaturity.
CL.PR.B Perpetual-Discount Pfd-1(low) +4.36% Now with a pre-tax bid-TTW of 6.30% based on a bid of 24.78 and a limitMaturity.
ELF.PR.F Perpetual-Discount Pfd-2(low) +5.31% The worst performer in April, so this is merely bounce-back. Now with a pre-tax bid-YTW of 7.01% based on a bid of 19.25 and a limitMaturity.

There’s a crashing to earth of the Floating Rate sector!