Anna Katherine Barnett-Hart’s senior thesis has attracted some media interest, so I’ll highlight it here – since a kind soul on Financial Webring Forum went to the trouble of finding the link.
The title is The Story of the CDO Market Meltdown: An Empirical Analysis:
Collateralized debt obligations (CDOs) have been responsible for $542 billion in write-downs at financial institutions since the beginning of the credit crisis. In this paper, I conduct an empirical investigation into the causes of this adverse performance, looking specifically at asset-backed CDO’s (ABS CDO’s). Using novel, hand-collected data from 735 ABS CDO’s, I document several main findings. First, poor CDO performance was primarily a result of the inclusion of low quality collateral originated in 2006 and 2007 with exposure to the U.S. residential housing market. Second, CDO underwriters played an important role in determining CDO performance. Lastly, the failure of the credit ratings agencies to accurately assess the risk of CDO securities stemmed from an overreliance on computer models with imprecise inputs. Overall, my findings suggest that the problems in the CDO market were caused by a combination of poorly constructed CDOs, irresponsible underwriting practices, and flawed credit rating procedures.
I must admit that the phrase “irresponsible underwriting practices” caught my attention. Since when does or should the underwriter care? It’s up to the buyer to figure out just what he’s buying.
As far as the CRAs are concerned, John Hull’s work on the ratings has been previously reported on PrefBlog – he concluded:
It should be noted that a CDO created from the triple BBB tranches of ABSs is quite different from a CDO created from BBB bonds. This is true even when the BBB tranches have been chosen so that their probabilities of default and expected losses are consistent with their BBB rating. The reason is that the probability distribution of the loss from a BBB tranche is quite different from the probability distribution of the loss from a BBB bond.
…
The AAA ratings for Mezz ABS CDOs are much less defensible. Scenarios where all the underlying BBB tranches lose virtually all their principal are sufficiently probable that it is not reasonable to assign a AAA rating to even a quite thin senior tranche. The risks in Mezz ABS CDOs depend critically on a) the width of the underlying BBB tranches, b) the correlation between pools, c) the tail default correlation, and d) the relationship between the recovery rate and the default rate. An important point is that the BBB tranche of an ABS cannot be assumed to be similar to a BBB bond for the purposes of determining the risks in ABS CDO tranches.
In practice Mezz ABS CDOs accounted for about 3% of all mortgage securitizations. Our conclusion is therefore that the vast majority of the AAA ratings assigned to tranches created from mortgages were reasonable, but in a small minority of the cases they cannot be justified.
The distinction between Mezz ABSs and Mezz ABS CDOs must be borne firmly in mind when trying to understand this thing. The Mezz ABSs is the BBB (about) tranche of a pool of mortgages. A Mezz ABS CDO is another security that does not hold mortgages directly; it holds Mezz ABSs.
So anyway, back to the Barnett-Hart paper:
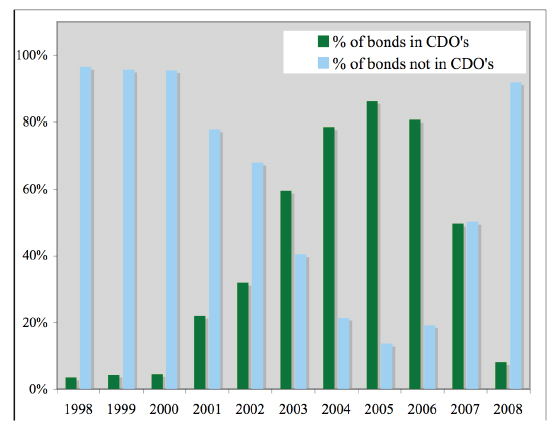
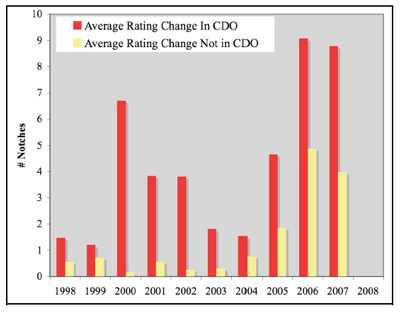
In response to the explosion in CDO issuance, the increased demand for subprime mezzanine bonds began to outpace their supply.12 Figure 2 shows the percentage of subprime bonds that were repackaged into CDOs, illustrating the drastic increase in subprime demand by CDOs. This surge in demand for subprime mezzanine bonds helped to push spreads down – so much so that the bond insurers and real estate investors that had traditionally held this risk were priced out of the market. The CDO managers that now purchased these mortgage bonds were often less stringent in their risk analysis than the previous investors, and willingly purchased bonds backed by ever-more exotic mortgage loans.13 Figure 3 looks specifically at the performance of the subprime collateral, comparing the rating downgrades of the subprime bonds that were in CDOs versus those that were not put in CDOs. Clearly, the bonds in the CDOs have performed worse, indicating that there might have been a degree of adverse selection in choosing the subprime bonds for CDOs14
Footnotes:
12: Deng et. al. (2008) find that the demand for subprime mezzanine bonds for CDOs was so great that it was a significant factor in causing a tightening in the subprime ABS-treasury spread prior to 2007.
13: A recent note by Adelson and Jacob (2008) argues that CDOs’ increasing demand for subprime bonds was the key event that fundamentally changed the market.
14: However, this result needs further investigation as it may be a result of the fact that the mezzanine tranches, most common in CDOs, have all performed the worst, or that the rating agencies had an incentive to monitor subprime bonds in CDOs more carefully, leading to a higher level of downgrades.
 Click for Big
Click for Big
Investors came to rely almost exclusively on ratings to assess CDO investments: in essence substituting a letter grade for their own due diligence.
Footnote: In a report to shareholders, UBS cites over-reliance on ratings as a cause of their massive write-downs, saying that their risk committee “relied on the AAA rating of certain subprime positions, although the CDOs were built from lower-rated tranches of RMBS. This appears to have been common across the industry. A comprehensive analysis of the portfolios may have indicated that the positions would not necessarily perform consistent with their ratings”(UBS 39).
With respect to the above footnote, remember that UBS is also the poster-child for insane leverage ratios.
In addition to the problems with the accuracy of the ratings, there was also the fact that the ratings themselves were not meaningful indicators for assessing portfolio risk. As Coval et. al. (2009) notes, credit ratings, “by design only provide an assessment of the risks of the security’s expected payoff, with no information regarding whether the security is particularly likely to default at the same time as there is a large scale decline in the stock market or that the economy is in recession.” 28 Furthermore, ratings are a static measure, designed to give a representation of expected losses at a certain point in time with given assumptions. It is not possible for a single rating to encompass all the information about the probability distribution that investors need to assess its risk. Dr. Clarida, an executive vice president at PIMCO, points out that, “distributions are complicated beasts – they have means, variances, skews, and tails that can be skinny or, more often, fat. Also – they have kurtosis, fourth moments, and transition probabilities.”29 Investors often overcame these limitations by looking at ratings history, filling in their missing information with data about the track record of defaults for a given rating. Since there was little historical data for CDOs, investors instead looked at corporate bond performance. However, as noted above, asset-backed ratings have proven to have very different default distributions than corporate bonds, leading to false assessments.
So the question becomes: who were these bozo investors?
While the investment banks earned what they thought to be “riskless” profits from CDOs, they were actually loading up on more CDO risk than they realized thanks to so-called “super senior” tranches, created in part to generate even higher-yielding AAA tranches for CDO investors. To manufacture a super senior tranche, the AAA portion of a CDO was chopped up into smaller AAA tiers, enabling the “subordinate” AAA tranche to yield more and the “super senior” AAA tranche to carry an extremely low level of credit risk. Many banks found it convenient to simply retain the super senior tranches, as the Basel Accords imposed only a small capital charge for AAA securities. In addition, a significant amount of super senior exposure was retained not by choice, but rather because underwriters had difficulty selling these bonds.
Footnote: Krahen and Wilde (2005) gave a warning to regulators in 2005 about the increasing number of banks retaining senior tranches, saying that: “To the extent that senior tranches absorb extreme systematic losses, banks should be encouraged to sell these tranches to outside investors. In the interest of financial system stability, these outside buyers of bank risk should not be financial intermediaries themselves. Only if this requirement is fulfilled will the bank and the financial system be hedged against systematic shocks. Since this is supposedly one of the macroeconomic objectives of regulators, one would expect that regulatory requirements stipulate the sale of senior tranches, rather than encouraging their retention.
Which simply goes to show: don’t ever take investment advice from the sell-side.
It also makes a strong argument against tranche retention: I suggest that instead, retention of underwritten securities be penalized by capital regulation; this will ensure that the investment banks only create what they can actually sell, rather than relying on in-house analysts who, to put it bluntly, aren’t worth very much.
I will also suggest – again! – that a clear delineation be made in the new capital rules between investment banks (who should be encouraged to trade stuff and penalized for holding it) and vanilla banks (who should be encouraged to hold stuff and penalized for trading it).