The Federal Reserve Bank of New York has released a paper by Todd Keister and James J. McAndrews titled Why Are Banks Holding So Many Excess Reserves?:
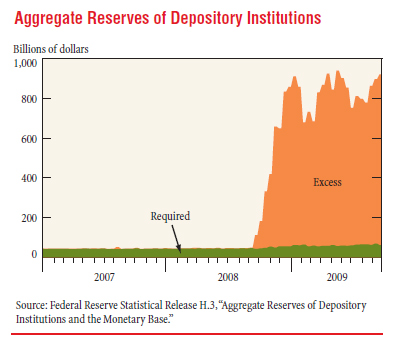
The buildup of reserves in the U.S. banking system during the financial crisis has fueled concerns that the Federal Reserve’s policies may have failed to stimulate the flow of credit in the economy: banks, it appears, are amassing funds rather than lending them out. However, a careful examination of the balance sheet effects of central bank actions shows that the high level of reserves is simply a by-product of the Fed’s new lending facilities and asset purchase programs. The total quantity of reserves in the banking system reflects the scale of the Fed’s policy initiatives, but conveys no information about the initiatives’ effects on bank lending or on the economy more broadly.
They quote a lot of commentary decrying the build-up of reserves, but state:
In this edition of Current Issues, we argue that the concerns about high levels of reserves are largely unwarranted. Using a series of simple examples, we show how central bank liquidity facilities and other credit programs create—essentially as a by-product—a large quantity of reserves. While the level of required reserves may change modestly with changes in bank lending behavior, the vast majority of the newly created reserves will end up being held as excess reserves regardless of how banks react to the new programs. In other words, the substantial buildup of reserves depicted in the chart reflects the large scale of the Federal Reserve’s policy initiatives, but says little or nothing about the programs’ effects on bank lending or on the economy more broadly.
One casual comment of interest is:
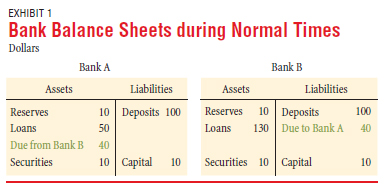
Note the important economic role of interbank lending in this example: it allows funds to flow to their most productive uses, regardless of which bank received the initial deposits.
This, presumably, is a justification for encouraging interbank lending in the BIS Capital Ratios (which allow one bank’s holdings of another bank’s paper to be risk-weighted according to the credit rating of the borrowing bank’s sovereign authority. I would dearly love to see this issue thoroughly discussed; to me, it seems to have had the effect of increasing contagion.
Anyway: in normal times, Bank A has lent to Bank B:
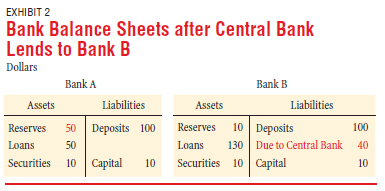
But in stressed times, the inter-bank market fails and the Fed lends to Bank B (via a credit to their reserve account), which repays Bank A by transfer of reserves:
The authors explain:
This simple example illustrates how a central bank’s extension of credit to banks during a financial crisis creates, as a by-product, a large quantity of excess reserves. Merely looking at the aggregate data on bank reserves might lead one to conclude that the central bank’s policy did nothing to promote bank lending, since all of the $40 lent by the central bank ended up being held as excess reserves. The example shows that this conclusion would be unwarranted. In fact, the central bank’s action was highly effective: it prevented Bank B from having to reduce its lending to firms and households by $40.
There are, as always, knock-on effects:
Actions by a central bank that change the quantity of reserves in the banking system also tend to change the level of interest rates. Traditionally, bank reserves did not earn any interest. If Bank A earns no interest on the reserves it is holding in Exhibit 2, it will have an incentive to lend out its excess reserves or to use them to buy other short-term assets. These activities will, in turn, decrease short-term market interest rates and hence may lead to an increase in inflationary pressures.
The Central Bank may therefore choose to sterilize its market action by selling interest-bearing bonds from its holdings to Bank A – or it can achieve a similar policy objective by paying interest on excess reserves.
The authors conclude:
We began this article by asking, Why are banks holding so many excess reserves? We then used a series of simple examples to answer this question in two steps. First, we showed that the liquidity facilities and other credit programs introduced by the Federal Reserve in response to the crisis have created, as a by-product, a large quantity of reserves in the banking system. Second, we showed that while the lending decisions and other activities of banks may result in small changes in the level of required reserves, the vast majority of the newly created reserves will end up being held as excess reserves. The dramatic buildup of excess reserves reflects the large scale of the Federal Reserve’s policy initiatives; it conveys no information about the effects of these initiatives on bank lending or on the level of economic activity.
We also discussed the importance of paying interest on reserves when the level of excess reserves is unusually high, as the Federal Reserve began to do in October 2008. Paying interest on reserves allows a central bank to maintain its influence over market interest rates irrespective of the quantity of reserves in the banking system. The central bank can then scale its policy initiatives according to conditions in the financial sector, while setting its target for the short-term interest rate in response to macroeconomic conditions. This ability to separate short-term interest rates from the quantity of reserves is particularly important during the recovery from a financial crisis. If inflationary pressures begin to appear while the crisis-related programs are still in place, the central bank can use its interest-on-reserves policy to raise interest rates without necessarily removing all of the newly created reserves.