Gareth Campbell writes an interesting essay on VoxEU, The railway mania: Not so great expectations?, in which he uses the British Railway Mania of the 1840’s to consider the problem of deciding ex ante whether there is a bubble in asset prices:
Can financial crises be averted by identifying and dealing with overpriced assets before they cause instability? This column argues that during the British Railway Mania of the 1840s, railway shares were not obviously overpriced, even at the market peak, but prices still fell dramatically. This suggests that extreme asset price reversals can be difficult to forecast and prevent ex ante, and the financial system always needs to be prepared for substantial price declines.
Assiduous Readers will be well aware of my view that market timing is difficult to do … really, really, really difficult to do … impossible. Comparing one share in a bank to another share in another bank is relatively easy. Comparing one share in a bank to cash … can’t be done.
This concept has become important in that there is a move afoot to give central bankers a mandate to time the markets:
The instability that has followed the bursting of the housing bubble has led to a renewed discussion about what can be done to prevent the recurrence of financial crises. Cecchetti et. al (2000) have suggested that monetary policy should be tightened when regulators believe assets are overpriced, in an attempt to deflate a suspected bubble before it bursts. However, Bernanke (2002) and Mishkin (2008) have argued that this proposal is not feasible, partly because mispricing is difficult to identify ex ante. Several pieces of academic research have provided a justification for this position by suggesting that assets were not obviously mispriced prior to market crashes in certain historical episodes, such as the Tulip Mania of 1636 (Garber, 2001), the German stock market boom of 1927 (Voth, 2003), and before the Wall Street Crash of 1929 (Donaldson and Kamstra, 1996).
It’s an interesting piece and ties in with my fears regarding the too-popular dividend growth magic formula, that I fear will increasingly lead to unwise decisions being made regarding dividend payouts and lead to very crowded trades when the hard decisions finally become effective.
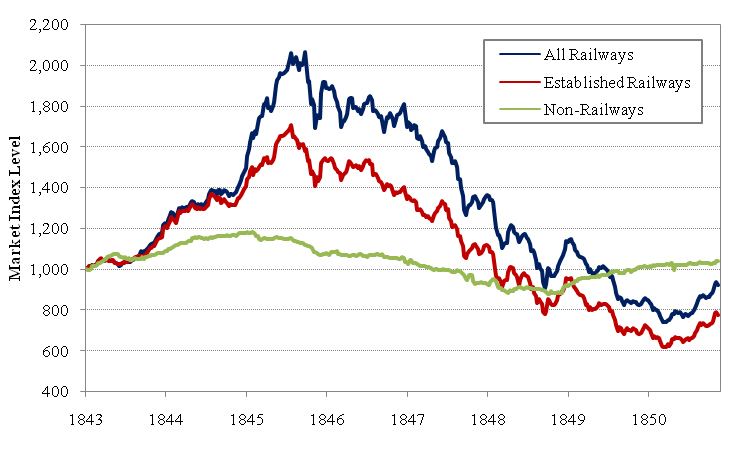
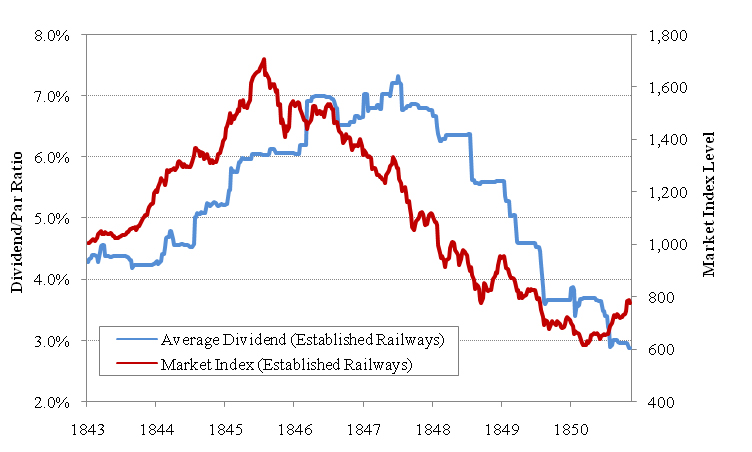
First he shows the market indices for All Railways, Established Railways and Non-Railways:
 Click for big
Then he shows how dividends rose and fell through the period:
 Click for big
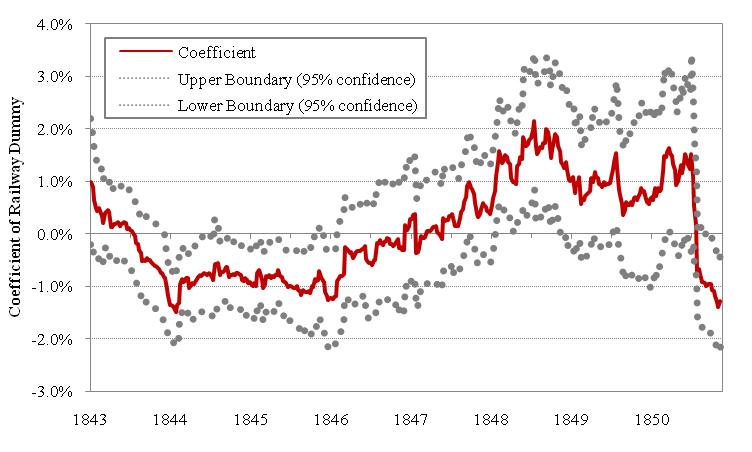
Then he compares the dividend yield on railways with non-railways
This involved performing a regression for each week of the sample using the dividend yield of a company as the dependent variable and using a dummy variable, which equalled 1 if a company was a railway, as the independent variable. The coefficient of the railway dummy in each week is plotted with ±1.96 standard errors in Figure 3.
 Click for big
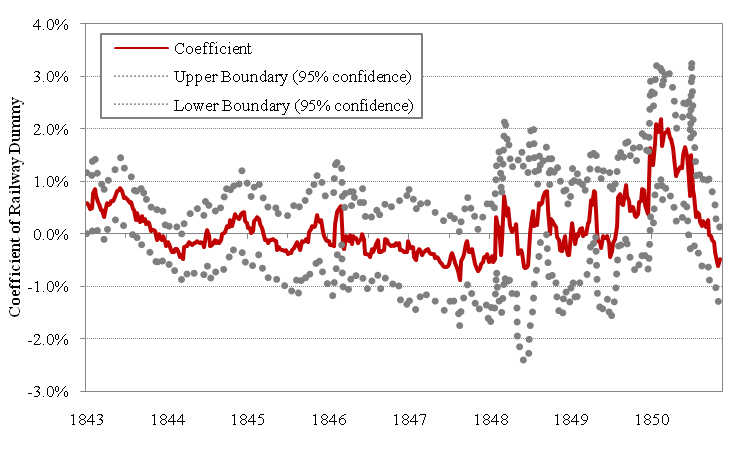
and finally:
I have also extended the analysis of the overpricing or underpricing of railway shares by including as independent variables the dividend growth that the company went on to experience during the next three years. After controlling for this growth, the apparent overpricing of the railways during the boom in prices is almost entirely eliminated. The railways appear to have had a significantly lower dividend yield, after accounting for short-term dividend growth, on just two weeks during the entire period, as shown in Figure 4.
 Click for big
He concludes:
Regulators may be able to effectively intervene if they have greater foresight than other market participants but, as Bernanke (2002) has argued, this is a very questionable assumption. Without perfect foresight by regulators, which would allow restrictions to be imposed only when necessary, there would have to be tighter regulation in all periods, and the costs of such restrictions would need to be carefully weighed against the potential benefits.
It may be better to focus efforts on ensuring stability when the next asset price bust does occur. More attention should be directed to the consequences of sustained declines in asset prices, as capital requirements which are based on short-term market risk may provide inadequate protection against persistent and longer-term falls. It may be useful to introduce some long-term stress testing, which would examine the consequences if the largest peak-to-trough asset price movements in history were to be repeated. If the financial system could not endure some of these historical experiences, then it may need to embrace tighter regulation or restructuring.
I continue to like the idea of dynamic provisioning, in which a bank’s “recent” assets would carry a higher risk weight than “old” assets, penalizing recent growth to a predictable degree (in addition to the unrelated idea of penalizing excessive size, inter alia). Dynamic provisioning has, to some extent of equivalency, been implemented by the FDIC.
I like those ideas a LOT more than telling Bernanke that the non-bonusable nature of his position makes him an infallible market timer.