I am pleased to announce that the Seminar on SplitShares has been accredited for four hours of IDA Continuing Education – Professional Development.

I am pleased to announce that the Seminar on SplitShares has been accredited for four hours of IDA Continuing Education – Professional Development.
Holy smokes, how ’bout them floaters, eh? I’ll have to write a follow-up to my article … maybe give another another seminar.
Volume continued to be elevated on what was supposed to be a sleepy day, given the US holiday, assisted by large blocks in SLF issues, which went ex-Dividend today.
| HIMIPref™ Preferred Indices These values reflect the December 2008 revision of the HIMIPref™ Indices Values are provisional and are finalized monthly |
|||||||
| Index | Mean Current Yield (at bid) |
Median YTW |
Median Average Trading Value |
Median Mod Dur (YTW) |
Issues | Day’s Perf. | Index Value |
| Ratchet | 0.00 % | 0.00 % | 0 | 0.00 | 0 | 5.9595 % | 1,234.2 |
| FixedFloater | 0.00 % | 0.00 % | 0 | 0.00 | 0 | 5.9595 % | 1,996.0 |
| Floater | 3.05 % | 3.70 % | 82,829 | 18.01 | 3 | 5.9595 % | 1,541.9 |
| OpRet | 5.03 % | 3.76 % | 128,196 | 0.98 | 15 | 0.0344 % | 2,160.3 |
| SplitShare | 5.94 % | 5.75 % | 56,150 | 4.23 | 3 | -0.1555 % | 1,824.3 |
| Interest-Bearing | 6.00 % | 7.17 % | 26,403 | 0.58 | 1 | -0.1996 % | 1,987.2 |
| Perpetual-Premium | 0.00 % | 0.00 % | 0 | 0.00 | 0 | 0.1175 % | 1,715.8 |
| Perpetual-Discount | 6.38 % | 6.41 % | 157,330 | 13.31 | 71 | 0.1175 % | 1,580.2 |
| FixedReset | 5.73 % | 4.97 % | 489,315 | 4.46 | 37 | -0.1954 % | 1,979.3 |
| Performance Highlights | |||
| Issue | Index | Change | Notes |
| MFC.PR.C | Perpetual-Discount | -2.08 % | YTW SCENARIO Maturity Type : Limit Maturity Maturity Date : 2039-05-25 Maturity Price : 17.87 Evaluated at bid price : 17.87 Bid-YTW : 6.31 % |
| NA.PR.P | FixedReset | -1.81 % | YTW SCENARIO Maturity Type : Call Maturity Date : 2014-03-17 Maturity Price : 25.00 Evaluated at bid price : 26.61 Bid-YTW : 5.16 % |
| ELF.PR.G | Perpetual-Discount | -1.80 % | YTW SCENARIO Maturity Type : Limit Maturity Maturity Date : 2039-05-25 Maturity Price : 16.35 Evaluated at bid price : 16.35 Bid-YTW : 7.39 % |
| NA.PR.O | FixedReset | -1.64 % | YTW SCENARIO Maturity Type : Call Maturity Date : 2014-03-17 Maturity Price : 25.00 Evaluated at bid price : 26.35 Bid-YTW : 5.39 % |
| PWF.PR.E | Perpetual-Discount | -1.51 % | YTW SCENARIO Maturity Type : Limit Maturity Maturity Date : 2039-05-25 Maturity Price : 20.91 Evaluated at bid price : 20.91 Bid-YTW : 6.67 % |
| RY.PR.B | Perpetual-Discount | -1.47 % | YTW SCENARIO Maturity Type : Limit Maturity Maturity Date : 2039-05-25 Maturity Price : 18.80 Evaluated at bid price : 18.80 Bid-YTW : 6.30 % |
| RY.PR.P | FixedReset | -1.31 % | YTW SCENARIO Maturity Type : Call Maturity Date : 2014-03-26 Maturity Price : 25.00 Evaluated at bid price : 26.40 Bid-YTW : 4.97 % |
| MFC.PR.D | FixedReset | -1.23 % | YTW SCENARIO Maturity Type : Call Maturity Date : 2014-07-19 Maturity Price : 25.00 Evaluated at bid price : 26.59 Bid-YTW : 5.12 % |
| IGM.PR.A | OpRet | -1.16 % | YTW SCENARIO Maturity Type : Call Maturity Date : 2009-07-30 Maturity Price : 26.00 Evaluated at bid price : 26.39 Bid-YTW : 1.77 % |
| PWF.PR.I | Perpetual-Discount | 1.45 % | YTW SCENARIO Maturity Type : Limit Maturity Maturity Date : 2039-05-25 Maturity Price : 22.91 Evaluated at bid price : 23.15 Bid-YTW : 6.55 % |
| PWF.PR.M | FixedReset | 1.86 % | YTW SCENARIO Maturity Type : Call Maturity Date : 2014-03-02 Maturity Price : 25.00 Evaluated at bid price : 26.30 Bid-YTW : 4.90 % |
| GWO.PR.I | Perpetual-Discount | 1.92 % | YTW SCENARIO Maturity Type : Limit Maturity Maturity Date : 2039-05-25 Maturity Price : 17.56 Evaluated at bid price : 17.56 Bid-YTW : 6.53 % |
| BAM.PR.K | Floater | 2.04 % | YTW SCENARIO Maturity Type : Limit Maturity Maturity Date : 2039-05-25 Maturity Price : 10.51 Evaluated at bid price : 10.51 Bid-YTW : 3.79 % |
| BAM.PR.B | Floater | 4.78 % | YTW SCENARIO Maturity Type : Limit Maturity Maturity Date : 2039-05-25 Maturity Price : 10.75 Evaluated at bid price : 10.75 Bid-YTW : 3.70 % |
| TRI.PR.B | Floater | 9.24 % | Light volume but a significant move none-the-less! Traded 1,450 shares in a range of 18.00-19.00 before closing at 17.50-18.99 (!), 3×10. YTW SCENARIO Maturity Type : Limit Maturity Maturity Date : 2039-05-25 Maturity Price : 17.50 Evaluated at bid price : 17.50 Bid-YTW : 2.26 % |
| Volume Highlights | |||
| Issue | Index | Shares Traded |
Notes |
| SLF.PR.E | Perpetual-Discount | 213,800 | National crossed three blocks, one of 100,000 shares, two of 50,000 shares, all at 17.00. YTW SCENARIO Maturity Type : Limit Maturity Maturity Date : 2039-05-25 Maturity Price : 17.00 Evaluated at bid price : 17.00 Bid-YTW : 6.62 % |
| RY.PR.I | FixedReset | 106,822 | Commission Direct (who?) bought 10,200 from TD at 24.40, and another 15,600 from anonymous at 24.35. YTW SCENARIO Maturity Type : Limit Maturity Maturity Date : 2039-05-25 Maturity Price : 24.31 Evaluated at bid price : 24.36 Bid-YTW : 4.35 % |
| SLF.PR.D | Perpetual-Discount | 100,362 | National Bank sold 11,000 to HSBC, 17,700 to CIBC, 32,300 to Nesbitt and another 10,400 to Nesbitt, all at 17.00. YTW SCENARIO Maturity Type : Limit Maturity Maturity Date : 2039-05-25 Maturity Price : 16.93 Evaluated at bid price : 16.93 Bid-YTW : 6.58 % |
| SLF.PR.F | FixedReset | 75,365 | Nesbitt crossed 22,100 at 25.78. YTW SCENARIO Maturity Type : Call Maturity Date : 2014-07-30 Maturity Price : 25.00 Evaluated at bid price : 25.77 Bid-YTW : 5.36 % |
| MFC.PR.D | FixedReset | 72,596 | YTW SCENARIO Maturity Type : Call Maturity Date : 2014-07-19 Maturity Price : 25.00 Evaluated at bid price : 26.59 Bid-YTW : 5.12 % |
| RY.PR.G | Perpetual-Discount | 47,200 | YTW SCENARIO Maturity Type : Limit Maturity Maturity Date : 2039-05-25 Maturity Price : 18.18 Evaluated at bid price : 18.18 Bid-YTW : 6.24 % |
| There were 43 other index-included issues trading in excess of 10,000 shares. | |||
Manulife Financial has announced:
a Canadian public offering of Non-cumulative Rate Reset Class 1 Shares Series 1 (“Series 1 Preferred Shares”). Manulife will issue eight million Series 1 Preferred Shares priced at $25 per share to raise gross proceeds of $200 million. The offering will be underwritten by a syndicate of investment dealers led by Scotia Capital Inc. and RBC Dominion Securities Inc. and is anticipated to qualify as Tier 1 capital for Manulife. The expected closing date for the offering is June 3, 2009. Manulife has also granted the underwriters an option, exercisable in whole or in part at any time up to 48 hours prior to closing, to purchase up to an additional two million Series 1 Preferred Shares. The maximum gross proceeds raised under the offering will be $250 million should this option be exercised in full. Manulife intends to file a prospectus supplement to its May 8, 2009 amended and restated base shelf prospectus in respect of this issue.
Holders of the Series 1 Preferred Shares will be entitled to receive a non-cumulative quarterly fixed dividend yielding 5.60% annually, as and when declared by the Board of Directors of Manulife, for the initial period ending September 19, 2014. Thereafter, the dividend rate will be reset every five years at a rate equal to the 5-year Government of Canada bond yield plus 3.23%.Holders of Series 1 Preferred Shares will have the right, at their option, to convert their shares into Non-cumulative Rate Reset Class 1 Shares Series 2 (“Series 2 Preferred Shares”), subject to certain conditions, on September 19, 2014 and on September 19 every five years thereafter. Holders of the Series 2 Preferred Shares will be entitled to receive non-cumulative quarterly floating dividends, as and when declared by the Board of Directors of Manulife, at a rate equal to the three-month Government of Canada Treasury Bill yield plus 3.23%.
Approximately half of the net proceeds from the offering will be applied to reduce amounts outstanding under Manulife’s credit facility with Canadian chartered banks and the balance of the net proceeds will be utilized for general corporate purposes.
The first dividend is payable September 19 for $0.41425 based on a June 3 closing … perhaps not as enormously fat as some of us might like, but fat enough to be worth marking the calendars.
What a difference a quarter makes, eh? This issue closes almost exactly three months after MFC.PR.D closed: same structure, 6.60%+456.
Update: I am advised that the deal size has been increased to 14-million shares (=$350-million) with no greenshoe.
Mikhail Chernov & Philippe Mueller: The Term Structure of Inflation Expectations:
The ten-year inflation premium declines from six to zero per cent during the post-monetary-experiment period. This decline suggests that long-run inflation expectations became more stable over time. Further, we reestimate our model every quarter and find that the long-run expectations have declined over time from 6% to 2%. The inflation persistence declined and the term structure of inflation expectations became flat over time. This evidence suggests that monetary policy became better anchored.
One implication of anchored inflation expectations is that it should be easier to forecast inflation and yields. Consistent with this prediction, we find that the model that incorporates both yields nd surveys dominates in out-of-sample forecasting of both inflation and yields. These results lead us to conclude that information in surveys is extremely important for establishing the links between inflation expectations and yields.
Figure 4 shows the time-series of the inflation expectations at multiple horizons. These expectations are computed from AO. In contrast to the survey forecasts in Figure 1, these objective, or marginal, expectations can be computed each period at any horizon.
The term structure effects are pronounced. The inflation curve becomes inverted in 1973, right before the recession, and continues to be inverted until early 1982. This period coincides with the unstable period of monetary policy during the Burns and Miller chairmanship of the US Federal Bank and the monetary policy experiment under Volcker’s chairmanship. The curve became inverted again briefly in the early part of Greenspan’s tenure from 1987 to 1991. afterwards, it had a normal, nearly flat, shape.
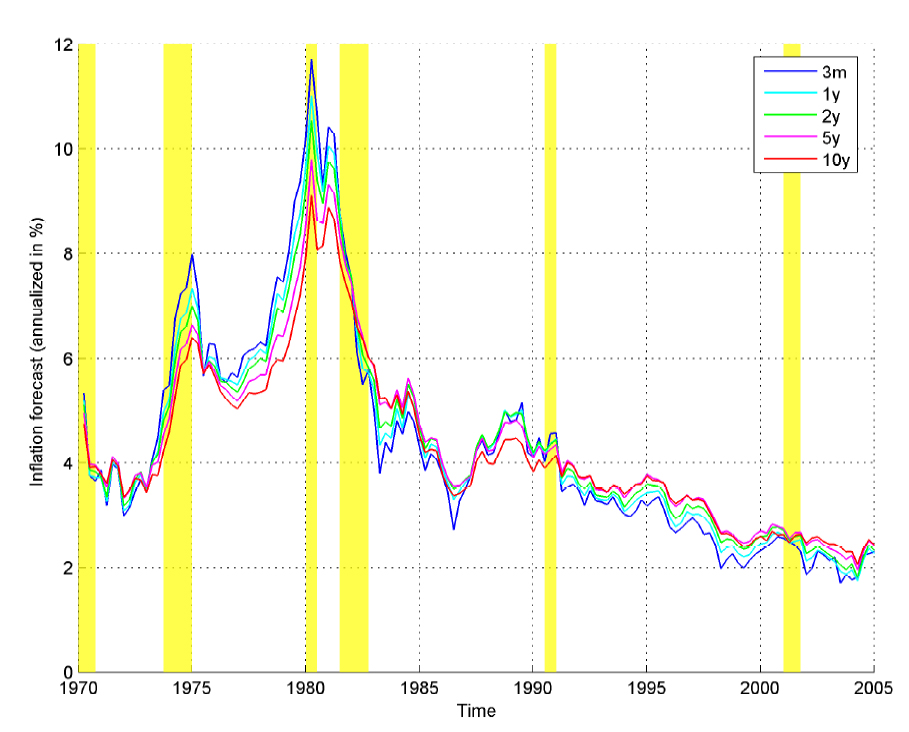
The out-of-sample analysis of the model suggests that monetary policy became more effective over time. The long-run expectations are anchored at about 2%. The term structure of inflation expectations has flattened out over time. This suggests that the arrival of new data does not affect long-run expectations much, perhaps because the monetary policy is expected to address all short term fluctuations successfully.
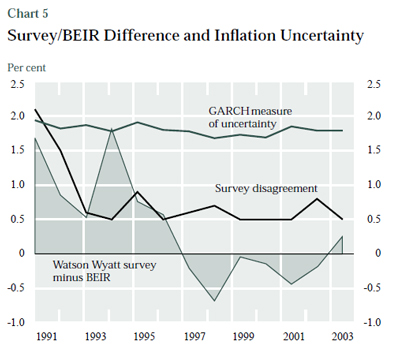
Christopher Reid, Frédéric Dion and Ian Christensen, Real Return Bonds: Monetary Policy Credibility and Short-Term Inflation Forecasting, Bank of Canada Review, Autumn 2004:
Chart 5 shows two proxies of long-run inflation uncertainty. The first is a measure of the disagreement among forecasters who responded to the Watson Wyatt survey, calculated as the difference between the upper and lower quartiles of reported inflation expectations at the 4- to 14-year horizon. The second measure is inflation uncertainty over a 5-year forecast horizon derived from a GARCH model developed by Crawford and Kasumovich (1996).
Côté et al. (1996) suggest that the increase in the BEIR [Break-Even Inflation Rate, Nominals less RRBs] in 1994, which was not accompanied by a similar move in survey measures, may reflect an increase in the inflation-risk premium. If changes in the premium for inflation uncertainty are an important factor in explaining movements in the BEIR, then sharp movements in these proxies should be associated with similar movements in the BEIR. Yet both measures fail to indicate a rise in inflation uncertainty in 1994 or a significant decline in 1997. Crawford and Kasumovich’s measure of inflation uncertainty fell dramatically during the 1980s but has been relatively stable since 1992. Similarly, survey disagreement fell between 1991 and 1994 but was relatively stable afterwards. The simplest explanation is that deviations of the BEIR from survey measures of inflation expectations are the result of some phenomenon other than changes in uncertainty regarding inflation.
CCS.PR.D, the new FixedReset 7.25%+521 announced May 6, had an entirely respectable market debut, trading 539,155 shares in a range of 25.30-69 before closing at 25.30-35, 7×2.
that it has closed its bought deal offering (the “Offering”) of $100 million of Non-Cumulative 5-Year Rate Reset Class E Preference Shares, Series D (the “Series D Preference Shares”) underwritten by a syndicate of underwriters co-led by Scotia Capital Inc. and TD Securities Inc. and including BMO Nesbitt Burns Inc., RBC Dominion Securities Inc., Desjardins Securities Inc., National Bank Financial Inc., HSBC Securities (Canada) Inc., Blackmont Capital Inc., Dundee Securities Corporation and Industrial Alliance Securities Inc. (collectively, the “Underwriters”).
The Company entered into an underwriting agreement dated as of May 7, 2009 with the Underwriters pursuant to which the Underwriters agreed to purchase from Co-operators General and sell to the public 4,000,000 Series D Preference Shares at a price of $25.00 per Series D Preference Share for gross proceeds to the Company of $100,000,000.
The greenshoe was for 600,000 shares and it looks like it was not exercised.
CCS.PR.D will be tracked by HIMIPref™, but is relegated to the “Scraps” index on credit concerns.
Every now and then an Assiduous Reader writes in and asks whether the banks will be purchasing thier deeply discounted prefs on the market to save themselves a few bucks …. and every now and then I have to resort to handwaving about leverage, Tier 1 capital, OSFI permissions and all that.
It is something of a relief to see that similar questions are being asked in New York:
The state, without bothering to take advantage of market interest rates, paid face value for auction-rate bonds in February and March when the same debt traded at discounts of as much as 40 percent, Municipal Securities Rulemaking Board prices show. The securities, maturing in 2011 and 2022, are part of $1.13 billion of auction-rate debt New York has remaining, which it might be able to repurchase at a discount of 10 percent, according to Kevin O’Connor, a managing director at New York- based Secondmarket.com.
…
“There are legal and investor relations issues involved, and we are reviewing these issues,” said Jeffrey Gordon a spokesman for the Division of Budget, in an e-mail.
…
Anticipation that government issuers will pay face value is keeping prices higher than they would be otherwise, said O’Connor, a former banker who helped start the auction-rate bond trading desk at New York-based JPMorgan Chase & Co. in 2000.
…
The 2011 and 2022 New York bonds’ indentures, or documents that spell out the rights of issuers and investors, say “the state may from time to time purchase bonds” at the prevailing price and retire them.There’s no prohibition on local governments buying their bonds in the open market, said Troy Kilpatrick, a managing director at Bank of New York Mellon in Pittsburgh, a trustee of auction-rate bonds. “You just don’t see a lot of it happen.”
My guess? Bureaucratic inertia. Remember, this is the financial world we’re talking about, folks. Today was a short trading day because Monday is a holiday – a feature of the bond market that has irritated me since I first calculated a yield.
The Canadian Life Insurers Assurance Facility (whereby insurers can get a government guarantee for their debt in exchange for a fee) is officially under way.
The Fed has published as special rule allowing TARP preferreds to be part of Tier 1 Capital (as well as sub-debt, for smaller banks who were caught in a legalistic tangle and couldn’t issue preferred). There were problems with the dividend step-up and the issuance limits:
In particular, the Senior Perpetual Preferred Stock issued under the CPP has an initial dividend rate of five percent per annum, which will increase to nine percent per annum five years after issuance. In addition, following the redemption of all the Senior Perpetual Preferred Stock issued under the CPP, a banking organization will have the right to repurchase any other equity security of the organization (such as warrants or equity securities acquired through the exercise of such warrants) held by Treasury.
In the preamble to the interim rule, the Board recognized that some of the features of the Senior Perpetual Preferred Stock issued under the CPP if included in preferred stock issued to private investors would render the preferred stock ineligible for tier 1 capital treatment or limit its inclusion in tier 1 capital under the Board’s capital guidelines for bank holding companies. Bank holding companies generally may not include in tier 1 capital perpetual preferred stock (whether cumulative or noncumulative) that has a dividend rate step-up. Furthermore, the amount of eligible cumulative perpetual preferred stock that a bank holding company may include in its tier 1 capital generally is subject to a 25 percent limit.
In part of his continuing plan to make Dubai the world’s financial centre, Geithner’s about to unveil regulated pay scales:
Treasury Secretary Timothy Geithner called for major changes in compensation practices at financial companies and said the Obama administration’s plan to help realign pay with performance will be rolled out by mid-June.
“I don’t think we can go back to the way it was,” Geithner said in an interview on Bloomberg Television’s “Political Capital with Al Hunt,” to be aired tonight and over the weekend. “We’re going to need to see very, very substantial change.”
He said that Wall Street’s pay practices, which include big year-end bonuses, encouraged excessive risk-taking and helped precipitate the financial crisis. What’s needed is a set of broad standards that financial supervisors can use to make sure that doesn’t happen again, he said.
Typical penis-envy: he can’t negotiate worth a damn himself:
While 17 financial institutions have repaid TARP funds, only two have come to terms with the U.S. on the value of the rights to buy stock that taxpayers received for the risk of recapitalizing the industry. The first was Old National Bancorp in Evansville, Indiana, which gave the Treasury Department $1.2 million last week for warrants that may have been worth $5.81 million, according to the data.
If Geithner makes the same deal for all companies in the rescue program, lenders may walk away with 80 percent of profits taxpayers might have claimed.
All this interference might lead to the death of dealers. There is no reason why a hedge fund can’t make it known that it is willing to call a market on any security it pleases; and creating a trading desk organized on the same principles as an institutional desk. Dealers will be left trading governments. Hell, I’ve been trying to organize such a hedge fund for preferred shares for years; sadly, the pension funds I’ve talked to have advised me that one can’t make any money trading preferred shares as principal.
However, increased importance of hedge funds will make the insurers happy:
The cost of insuring hedge funds against negligence has risen as much as 20 percent in the past six months after Lehman Brothers Holdings Inc.’s bankruptcy and Bernard Madoff’s Ponzi scheme increased the threat of lawsuits.
A fund manager with $200 million of assets running a “straightforward” strategy is typically paying as much as $60,000 a year for $5 million of coverage, up from $50,000 at the end 2008, said Brian Horwell, director of professional risks at London-based Miller Insurance Services Ltd.
The FDIC has approved a proposal to increase the insurance premia charged to banks:
On October 7, 2008, the FDIC established a Restoration Plan for the DIF.2 The Restoration Plan called for the FDIC to set assessment rates such that the reserve ratio would return to 1.15 percent within five years. The plan also required the FDIC to update its loss and income projections for the fund and, if needed to ensure that the fund reserve ratio reached 1.15 percent within five years, increase assessment rates. The FDIC amended the Restoration Plan on February 27, 2009, and extended the time within which the reserve ratio must be returned to 1.15 percent from five years to seven years due to extraordinary circumstances.3 The FDIC also adopted a final rule (the assessments final rule) that, among other things, set quarterly initial base assessment rates at 12 to 45 basis points beginning in the second quarter of 2009.4 However, given the FDIC’s estimated losses from projected institution failures, these assessment rates will not be sufficient to return the fund reserve ratio to 1.15 percent within seven years and are unlikely to prevent the DIF fund balance and reserve ratio from falling to near zero or becoming negative in 2009.
The Designated Reserve Ratio is defined as the reserve fund size divided by insured deposits (which, by the way, makes the charging of premia on assets less Tier 1 capital a little suspicious; they should charge insurance premia only on what they’re insuring).
One may note that back here in Canada:
million.We increased our provision for insurance losses by $50 million to $650 million, a move that reflects CDIC’s increasing insurance risk. This provision, combined with retained earnings, resulted in our ex ante funding reaching $1.6 billion as at March 31, 2008. This represents 35 basis points of insured deposits, below our target range of 40 to 50 basis points.
Well, it’s a good thing our bankers are so smart, that’s all I can say!
PerpetualDiscounts continued their ascent on continued elevated – albeit declining, probably a knock-on effect from the short trading day in the US – volume, while FixedResets were basically unchanged.
| HIMIPref™ Preferred Indices These values reflect the December 2008 revision of the HIMIPref™ Indices Values are provisional and are finalized monthly |
|||||||
| Index | Mean Current Yield (at bid) |
Median YTW |
Median Average Trading Value |
Median Mod Dur (YTW) |
Issues | Day’s Perf. | Index Value |
| Ratchet | 0.00 % | 0.00 % | 0 | 0.00 | 0 | -0.8941 % | 1,164.8 |
| FixedFloater | 0.00 % | 0.00 % | 0 | 0.00 | 0 | -0.8941 % | 1,883.7 |
| Floater | 3.23 % | 3.86 % | 85,747 | 17.66 | 3 | -0.8941 % | 1,455.1 |
| OpRet | 5.04 % | 3.75 % | 128,492 | 2.58 | 15 | 0.0688 % | 2,159.5 |
| SplitShare | 5.93 % | 5.64 % | 55,854 | 4.24 | 3 | -0.1708 % | 1,827.1 |
| Interest-Bearing | 5.99 % | 6.73 % | 25,849 | 0.59 | 1 | 0.0000 % | 1,991.2 |
| Perpetual-Premium | 0.00 % | 0.00 % | 0 | 0.00 | 0 | 0.2222 % | 1,713.8 |
| Perpetual-Discount | 6.38 % | 6.43 % | 159,346 | 13.29 | 71 | 0.2222 % | 1,578.4 |
| FixedReset | 5.72 % | 4.87 % | 496,545 | 4.49 | 37 | -0.0021 % | 1,983.2 |
| Performance Highlights | |||
| Issue | Index | Change | Notes |
| TRI.PR.B | Floater | -2.97 % | YTW SCENARIO Maturity Type : Limit Maturity Maturity Date : 2039-05-22 Maturity Price : 16.02 Evaluated at bid price : 16.02 Bid-YTW : 2.47 % |
| NA.PR.M | Perpetual-Discount | -1.26 % | YTW SCENARIO Maturity Type : Limit Maturity Maturity Date : 2039-05-22 Maturity Price : 23.34 Evaluated at bid price : 23.51 Bid-YTW : 6.43 % |
| BAM.PR.I | OpRet | -1.11 % | YTW SCENARIO Maturity Type : Soft Maturity Maturity Date : 2013-12-30 Maturity Price : 25.00 Evaluated at bid price : 24.01 Bid-YTW : 6.76 % |
| CU.PR.A | Perpetual-Discount | -1.04 % | YTW SCENARIO Maturity Type : Limit Maturity Maturity Date : 2039-05-22 Maturity Price : 23.46 Evaluated at bid price : 23.75 Bid-YTW : 6.12 % |
| TD.PR.G | FixedReset | -1.04 % | YTW SCENARIO Maturity Type : Call Maturity Date : 2014-05-30 Maturity Price : 25.00 Evaluated at bid price : 26.73 Bid-YTW : 4.81 % |
| BNS.PR.J | Perpetual-Discount | -1.01 % | YTW SCENARIO Maturity Type : Limit Maturity Maturity Date : 2039-05-22 Maturity Price : 21.63 Evaluated at bid price : 21.63 Bid-YTW : 6.14 % |
| HSB.PR.C | Perpetual-Discount | -1.01 % | YTW SCENARIO Maturity Type : Limit Maturity Maturity Date : 2039-05-22 Maturity Price : 19.70 Evaluated at bid price : 19.70 Bid-YTW : 6.59 % |
| BNS.PR.Q | FixedReset | 1.03 % | YTW SCENARIO Maturity Type : Limit Maturity Maturity Date : 2039-05-22 Maturity Price : 24.50 Evaluated at bid price : 24.55 Bid-YTW : 4.12 % |
| CIU.PR.A | Perpetual-Discount | 1.07 % | YTW SCENARIO Maturity Type : Limit Maturity Maturity Date : 2039-05-22 Maturity Price : 18.90 Evaluated at bid price : 18.90 Bid-YTW : 6.12 % |
| SLF.PR.A | Perpetual-Discount | 1.11 % | YTW SCENARIO Maturity Type : Limit Maturity Maturity Date : 2039-05-22 Maturity Price : 18.16 Evaluated at bid price : 18.16 Bid-YTW : 6.67 % |
| CM.PR.P | Perpetual-Discount | 1.13 % | YTW SCENARIO Maturity Type : Limit Maturity Maturity Date : 2039-05-22 Maturity Price : 21.55 Evaluated at bid price : 21.55 Bid-YTW : 6.46 % |
| PWF.PR.J | OpRet | 1.14 % | YTW SCENARIO Maturity Type : Soft Maturity Maturity Date : 2013-07-30 Maturity Price : 25.00 Evaluated at bid price : 25.70 Bid-YTW : 4.06 % |
| PWF.PR.L | Perpetual-Discount | 1.16 % | YTW SCENARIO Maturity Type : Limit Maturity Maturity Date : 2039-05-22 Maturity Price : 19.21 Evaluated at bid price : 19.21 Bid-YTW : 6.72 % |
| BAM.PR.K | Floater | 1.48 % | YTW SCENARIO Maturity Type : Limit Maturity Maturity Date : 2039-05-22 Maturity Price : 10.30 Evaluated at bid price : 10.30 Bid-YTW : 3.86 % |
| CM.PR.G | Perpetual-Discount | 1.50 % | YTW SCENARIO Maturity Type : Limit Maturity Maturity Date : 2039-05-22 Maturity Price : 20.31 Evaluated at bid price : 20.31 Bid-YTW : 6.73 % |
| CM.PR.H | Perpetual-Discount | 1.55 % | YTW SCENARIO Maturity Type : Limit Maturity Maturity Date : 2039-05-22 Maturity Price : 19.00 Evaluated at bid price : 19.00 Bid-YTW : 6.39 % |
| CM.PR.E | Perpetual-Discount | 1.78 % | YTW SCENARIO Maturity Type : Limit Maturity Maturity Date : 2039-05-22 Maturity Price : 21.16 Evaluated at bid price : 21.16 Bid-YTW : 6.70 % |
| MFC.PR.B | Perpetual-Discount | 1.81 % | YTW SCENARIO Maturity Type : Limit Maturity Maturity Date : 2039-05-22 Maturity Price : 19.08 Evaluated at bid price : 19.08 Bid-YTW : 6.22 % |
| MFC.PR.C | Perpetual-Discount | 2.01 % | YTW SCENARIO Maturity Type : Limit Maturity Maturity Date : 2039-05-22 Maturity Price : 18.25 Evaluated at bid price : 18.25 Bid-YTW : 6.18 % |
| GWO.PR.G | Perpetual-Discount | 2.24 % | YTW SCENARIO Maturity Type : Limit Maturity Maturity Date : 2039-05-22 Maturity Price : 20.51 Evaluated at bid price : 20.51 Bid-YTW : 6.46 % |
| Volume Highlights | |||
| Issue | Index | Shares Traded |
Notes |
| SLF.PR.E | Perpetual-Discount | 205,784 | National Bank crossed 200,000 at 17.30. YTW SCENARIO Maturity Type : Limit Maturity Maturity Date : 2039-05-22 Maturity Price : 17.16 Evaluated at bid price : 17.16 Bid-YTW : 6.68 % |
| TD.PR.G | FixedReset | 120,330 | TD crossed 109,700 at 26.80. YTW SCENARIO Maturity Type : Call Maturity Date : 2014-05-30 Maturity Price : 25.00 Evaluated at bid price : 26.73 Bid-YTW : 4.81 % |
| SLF.PR.F | FixedReset | 58,505 | Recent new issue. YTW SCENARIO Maturity Type : Call Maturity Date : 2014-07-30 Maturity Price : 25.00 Evaluated at bid price : 25.75 Bid-YTW : 5.37 % |
| PWF.PR.M | FixedReset | 35,640 | Nesbitt bought 25,100 from National at 26.05. YTW SCENARIO Maturity Type : Limit Maturity Maturity Date : 2039-05-22 Maturity Price : 23.43 Evaluated at bid price : 25.82 Bid-YTW : 5.19 % |
| BAM.PR.H | OpRet | 32,042 | YTW SCENARIO Maturity Type : Soft Maturity Maturity Date : 2012-03-30 Maturity Price : 25.00 Evaluated at bid price : 24.50 Bid-YTW : 6.89 % |
| RY.PR.Y | FixedReset | 31,425 | YTW SCENARIO Maturity Type : Call Maturity Date : 2014-12-24 Maturity Price : 25.00 Evaluated at bid price : 26.15 Bid-YTW : 5.26 % |
| There were 30 other index-included issues trading in excess of 10,000 shares. | |||
Grishchenko, Olesya V. and Huang, Jing-Zhi, Inflation Risk Premium: Evidence from the TIPS Market (December 11, 2008).
“Inflation-indexed securities would appear to be the most direct source of information about in°ation expectations and real interest rates” (Bernanke, 2004). In this paper we study the term structure of real interest rates, expected in°ation and inflation risk premia using data on prices of Treasury Inflation Protected Securities (TIPS) over the period 2000-2007. The estimates of the 10-year inflation risk premium are between 11 and 22 basis points for 2000-2007 depending on the proxy used for the expected inflation. Furthermore, we find that the inflation risk premium is time varying and, specifically, negative in the first half (which might be due to either concerns of deflation or low liquidity of the TIPS market), but positive in the second half of the sample.
…
This paper represents perhaps the first attempt to estimate the inflation risk premium directly using the prices of Treasury Inflation Protected Securities (TIPS). Using the market data on prices of TIPS over the period 2000-2007, we find that the 10-year average inflation risk premium ranges from 11 to 22 basis points. We also find that it is time-varying. More specifically, it is negative in 2000-2003 but positive in 2004-2007. The negative inflation risk premium during 2000-2003 is due to either concerns of deflation or liquidity problems in the TIPS market. There seems to be more evidence that supports the former explanation. The estimated average 10-year in°ation risk premium over the second half varies between 29 and 48 basis points, depending on the proxy used for the expected inflation. The estimates based on Blue Chips inflation forecast are the lowest (29 basis points), and the estimates based on one-year SPF are the highest (48 basis points). We also find that the inflation risk premium is considerably less volatile during 2004-2007, a finding consistent with the observations that in°ation expectations became more stable during this period, investors became more familiar with the TIPS market, and the market liquidity has gradually improved.Our empirical results on in°ation risk premium estimated directly from TIPS should be valuable for practitioners, monetary authorities and policymakers alike because they help to assess the inflation expectations and the inflation risk premium of bond market investors.
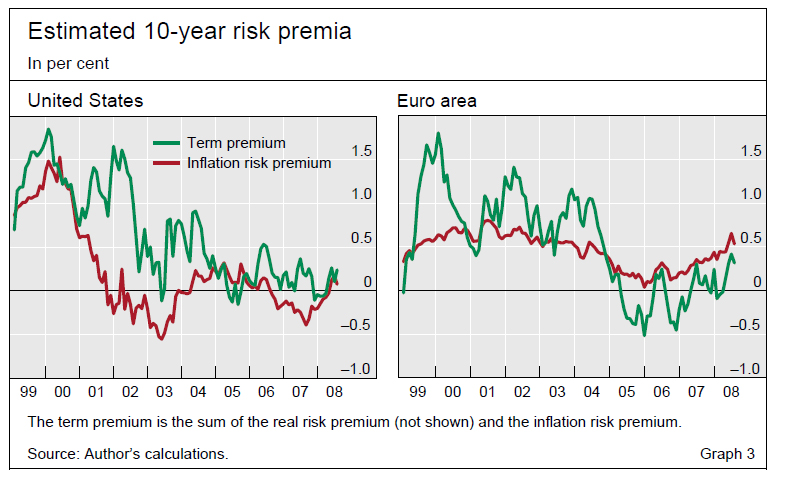
The Inflation Risk Premium in the Term Structure of Interest Rates, Peter Hördahl, BIS Quarterly Review, September 2008:
A dynamic term structure model based on an explicit structural macroeconomic framework is used to estimate inflation risk premia in the United States and the euro area. On average over the past decade, inflation risk premia have been relatively small but positive. They have exhibited an increasing pattern with respect to maturity for the euro area and a flatter one for the United States. Furthermore, the estimates imply that risk premia vary over time, mainly in response to fluctuations in economic growth and inflation.
…
This article estimates inflation risk premia using a dynamic term structure model based on an explicit structural macroeconomic model. The identification and quantification of such premia are important because they introduce a wedge between break-even inflation rates and investors’ expectations of future inflation. In addition, inflation risk premia per se may provide useful information to policymakers with respect to market participants’ aversion to inflation risks as well as to their perceptions about such risks.The results show that inflation risk premia in the United States and in the euro area are on average positive, but relatively small. Moreover, the estimated premia vary over time, mainly in response to changes in economic activity, as measured by the output gap, and inflation. The estimates suggest that fluctuations in output drive much of the cyclical variation in inflation premia, while high-frequency premia fluctuations are mostly due to changes in the level of inflation.
Just a reminder about the next seminar in the series on the theory and practice of preferred share investing.
These seminars are aimed at active and potential preferred share investors who wish to review relative valuation techniques in preferred share analysis.
All seminars will be presented by James Hymas, who has written extensively on the subject of preferred share investment and has been referred to as a "top expert" on the subject.
Questions are encouraged throughout the seminars, as well as in informal discussion at the end of the session.
Each seminar is two hours in length; coffee and tea will be served. The cost of attendance is $100, but a discount of $50 will be given to participants who have an annual subscription to PrefLetter with at least one issue remaining at the time of the seminar.
All seminars will be video-recorded for future distribution. Please note the slight change of venue: same hotel, different conference room.
Advance registration and payment may be performed on-line.
"FixedReset Issues" are popular with investors who:
These issues are characterized by:
This seminar will review the theory of FixedReset Preferred evaluation, including:
Examples of relative valuation in current markets will be supplied and discussed.
Attendence is limited; a reservation will avoid disappointment.
Location: Days Hotel & Conference Center, (at Carlton & College, downtown Toronto) College Room (see map).
Time: May 28, 2009, 6pm-8pm.
Reservations: Please visit the PrefLetter Seminar Page.