Charles W. Calomiris of Columbia University has been mentioned on PrefBlog before, most recently on September 23. He has just posted a piece on VoxEU, Financial Innovation, Regulation and Reform that is thoughtful enough to deserve a thorough review.
He suggests that the current crisis is due to
- the Fed’s easy monetary policy in 2002-05
- official encouragement for sub-prime lending
- restrictions on bank ownership and
- ineffective prudential regulation
To fix this, he suggests a six-point plan.
The first point addresses the measurement of risk. He states:
If subprime risk had been correctly identified in 2005, the run-up in subprime lending in 2006 and 2007 could have been avoided.
The essence of the solution to this problem is to bring objective information from the market into the regulatory process, and to bring outside (market) sources of discipline in debt markets to bear in penalising bank risk-taking. These approaches have been tried with success outside the US, and they have often worked.
With respect to bringing market information to bear in measuring risk, one approach to measuring the risk of a loan is to use the interest rate paid on a loan as an index of its risk. Higher-risk loans tend to pay higher interest. Argentine bank capital standards introduced this approach successfully in the 1990s by setting capital requirements on loans using loan interest rates (Calomiris and Powell 2001). If that had been done with high-interest subprime loans, the capital requirements on those loans would have been much higher. Another complementary measure would be to use observed yields on uninsured debts of banks, or their credit default swaps, to inform supervisors about the overall risk of an institution.
Laudable objectives, but these are unworkable in practice.
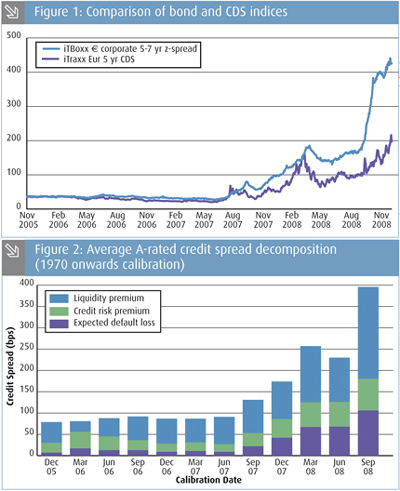
Firstly, it is a lot easier to look back at sub-prime and say how nutty it was than it is to identify a bubble when you’re in the middle of it. See Making Sense of Subprime
Secondly, it’s extremely procyclical. Say we have a bank that accepts deposits, but puts its money to work by buying corporate bonds. In good times, spreads will be narrow, they will be making money and capital requirements will be small. In bad times, spreads will widen, losing them money and increasing capital requirements at the same time. This is not a good recipe.
The Argentine approach may address the procyclicity angle, but it is not apparrent in the essay. Dr. Calomiris needs to address this point head-on.
The second point is macro-prudential regulation triggers. Dr. Calomiris suggests that some form of countercyclical regulatory environment is desirable:
Borio and Drehmann (2008) develop a practical approach to identifying ex ante signals of bubbles that could be used by policy makers to vary prudential regulations in a timely way in reaction to the beginning of a bubble. They find that moments of high credit growth that coincide with unusually rapid stock market appreciation or unusually rapid house price appreciation are followed by unusually severe recessions. They show that a signalling model that identifies bubbles in this way (i.e., as moments in which both credit growth is rapid and one or both key asset price indicators is rising rapidly) would have allowed policy makers to prevent some of the worst boom-and-bust cycles in the recent experience of developed countries. They find that the signal-to-noise ratio of their model is high – adjustment of prudential rules in response to a signal indicating the presence of a bubble would miss few bubbles and would only rarely signal a bubble in the absence of one.
I think it’s entirely reasonable to adjust risk-weightings based on the age of the facility. Never mind macro-prudential considerations, I suspect that new relationships are inherently more risk than old, even in the absence of a growing balance sheet.
The third point is a desire for disaster planning by each institution to include pre-approved bail-out plans for “too big to fail” (TBTF) banks. I have problems with this. Lehman, for instance, may now be clearly seen as having been too big to fail in September 2008; but if it had blown up, for whatever reason, in September 2006 it would have been no big deal. This proposal brings with it a false sense of security.
I suggest that the TBTF problem be addressed by a progressive capital charge on size. The problem with bureacracies is that you get ahead by telling your boss whatever he wants to hear. Many of the problems we’re having is that the big boss (and the directors) were so many layers removed from the action that it’s no wonder they suffered a little hubris. If your first $20-billion in assets required $1-billion capital and your second $20-billion required $1.5-billion, I suggest that risk/reward analysis would be simpler. For the extremely limited amount of business that genuinely requires size, the banks could simply form one-off consortia.
The fourth point is a plea for housing finance reform. Dr. Calomiris suggests that the agencies be wound up and replaced with, for instance, conditional grants to first time buyers. My own suggestions, frequently droned, are:
Americans should also be taking a hard look at the ultimate consumer friendliness of their financial expectations. They take as a matter of course mortgages that are:
- 30 years in term
- refinancable at little or no charge (usually; this may apply only to GSE mortgages; I don’t know all the rules)
- non-recourse to borrower (there may be exceptions in some states)
- guaranteed by institutions that simply could not operate as a private enterprise without considerably more financing
- Added 2008-3-8: How could I forget? Tax Deductible
The fifth point is relaxing restrictions on bank ownership to make accountability a little more of a practical concept, and I couldn’t agree more. I will also suggest that a progressive charge on size will help in this regard.
The sixth point seeks transparency in derivatives transactions. due to perceived opacity in counterparty risk.
The problem with requiring that all OTC transaction clear through a clearing house is that this may not be practical for the most customised OTC contracts. A better approach would be to attach a regulatory cost to OTC contracts that do not clear through the clearing house to encourage, but not require, clearing-house clearing.
I sort-of agree with this. I will suggest that the major problem with counterparty risk in this episode was that the big name players (AIG and the Monolines) were able to leave their committments uncollateralized. I suggest that uncollateralized derivative exposures should attract a significant capital charge … EL = PD * EAD * LD, right (that’s Basel-geek-speak for Expected Loss = Probability of Default * Exposure at Default * Loss on Default). Incorporate that in the capital charges and there will be little further problem with counterparty exposure.