There’s a draft bill in Congress that will kill the CDS market:
House of Representatives Agriculture Committee Chairman Collin Peterson of Minnesota circulated an updated draft bill yesterday that would ban credit-default swap trading unless investors owned the underlying bonds. The document, distributed by e-mail by the committee staff in Washington, would also force U.S. trading in the $684 trillion over-the-counter derivatives market to be processed by a clearinghouse.
Presumably, the requirement to own the underlying bonds would apply only to buyers. The industry response notes the obvious:
The standardization necessary to process a contract in a clearinghouse may harm the market and drive the trading overseas, Weber said.
“It’s a big deal because the OTC market has developed almost as an alternative to the exchange market with its clearinghouses,” he said. “It would be advantageous for places like London, Hong Kong or Singapore where OTC trading wouldn’t have that kind of restriction.”
Menzie Chinn of Econbrowser provides an an update on multipliers from a credible source:
Accrued Interest points out that absolute yields on US corporates are nowhere near as interesting as the spreads imply:
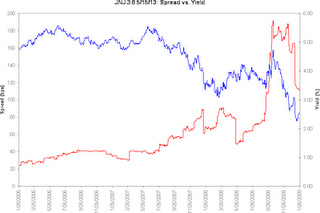 Click for big
… although, mind you, that’s a four year issue he’s talking about. He concludes:
So what does the corporate bond market offer? For those who want to just collect income, corporates are a much better choice than either Treasuries or Agency bonds. There are enough solid names to build a diversified portfolio. But this trade is all about the income collection, or the carry. It isn’t about making a great trade.
Or its about making the right credit call at the right time. Picking the beaten up name than can recover. But in that case, it isn’t an easy trade, its a gutsy call that could wind up with a big capital gain or else a large loss in bankruptcy.
I will suggest that fixed income investing in general is all about income collection. Those wishing to make a “great trade” should stick to a more appropriate asset class. I get a lot of calls asking for my ONE GREAT IDEA that will MAKE A FORTUNE!!!! Guys, guys, guys … that’s not what fixed-income is all about.
Treasury will write a global liquidity guarantee on a SIV, a move that has interesting implications. Clearly, there is huge demand for maturity transformation that is traditionally intermediated by banks, but in the glory days saw some intermediation by SIVs, among other vehicles. Clearly, these are unusual times and no conclusions for the future can be drawn; but it will be interesting to see how the eternal struggle between lenders wanting short-term and borrowers seeking long-term plays out over the next few years.
Vancouverites wondering about funding the Olympic Village will be unsurprised to hear that Fortress Investment Group really, really needs more cash. Hat tips: Zero Hedge and Dealbreaker, although I suspect they’re a little over-excited.
Treasuries got whacked today, with the long bond yield up 17bp to 3.59%. Mortgage paper is worse. Long Canadas did relatively well, yield up 8bp to 3.71%. Long Corporates have returned -2.05% month-to-date and now yield 7.6%.
However, PerpetualDiscounts – along with every other sector – was up today and now yield 6.88%, equivalent to 9.63% interest at the standard 1.4x equivalency factor, implying a pre-tax interest-equivalent spread of ~200bp.
Tomorrow will be an interesting day – there are no less than three new issues settling. The BNS 6.25%+446 will trade as BNS.PR.X; the TD 6.25%+438 will trade as TD.PR.G; and the NA 6.60%+479 will trade as NA.PR.P.
And who knows? If they trade nicely, maybe we’ll see some more!
HIMIPref™ Preferred Indices
These values reflect the December 2008 revision of the HIMIPref™ Indices
Values are provisional and are finalized monthly |
| Index |
Mean
Current
Yield
(at bid) |
Median
YTW |
Median
Average
Trading
Value |
Median
Mod Dur
(YTW) |
Issues |
Day’s Perf. |
Index Value |
| Ratchet |
6.87 % |
7.66 % |
22,643 |
13.53 |
2 |
-0.1070 % |
848.4 |
| FixedFloater |
7.42 % |
6.92 % |
161,135 |
13.92 |
8 |
0.6635 % |
1,394.4 |
| Floater |
5.34 % |
4.51 % |
32,048 |
16.39 |
4 |
0.4851 % |
985.3 |
| OpRet |
5.31 % |
4.91 % |
169,475 |
4.03 |
15 |
0.0139 % |
2,023.1 |
| SplitShare |
6.18 % |
9.17 % |
75,844 |
4.11 |
15 |
0.1742 % |
1,803.1 |
| Interest-Bearing |
7.09 % |
7.95 % |
36,181 |
0.88 |
2 |
0.1158 % |
1,996.6 |
| Perpetual-Premium |
0.00 % |
0.00 % |
0 |
0.00 |
0 |
0.1204 % |
1,560.2 |
| Perpetual-Discount |
6.87 % |
6.88 % |
226,126 |
12.67 |
71 |
0.1204 % |
1,436.9 |
| FixedReset |
6.08 % |
5.35 % |
761,830 |
14.38 |
23 |
0.3718 % |
1,785.9 |
| Performance Highlights |
| Issue |
Index |
Change |
Notes |
| ALB.PR.A |
SplitShare |
-2.16 % |
Asset coverage of 1.1-:1 as of January 22 according to Scotia.
YTW SCENARIO
Maturity Type : Hard Maturity
Maturity Date : 2011-02-28
Maturity Price : 25.00
Evaluated at bid price : 19.97
Bid-YTW : 16.56 % |
| BNA.PR.C |
SplitShare |
-1.90 % |
Asset coverage of 1.8+:1 as of December 31, according to the company. The underlying BAM.A closed today at 19.88 compared to the year-end close of 18.55 and this improvement, together with what may be rather large profits on the retractions of BNA.PR.A and BNA.PR.B, will increase the coverage … at least a little, barring disaster tomorrow!
YTW SCENARIO
Maturity Type : Hard Maturity
Maturity Date : 2019-01-10
Maturity Price : 25.00
Evaluated at bid price : 11.35
Bid-YTW : 15.50 % |
| WFS.PR.A |
SplitShare |
-1.61 % |
Asset coverage of 1.1+:1 as of January 22 according to Mulvihill.
YTW SCENARIO
Maturity Type : Hard Maturity
Maturity Date : 2011-06-30
Maturity Price : 10.00
Evaluated at bid price : 8.56
Bid-YTW : 12.65 % |
| GWO.PR.F |
Perpetual-Discount |
-1.58 % |
YTW SCENARIO
Maturity Type : Limit Maturity
Maturity Date : 2039-01-29
Maturity Price : 21.75
Evaluated at bid price : 21.75
Bid-YTW : 6.88 % |
| MFC.PR.B |
Perpetual-Discount |
-1.41 % |
YTW SCENARIO
Maturity Type : Limit Maturity
Maturity Date : 2039-01-29
Maturity Price : 17.46
Evaluated at bid price : 17.46
Bid-YTW : 6.77 % |
| BMO.PR.K |
Perpetual-Discount |
-1.22 % |
YTW SCENARIO
Maturity Type : Limit Maturity
Maturity Date : 2039-01-29
Maturity Price : 19.51
Evaluated at bid price : 19.51
Bid-YTW : 6.88 % |
| IAG.PR.A |
Perpetual-Discount |
-1.09 % |
YTW SCENARIO
Maturity Type : Limit Maturity
Maturity Date : 2039-01-29
Maturity Price : 16.32
Evaluated at bid price : 16.32
Bid-YTW : 7.16 % |
| BNS.PR.J |
Perpetual-Discount |
-1.05 % |
YTW SCENARIO
Maturity Type : Limit Maturity
Maturity Date : 2039-01-29
Maturity Price : 19.79
Evaluated at bid price : 19.79
Bid-YTW : 6.69 % |
| PWF.PR.I |
Perpetual-Discount |
1.01 % |
YTW SCENARIO
Maturity Type : Limit Maturity
Maturity Date : 2039-01-29
Maturity Price : 21.73
Evaluated at bid price : 22.00
Bid-YTW : 6.86 % |
| CU.PR.B |
Perpetual-Discount |
1.02 % |
YTW SCENARIO
Maturity Type : Limit Maturity
Maturity Date : 2039-01-29
Maturity Price : 22.57
Evaluated at bid price : 22.77
Bid-YTW : 6.72 % |
| PWF.PR.G |
Perpetual-Discount |
1.02 % |
YTW SCENARIO
Maturity Type : Limit Maturity
Maturity Date : 2039-01-29
Maturity Price : 21.73
Evaluated at bid price : 21.73
Bid-YTW : 6.84 % |
| TCA.PR.X |
Perpetual-Discount |
1.11 % |
YTW SCENARIO
Maturity Type : Limit Maturity
Maturity Date : 2039-01-29
Maturity Price : 44.29
Evaluated at bid price : 45.51
Bid-YTW : 6.17 % |
| RY.PR.I |
FixedReset |
1.13 % |
YTW SCENARIO
Maturity Type : Limit Maturity
Maturity Date : 2039-01-29
Maturity Price : 22.27
Evaluated at bid price : 22.31
Bid-YTW : 4.74 % |
| TD.PR.S |
FixedReset |
1.14 % |
YTW SCENARIO
Maturity Type : Limit Maturity
Maturity Date : 2039-01-29
Maturity Price : 22.19
Evaluated at bid price : 22.25
Bid-YTW : 4.27 % |
| BMO.PR.N |
FixedReset |
1.20 % |
YTW SCENARIO
Maturity Type : Limit Maturity
Maturity Date : 2039-01-29
Maturity Price : 25.35
Evaluated at bid price : 25.40
Bid-YTW : 5.91 % |
| BMO.PR.H |
Perpetual-Discount |
1.20 % |
YTW SCENARIO
Maturity Type : Limit Maturity
Maturity Date : 2039-01-29
Maturity Price : 21.00
Evaluated at bid price : 21.00
Bid-YTW : 6.44 % |
| W.PR.H |
Perpetual-Discount |
1.27 % |
YTW SCENARIO
Maturity Type : Limit Maturity
Maturity Date : 2039-01-29
Maturity Price : 19.11
Evaluated at bid price : 19.11
Bid-YTW : 7.28 % |
| FFN.PR.A |
SplitShare |
1.46 % |
Asset coverage of 1.1+:1 as of January 15 according to the company.
YTW SCENARIO
Maturity Type : Hard Maturity
Maturity Date : 2014-12-01
Maturity Price : 10.00
Evaluated at bid price : 7.62
Bid-YTW : 10.96 % |
| BNA.PR.A |
SplitShare |
1.47 % |
Asset coverage of 1.8+:1 as of December 31, according to the company. The underlying BAM.A closed today at 19.88 compared to the year-end close of 18.55 and this improvement, together with what may be rather large profits on the retractions of BNA.PR.A and BNA.PR.B, will increase the coverage … at least a little, barring disaster tomorrow! Oddly, this issue is now trading well over its estimated retraction price of $21.74. Didn’t always used to!
YTW SCENARIO
Maturity Type : Hard Maturity
Maturity Date : 2010-09-30
Maturity Price : 25.00
Evaluated at bid price : 24.15
Bid-YTW : 9.17 % |
| BCE.PR.Z |
FixedFloater |
1.63 % |
YTW SCENARIO
Maturity Type : Limit Maturity
Maturity Date : 2039-01-29
Maturity Price : 25.00
Evaluated at bid price : 15.00
Bid-YTW : 7.30 % |
| BNS.PR.Q |
FixedReset |
1.68 % |
YTW SCENARIO
Maturity Type : Limit Maturity
Maturity Date : 2039-01-29
Maturity Price : 21.20
Evaluated at bid price : 21.20
Bid-YTW : 4.62 % |
| RY.PR.L |
FixedReset |
1.72 % |
YTW SCENARIO
Maturity Type : Limit Maturity
Maturity Date : 2039-01-29
Maturity Price : 23.06
Evaluated at bid price : 23.10
Bid-YTW : 5.33 % |
| BCE.PR.G |
FixedFloater |
1.91 % |
YTW SCENARIO
Maturity Type : Limit Maturity
Maturity Date : 2039-01-29
Maturity Price : 25.00
Evaluated at bid price : 15.50
Bid-YTW : 7.02 % |
| PPL.PR.A |
SplitShare |
2.13 % |
Asset coverage of 1.4+:1 as of January 15 according to the company.
YTW SCENARIO
Maturity Type : Hard Maturity
Maturity Date : 2012-12-01
Maturity Price : 10.00
Evaluated at bid price : 9.10
Bid-YTW : 7.72 % |
| ELF.PR.G |
Perpetual-Discount |
2.46 % |
YTW SCENARIO
Maturity Type : Limit Maturity
Maturity Date : 2039-01-29
Maturity Price : 14.60
Evaluated at bid price : 14.60
Bid-YTW : 8.24 % |
| BAM.PR.K |
Floater |
2.61 % |
YTW SCENARIO
Maturity Type : Limit Maturity
Maturity Date : 2039-01-29
Maturity Price : 7.85
Evaluated at bid price : 7.85
Bid-YTW : 6.78 % |
| DF.PR.A |
SplitShare |
2.93 % |
Asset coverage of 1.4-:1 as of January 15 according to the company.
YTW SCENARIO
Maturity Type : Hard Maturity
Maturity Date : 2014-12-01
Maturity Price : 10.00
Evaluated at bid price : 9.13
Bid-YTW : 7.15 % |
| Volume Highlights |
| Issue |
Index |
Shares
Traded |
Notes |
| RY.PR.R |
FixedReset |
964,597 |
New issue settled today.
YTW SCENARIO
Maturity Type : Call
Maturity Date : 2014-03-26
Maturity Price : 25.00
Evaluated at bid price : 24.97
Bid-YTW : 6.32 % |
| TD.PR.N |
OpRet |
185,200 |
Scotia crossed 182,900 at 25.65.
YTW SCENARIO
Maturity Type : Soft Maturity
Maturity Date : 2014-01-30
Maturity Price : 25.00
Evaluated at bid price : 25.66
Bid-YTW : 4.03 % |
| BNS.PR.T |
FixedReset |
54,782 |
Recent new issue.
YTW SCENARIO
Maturity Type : Limit Maturity
Maturity Date : 2039-01-29
Maturity Price : 24.95
Evaluated at bid price : 25.00
Bid-YTW : 6.10 % |
| SLF.PR.C |
Perpetual-Discount |
50,475 |
Desjardins crossed 25,300 at 15.40; Nesbitt crossed 15,000 at 15.41.
YTW SCENARIO
Maturity Type : Limit Maturity
Maturity Date : 2039-01-29
Maturity Price : 15.36
Evaluated at bid price : 15.36
Bid-YTW : 7.36 % |
| RY.PR.P |
FixedReset |
47,495 |
Recent new issue.
YTW SCENARIO
Maturity Type : Limit Maturity
Maturity Date : 2039-01-29
Maturity Price : 25.01
Evaluated at bid price : 25.06
Bid-YTW : 6.13 % |
| TD.PR.E |
FixedReset |
43,462 |
Recent new issue.
YTW SCENARIO
Maturity Type : Limit Maturity
Maturity Date : 2039-01-29
Maturity Price : 25.03
Evaluated at bid price : 25.08
Bid-YTW : 6.25 % |
| There were 32 other index-included issues trading in excess of 10,000 shares. |