June 27, 2008

June 27th, 2008

A nasty piece on VoxEU today – How to prick local housing bubbles in a monetary union: regulation and countercyclical taxes. A very prescriptive, central-planning approach … for example:

Whenever ECB interest rates become inappropriately low for a member state, for example, aggressive reductions in tax breaks on housing should aim to reduce the stimulus coming from ECB policy. For example, mortgage interest relief could be conditional on the real rather than the nominal interest rate. At the same time, tax incentives that favour fixed- over flexible-rate mortgages might be called for, as well as changes to the property tax and capital gains tax regime so that they act automatically as countercyclical stabilisers. In some cases, additional temporary tax measures to contain an emerging bubble will be required.

All told, the three Divisions have examined the references to credit ratings in 44 of our rules and forms. The staff is recommending changes to 38 of them. Specifically, they are recommending the complete elimination of any reference to credit ratings in 11 rules and forms. They are recommending the substitution of a standard based on a more clearly stated regulatory purpose or other concept in 27 rules and forms. And they are recommending leaving the reference unchanged in 6 rules and forms.

Trouble is, bubbles are only apparent after the fact. And there is no evidence to suggest that, ultimately and in aggregate, the Wise Men have any better an idea of how to accomplish market-timing than anybody else. Canada, for example, can be thought of as resembling the EU to some extent, in that our different regions have very different economies – we periodically hear massive complaints about monetary policy, for instance, tightening when a particular region is already in the doldrums. Can you imagine the reaction to special taxes and mortgage regulation in response to, say, Calgary’s oil-fueled housing boom?

Christopher Cox of the SEC introduced some SEC rule changes regarding credit ratings on Wednesday:

The third part of this rulemaking, which we take up today, is focused on the way the Commission’s own rules refer to and rely upon credit ratings. For some time before the recent subprime crisis, we had been re-evaluating the basis for the SEC’s use of ratings as a surrogate for compliance with various regulatory conditions and requirements. The recent market turmoil, and the role that credit ratings played in it, has only further motivated our consideration of reform in this area.

To begin with, the SEC’s own rules don’t distinguish between ratings for corporate bonds and ratings for structured finance products. As a result, our own regulatory regime might be vulnerable to criticism on the same grounds as the ratings agencies’ use of common symbology: namely, that it doesn’t properly reflect the different risk characteristics of structured products, and the different kinds of information and ratings methodologies that go into ratings for structured products.

Second, several of our regulations implicitly assume that securities with high credit ratings are liquid and have lower price volatility.But since structured finance products can be very different from other rated instruments in these respects, there is good reason for us to examine the precise way that credit ratings are used in our rules as a surrogate for measurements of liquidity and volatility.

Third, several observers, including the Financial Stability Forum, have leveled the criticism that the official recognition of credit ratings for a variety of securities regulatory purposes may have played a role in encouraging investors’ over-reliance on ratings.

Eminently sensible stuff. It’s the Portfolio Manager’s job to evaluate risk.

In other encouraging news, the Fed has quorum:

Elizabeth Duke, a Virginia banker, was confirmed today by the Senate to a seat on the Federal Reserve Board of Governors, breaking a yearlong impasse between the Bush administration and Congress.

Duke, who has been a banker for more than 30 years, was the first woman to chair the American Bankers Association, the industry’s Washington trade group, since its founding in 1875. She served as chairman from 2004 to 2005 and was on its board of directors from 1999 to 2006.

Duke served on the Richmond Fed bank’s board from 1998 to 2000. “She made great contributions then, and I know she’ll make tremendous contributions to the system now,” said Jeffrey Lacker, the bank’s president, who was research director at the time.

Duke held at least $8.2 million in assets, including more than $5 million of stock in Wachovia, according to a financial- disclosure filing last year. Fed officials are required to divest themselves of bank shares.

Well … her shares in Wachovia are probably worth less now! Every little bit helps!

The Fed will report the value of its “Bear Stearns Portfolio” regularly, commencing July 3.

Fortis Bank is cutting its dividend to zero and raising funds with prefs:

The Belgian-Dutch financial services group was forced to take what it called “exceptional measures” by tough market conditions as well as its purchase of parts of its former Dutch rival ABN AMRO, sealed just as the credit crisis hit last year.

It said it would sell about 6 per cent more shares to institutions to raise €1.5-billion, plus up to €2-billion of non-dilutive preference shares. It will save €1.3-billion by not paying an interim 2008 dividend, sell €2-billion of non-core assets and sell and lease back real estate, and pay its full-year dividend in shares.

In the comments to June 26, Assiduous Reader prefhound professed himself insufficiently impressed by the +31bp spread between CM.PR.E & CM.PR.J to take a position.

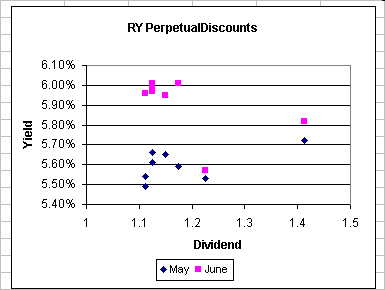
So I’ll try again … the RY issues aren’t as good a sample, since most of them come with very, very similar coupons. But how about if we just look at the two yield extremes:…

Two RY Perpetuals
Issue Dividend Quote Pre-Tax
Bid-YTW
RY.PR.F 1.1125 18.74-98 6.02%
RY.PR.W 1.225 22.23-33 5.58%

Ha! +44bp when it should be negative! How about them apples, prefhound?

Another way to look at is that the difference in dividend is $0.1125 and the difference in bid price is $3.49 … payback time just over 31 years. Don’t show such investments to your accountant.

Now, whenever anybody wants to make an argument about, say, PWF being a significantly better/worse credit than SLF … go for it! Maybe I’ll learn something! And we can certainly discuss at length just how much yield premium is required to hold a preferred with a limited upside (aka negative convexity). Hey, make a case that it should be zero! I’ll listen! But if anybody were to tell me that the yield premium really should be significantly negative, as it was with the CM issues today and as it is with these two RYs … it will probably be a short conversation! The only things I can think of – given that the issuer is the same – are:

  • A big difference in term to call
  • A big difference in liquidity
  • A big difference in other terms of the issue (e.g., voting rights, restrictive covenants, etc.)

None of these differences are applicable with the CM & RY issues I’ve highlighted. This is a very, very strange market.

Note that these indices are experimental; the absolute and relative daily values are expected to change in the final version. In this version, index values are based at 1,000.0 on 2006-6-30
Index Mean Current Yield (at bid) Mean YTW Mean Average Trading Value Mean Mod Dur (YTW) Issues Day’s Perf. Index Value
Ratchet 4.24% 2.89% 49,180 0.08 1 +0.0787% 1,119.3
Fixed-Floater 4.82% 4.56% 62,074 16.18 7 -0.2844% 1,043.1
Floater 4.21% 4.21% 71,591 16.99 2 -2.7508% 910.6
Op. Retract 4.88% 2.55% 209,872 2.85 16 +0.2272% 1,054.2
Split-Share 5.39% 6.07% 66,395 4.13 15 -0.7824% 1,037.4
Interest Bearing 6.12% 3.78% 46,436 2.02 3 +0.3042% 1,124.6
Perpetual-Premium 5.93% 4.63% 327,440 11.11 13 -0.0566% 1,013.1
Perpetual-Discount 6.00% 6.04% 221,146 13.86 59 -0.1233% 880.5
Major Price Changes
Issue Index Change Notes
HPF.PR.A SplitShare (for now!) -5.2021% Strange issue often discussed.
BAM.PR.K Floater -3.5114%  
BNA.PR.C SplitShare -2.7124% Asset coverage of just under 3.6:1 as of May 30 according to the company. Now with a pre-tax bid-YTW of 7.80% based on a bid of 19.01 and a hardMaturity 2019-1-10 at 25.00.
POW.PR.D PerpetualDiscount -2.5145% Now with a pre-tax bid-YTW of 6.23% based on a bid of 20.16 and a limitMaturity.
CU.PR.B PerpetualPremium (for now!) -2.3320% Now with a pre-tax bid-YTW of 6.13% based on a bid of 24.71 and a limitMaturity.
BCE.PR.G FixFloat -2.0888%  
BAM.PR.B Floater -2.0088%  
BMO.PR.H PerpetualDiscount -1.7818% Now with a pre-tax bid-YTW of 5.91% based on a bid of 22.60 and a limitMaturity.
HSB.PR.D PerpetualDiscount -1.6867% Now with a pre-tax bid-YTW of 6.17% based on a bid of 20.40 and a limitMaturity.
SBC.PR.A SplitShare -1.6782% Now with a pre-tax bid-YTW of 5.31% based on a bid of 9.96 and a hardMaturity 2012-11-30 at 10.00.
PWF.PR.E PerpetualDiscount -1.5551% Now with a pre-tax bid-YTW of 6.12% based on a bid of 22.79 and a limitMaturity.
BAM.PR.M PerpetualDiscount -1.4218% Now with a pre-tax bid-YTW of 7.19% based on a bid of 16.64 and a limitMaturity.
HSB.PR.C PerpetualDiscount -1.2172% Now with a pre-tax bid-YTW of 6.08% based on a bid of 21.10 and a limitMaturity.
PWF.PR.K PerpetualDiscount -1.2136% Now with a pre-tax bid-YTW of 6.20% based on a bid of 20.35 and a limitMaturity.
CIU.PR.A PerpetualDiscount +1.2658% Now with a pre-tax bid-YTW of 5.82% based on a bid of 20.00 and a limitMaturity.
MFC.PR.C PerpetualDiscount +1.4418% Now with a pre-tax bid-YTW of 5.76% based on a bid of 19.70 and a limitMaturity.
IAG.PR.A PerpetualDiscount +1.5504% Now with a pre-tax bid-YTW of 5.89% based on a bid of 19.65 and a limitMaturity.
ELF.PR.G PerpetualDiscount +1.7039% Now with a pre-tax bid-YTW of 6.62% based on a bid of 18.02 and a limitMaturity.
BAM.PR.J OpRet +1.8402% Now with a pre-tax bid-YTW of 5.78% based on a bid of 24.35 and a softMaturity 2018-3-30 at 25.00.
Volume Highlights
Issue Index Volume Notes
MFC.PR.B PerpetualDiscount 182,245 RBC crossed 175,000 in three tranches at 20.25. Now with a pre-tax bid-YTW of 5.83% based on a bid of 20.12 and a limitMaturity.
MFC.PR.C PerpetualDiscount 132,381 RBC crossed 50,000 at 19.75, then 75,000 at 19.65. Now with a pre-tax bid-YTW of 5.76% based on a bid of 19.70 and a limitMaturity.
TD.PR.P PerpetualDiscount 80,027 Anonymous bought 43,900 from Nesbitt at 23.02, then (another?) anonymous bought 10,000 at 23.05 from Nesbitt. Now with a pre-tax bid-YTW of 5.80% based on a bid of 21.30 and a limitMaturity.
PWF.PR.K PerpetualDiscount 62,800 RBC crossed 50,000 at 20.70. Now with a pre-tax bid-YTW of 6.20% based on a bid of 20.35 and a limitMaturity.
TD.PR.O PerpetualDiscount 45,700 CIBC crossed 40,000 at 21.30. Now with a pre-tax bid-YTW of 5.80% based on a bid of 21.30 and a limitMaturity.
CL.PR.B PerpetualPremium 40,428 CIBC crossed 38,000 at 25.45. Now with a pre-tax bid-YTW of 5.52% based on a bid of 25.45 and a call 2011-1-30 at 25.00.
TD.PR.R PerpetualPremium 27,500 Scotia crossed 20,000 at 25.00. Now with a pre-tax bid-YTW of 5.74% based on a bid of 25.00 and a limitMaturity.

There were twelve other index-included $25-pv-equivalent issues trading over 10,000 shares today.

IQW.PR.C Conversion Continues

June 27th, 2008

Quebecor World has announced:

on or prior to June 27, 2008, it received notices in respect of 744,124 of its remaining 2,507,153 issued and outstanding Series 5 Cumulative Redeemable First Preferred Shares (TSX: IQW.PR.C) (the “Series 5 Preferred Shares”) requesting conversion into the Company’s Subordinate Voting Shares (TSX: IQW).

In accordance with the provisions governing the Series 5 Preferred Shares, registered holders of such shares are entitled to convert all or any number of their Series 5 Preferred Shares into a number of Subordinate Voting Shares effective as of September 1, 2008 (the “Conversion Date”), provided such holders gave notice of their intention to convert at least 65 days prior to the Conversion Date. The Series 5 Preferred Shares are convertible into that number of the Company’s Subordinate Voting Shares determined by dividing Cdn$25.00 together with all accrued and unpaid dividends on such shares up to August 31, 2008 by the greater of (i) Cdn$2.00 and (ii) 95% of the weighted average trading price of the Series 5 Preferred Shares on the Toronto Stock Exchange during the period of twenty trading days ending on August 28, 2008.

The next conversion date on which registered holders of the Series 5 Preferred Shares will be entitled to convert all or any number of such shares into Subordinate Voting Shares is December 1, 2008, and notices of conversion in respect thereof must be deposited with the Company’s transfer agent, Computershare Investor Services Inc., on or before September 26, 2008.

This continuing conversion shows the value (to the company, and to the existing common shareholders) of the use of a minimum price to avoid ‘death spiral’ conversion. The last price of IQW.PR.C is $1.65; the last price of the IQW is $0.185 … but the face value ($25.00) plus accumulated dividends of IQW.PR.C is used as the numerator in the conversion, with the minimum of $2.00 per common share used as the denominator. In the last conversion, the ratio was 13.146875 common per preferred converted.

Update: See also previous post for IQW.PR.C.

Credit Spreads: Structural Model Deluxe

June 27th, 2008

It has long been a criticism of the structural Merton models of default that they calculate credit spreads that are much lower than those observed in the market. The Bank of England and the Bank of Canada take what I feel is a sensible course and ascribe the excess spread to liquidity concerns.

Liquidity, however, is a kind of touchy-feely concept and there is a yearning to quantify credit spreads such that, ideally, every single beep could be assigned to some kind of rational formula, base largely on default probability. In the Bank of Canada paper referenced above, the authors note:

Recent research that expands structural models by including them in a broader macroeconomic setting has shown that credit-risk premiums may, in fact, account for a larger portion of the overall spread than indicated by the “traditional” structural model (Chen 2008). This suggests that the results of “traditional” structural models such as that used in this study should be interpreted with caution, and should focus on the direction in which risk factors evolve, rather than on the specific values of the relative contributions of the factors.

The Chen paper is available on-line: Macroeconomic Conditions and the Puzzles of Credit Spreads and Capital Structure:

This paper addresses two puzzles about corporate debt: the “credit spread puzzle” – why yield spreads between corporate bonds and treasuries are high and volatile – and the “under-leverage puzzle” – why firms use debt conservatively despite seemingly large tax benefits and low costs of financial distress. I propose a unified explanation for both puzzles: investors demand high risk premia for holding defaultable claims, including corporate bonds and levered firms, because (i) defaults tend to concentrate in bad times when marginal utility is high; (ii) default losses are also higher during such times. I study these comovements in a structural model, which endogenizes firms’ financing and default decisions in an economy with business-cycle variation in expected growth rates and economic uncertainty. These dynamics coupled with recursive preferences generate countercyclical variation in risk prices, default probabilities, and default losses. The credit risk premia in my calibrated model are large enough to account for most of the high spreads and low leverage ratios. Relative to a standard structural model without business-cycle variation, the average spread between Baa and Aaa-rated bonds rises from 48 bp to around 100 bp, while the average optimal leverage ratio of a Baa-rated firm drops from 67% to 42%, both close to the U.S. data.

He points out:

One can not resolve the puzzles simply by raising the risk aversion. While a higher risk aversion does push up the credit spreads, it increases the equity premium dramatically. Moreover, a higher risk aversion actually increases the leverage ratio. It does increase the expected costs of financial distress, which leads to lower optimal coupon rate lower and higher interest coverage. However, a drop in debt value comes with a bigger drop in equity value, resulting in a higher leverage ratio.

The guts of the argument is:

First, marginal utilities are high in recessions, which means that the default losses that occur during such times will affect investors more. Second, recessions are also times when cash flows are expected to grow slower and become more volatile. These factors, combined with higher risk prices at such times, imply lower continuation values for equity-holders, which make firms more likely to default in recessions. Third, since many firms are experiencing problems in recessions, asset liquidation can be particularly costly, which will result in higher default losses for bond and equity-holders. Taken together, the countercyclical variation in risk prices, default probabilities, and default losses raises the present value of expected default losses for bond and equity-holders, which leads to high credit spreads and low leverage ratios.

Frankly, I don’t consider the paper very satisfying. While the argument appears sound, the actual model is too highly parameterized to allow for high confidence in the outputs; in other words, I fear that a variation of data mining has come into play. Additionally, I am highly suspicious of arguments that assume the market is rational and that an objective evaluation of default risk is (essentially) the only factor determining credit spreads. That’s not what I see in the market.

What I see is a lot of segmentation (some investors will not buy corporates. Some investors will buy corporates, but will dump and run at the first whiff of difficulties) and a high liquidity premium – these are two factors not considered in the model.

June 26, 2008

June 26th, 2008

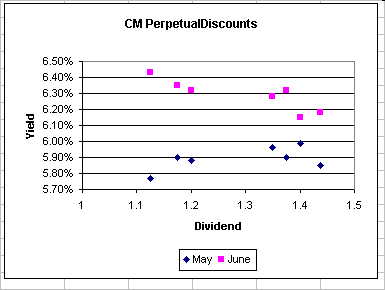
Tireless researchers in PrefBlog’s Department of Things That Don’t Really Make a Whole Lot of Sense have been looking at the various Commerce issues lately…

CM Perpetuals
Issue Dividend Quote Pre-Tax
Bid-YTW
CM.PR.J 1.125 17.63-83 6.39%
CM.PR.I 1.175 18.70-79 6.29%
CM.PR.H 1.200 19.07-19 6.30%
CM.PR.G 1.350 21.51-73 6.28%
CM.PR.P 1.375 22.22-43 6.17%
CM.PR.E 1.400 23.01-48 6.08%
CM.PR.D 1.4375 23.40-62 6.14%

So not only do we have the slope of the yields being in the wrong direction (see my articles on Convexity and Perpetual Hockey Sticks) but … doesn’t the spread seem a little … er … extreme to anybody? It’s almost as much as the spread on Westons that attracted comment last year!

The best performance of the day came from HPF.PR.B, which closed at 10.50-74, 12×23 … up 4.79% bid/bid. All 8,800 shares traded were bought by Nesbitt … could this be related to the Annual Retraction?

Note that these indices are experimental; the absolute and relative daily values are expected to change in the final version. In this version, index values are based at 1,000.0 on 2006-6-30
Index Mean Current Yield (at bid) Mean YTW Mean Average Trading Value Mean Mod Dur (YTW) Issues Day’s Perf. Index Value
Ratchet 4.24% 3.86% 47,881 0.08 1 +0.3842% 1,118.4
Fixed-Floater 4.81% 4.54% 62,504 16.21 7 +0.0801% 1,046.0
Floater 4.09% 4.09% 71,448 17.23 2 +0.2008% 936.4
Op. Retract 4.89% 2.93% 216,362 2.84 16 -0.0278% 1,051.8
Split-Share 5.34% 5.79% 66,490 4.14 15 -0.0705% 1,045.6
Interest Bearing 6.14% 4.15% 46,926 2.01 3 +0.2346% 1,121.2
Perpetual-Premium 5.93% 4.61% 332,503 10.32 13 -0.2470% 1,013.7
Perpetual-Discount 5.98% 6.03% 221,554 13.86 59 -0.3069% 881.6
Major Price Changes
Issue Index Change Notes
CM.PR.G PerpetualDiscount -3.5426% Now with a pre-tax bid-YTW of 6.28% based on a bid of 21.51 and a limitMaturity.
SLF.PR.C PerpetualDiscount -2.0408% Now with a pre-tax bid-YTW of 5.98% based on a bid of 18.72 and a limitMaturity.
GWO.PR.H PerpetualDiscount -2.1951% Now with a pre-tax bid-YTW of 6.09% based on a bid of 20.05 and a limitMaturity.
CM.PR.J PerpetualDiscount -2.0556% Now with a pre-tax bid-YTW of 6.39% based on a bid of 17.63 and a limitMaturity.
BAM.PR.O OpRet -2.0408% Now with a pre-tax bid-YTW of 5.98% based on a bid of 24.00 and a softMaturity 2013-6-30 at 25.00.
PWF.PR.E PerpetualDiscount -1.9483% Now with a pre-tax bid-YTW of 6.01% based on a bid of 23.15 and a limitMaturity.
MFC.PR.C PerpetualDiscount -1.8200% Now with a pre-tax bid-YTW of 5.84% based on a bid of 19.42 and a limitMaturity.
POW.PR.C PerpetualDiscount -1.8037% Now with a pre-tax bid-YTW of 6.21% based on a bid of 23.41 and a limitMaturity.
MFC.PR.B PerpetualDiscount -1.6216% Now with a pre-tax bid-YTW of 5.86% based on a bid of 20.02 and a limitMaturity.
CM.PR.I PerpetualDiscount -1.5271% Now with a pre-tax bid-YTW of 6.29% based on a bid of 18.70 and a limitMaturity.
RY.PR.B PerpetualDiscount -1.1386% Now with a pre-tax bid-YTW of 5.97% based on a bid of 19.97 and a limitMaturity.
BNA.PR.C SplitShare -1.1134% Asset coverage of just under 3.6:1 as of May 30 according to the company. Now with a pre-tax bid-YTW of 7.45% based on a bid of 19.54 and a hardMaturity 2019-1-10 at 25.00.
RY.PR.E PerpetualDiscount -1.0909% Now with a pre-tax bid-YTW of 5.99% based on a bid of 19.04 and a limitMaturity.
TD.PR.Q PerpetualDiscount -1.0843% Now with a pre-tax bid-YTW of 5.78% based on a bid of 24.63 and a limitMaturity.
W.PR.J PerpetualDiscount +1.0545% Now with a pre-tax bid-YTW of 6.19% based on a bid of 22.65 and a limitMaturity.
STW.PR.A InterestBearing +1.0945% Asset coverage of 1.8+:1 as of June 19, according to Middlefield. Now with a pre-tax bid-YTW of 5.30% based on a bid of 10.01 and a call 2009-1-31 at 10.00.
CM.PR.E PerpetualDiscount +1.3656% Now with a pre-tax bid-YTW of 6.08% based on a bid of 23.01 and a limitMaturity.
SBC.PR.A SplitShare +1.3958% Asset coverage of just under 2.1:1 as of June 19, according to Brompton Group. Now with a pre-tax bid-YTW of 4.88% based on a bid of 10.13 and a hardMaturity 2012-11-30 at 10.00.
SLF.PR.C PerpetualDiscount +1.4957% Now with a pre-tax bid-YTW of 5.89% based on a bid of 19.00 and a limitMaturity.
BAM.PR.J OpRet +1.5287% Now with a pre-tax bid-YTW of 6.03% based on a bid of 23.91 and a softMaturity 2018-3-30 at 25.00.
BNS.PR.K PerpetualDiscount +1.7975% Now with a pre-tax bid-YTW of 5.66% based on a bid of 21.22 and a limitMaturity.
Volume Highlights
Issue Index Volume Notes
TD.PR.O PerpetualDiscount 68,350 Anonymous bought 36,000 from Nesbitt at 21.15. Now with a pre-tax bid-YTW of 5.83% based on a bid of 21.17 and a limitMaturity.
SLF.PR.E PerpetualDiscount 47,919 RBC crossed 34,100 at 19.60. Now with a pre-tax bid-YTW of 5.84% based on a bid of 19.40 and a limitMaturity.
NA.PR.L PerpetualDiscount 45,970 RBC crossed 37,800 at 20.10. Now with a pre-tax bid-YTW of 6.16% based on a bid of 20.00 and a limitMaturity.
HSB.PR.D PerpetualDiscount 44,575 RBC crossed 35,100 at 20.95. Now with a pre-tax bid-YTW of 6.06% based on a bid of 20.75 and a limitMaturity.
ACO.PR.A OpRet 42,220 CIBC crossed 41,900 at 26.55. Now with a pre-tax bid-YTW of 2.12% based on a bid of 26.55 and a call 2008-12-31 at 26.00.

There were twenty-one other index-included $25-pv-equivalent issues trading over 10,000 shares today.

MarketRant Deleted from BlogRoll

June 26th, 2008

MarketRant has been deleted from the blogroll. There have been only two posts since March 14 and the author’s corporate site is no longer operable.

BoC Financial System Review, June 2008: Credit Spreads

June 26th, 2008

The Bank of Canada released the June 2008 Financial System Review on June 12. One of the three “Highlighted Issues” was Canadian Corporate Investment Grade Spreads.

The authors first define their terms, making a basic point that surprisingly few investors understand:

In general, two important components drive variations in corporate yield spreads. One is the expected loss from default, the other relates to risk premiums. This latter component can be further decomposed into two types: a credit-risk premium and an illiquidity premium. The expected loss from default generally reflects the fundamentals of the firm, such as the degree of leverage and its ability to generate a stable stream of profits. The credit-risk premium is related to the variability of, or uncertainty about, potential loss from default. Both the credit-risk premium and the expected loss from default are affected by changes in macroeconomic activity. When combined, these two components comprise the part of the yield spread attributed to default-related credit risks.

The illiquidity premium, a non-credit-risk factor, relates to a lack of general market liquidity. Moreover, the credit-risk and illiquidity premiums, like other risk premiums, can vary with any change in the risk appetite of investors and are therefore likely to be positively correlated over time.

They decompose the components of the corporate spread vs. governments using a structure “Merton” model, very similar to the BoE research previously reported on PrefBlog – the BoE is thanked for supplying code in note 16. For investment-grade firms issuing Canadian Corporate Bonds (they do not define their universe more precisely than this) they conclude:

As of 21 May 2008, while the actual spread was 179 basis points, the expected loss, credit-risk premium, and illiquidity premium were 20, 34, and 125 basis points, respectively. Comparable figures for end-July 2007 were 85, 21, 5, and 59 basis points, respectively. The increase in the investment-grade credit spread can thus be attributed to an increase in the credit-risk and illiquidity premiums above their recent historical norms.

… while noting:

The credit-risk component reached its peak level of 89 basis points in March 2008, and the illiquidity premium reached its peak level of 125 basis points in May 2008.

Much of the increase is due to the “high proportion of financial firms (approximately 55% of the index in 2007).”

There are some very illuminating graphs:

I will note that, as of June 25 according to Canadian Bond Indices and the HIMIPref™ Indices:

  • 30-Year Canadas yielded 4.06%
  • Long Corporates yielded ~6.05%
  • PerpetualDiscounts yielded 6.01% as a dividend
  • PerpetualDiscounts yielded 8.41% interest equivalent (at 1.4x)

See Party Like It’s 1999! for further discussion of the PerpetualDiscount Interest-Equivalent / Long Corporate spread.

HIMI Comments on OSFI's Cumulative Tier 1 Proposal

June 26th, 2008

I have sent a letter to OSFI commenting on their Draft Advisory, which proposes to allow cumulative in-kind coupons on Innovative Tier 1 Capital.

This letter reflects information previously mentioned on PrefBlog:

It also builds on the comments made in:

June 25, 2008

June 26th, 2008

James Hamilton of Econbrowser provides an interesting piece on how big a contribution could oil speculation be making? … his conclusion:

We were only able to buy 19.9 mb/d in the first quarter when we offered a price near $100. So why would it have been possible to secure the 21 mb/d that consumers would likely have wanted at a price of $72?

Given these data, I think it is impossible to argue that the volume of futures market purchases alone could be the reason why oil prices went up this year. A key and necessary element of any speculation-based interpretation must be some explanation for the factors governing the physical quantity of oil being supplied to the market.

We’re hearing from a number of experts asserting that there’s no reason why the oil price should have gone up. I wish one of them would tell me where an extra million barrels per day in supply is supposed to come from.

Accrued Interest looks at the question of oil prices and their relationship to general inflation:

So over a period of three decades, it was rare that a move in Core CPI would not be mirrored in headline CPI. If one was elevated, the other was elevated. If one was tame, the other was tame.

However, the 21st century hasn’t followed the same pattern. From 2000-2008, the correlation between total CPI and Core CPI has broken down: only 7.6% measured monthly and 21.4% measured annually. This despite the energy portion of CPI rising at a 1970’s style 9.5% annualized. During the current decade, there has been no particular relationship between total inflation and core inflation.

What does this mean? The data is telling you that rising energy and food prices have been due to supply and demand conditions in those markets. Not classic inflation, which is a monetary phenomenon. In other words, rising oil is indeed due to strong demand from emerging markets and a lack of new supply. Not the weak dollar or loose monetary policy.

Note that these indices are experimental; the absolute and relative daily values are expected to change in the final version. In this version, index values are based at 1,000.0 on 2006-6-30
Index Mean Current Yield (at bid) Mean YTW Mean Average Trading Value Mean Mod Dur (YTW) Issues Day’s Perf. Index Value
Ratchet 4.23% 4.25% 49,839 16.92 1 -0.1179% 1,114.1
Fixed-Floater 4.80% 4.54% 62,691 16.17 7 +0.0877% 1,045.2
Floater 4.10% 4.10% 71,263 17.21 2 -1.9324% 934.5
Op. Retract 4.87% 2.69% 85,637 2.74 15 -0.1430% 1,052.1
Split-Share 5.32% 5.79% 66,645 4.13 15 +0.2725% 1,046.3
Interest Bearing 6.12% 4.47% 47,237 2.29 3 -0.2300% 1,118.5
Perpetual-Premium 5.91% 4.55% 342,014 9.55 13 +0.0902% 1,016.2
Perpetual-Discount 5.95% 6.01% 221,425 13.87 59 -0.0314% 884.3
Major Price Changes
Issue Index Change Notes
BAM.PR.B Floater -2.4096%  
SLF.PR.C PerpetualDiscount -2.0408% Now with a pre-tax bid-YTW of 5.98% based on a bid of 18.72 and a limitMaturity.
BAM.PR.J OpRet -1.6701% Now with a pre-tax bid-YTW of 6.23% based on a bid of 23.55 and a softMaturity 2018-3-30 at 25.00.
PWF.PR.F PerpetualDiscount -1.4759% Now with a pre-tax bid-YTW of 6.07% based on a bid of 22.03 and a limitMaturity.
BAM.PR.K Floater -1.4563%  
BAM.PR.H OpRet -1.3540% Now with a pre-tax bid-YTW of 5.17% based on a bid of 25.50 and a softMaturity 2012-3-30 at 25.00.
CIU.PR.A PerpetualDiscount -1.2500% Now with a pre-tax bid-YTW of 5.89% based on a bid of 19.75 and a limitMaturity.
CM.PR.H PerpetualDiscount -1.2152% Now with a pre-tax bid-YTW of 6.25% based on a bid of 19.21 and a limitMaturity.
CM.PR.E PerpetualDiscount -1.2002% Now with a pre-tax bid-YTW of 6.16% based on a bid of 22.70 and a limitMaturity.
CM.PR.D PerpetualDiscount -1.1615% Now with a pre-tax bid-YTW of 6.10% based on a bid of 23.52 and a limitMaturity.
MFC.PR.C OpRet -1.1000% Now with a pre-tax bid-YTW of 5.73% based on a bid of 19.78 and a limitMaturity.
STW.PR.A InterestBearing -1.0827% Asset coverage of 1.8+:1 as of June 19 according to Middlefield Group Now with a pre-tax bid-YTW of 6.52% (mostly as interest) based on a bid of 10.05 and a hardMaturity 2009-12-31 at 10.00.
PWF.PR.E PerpetualDiscount +1.0270% Now with a pre-tax bid-YTW of 5.88% based on a bid of 23.61 and a limitMaturity.
NA.PR.K PerpetualDiscount +1.0395% Now with a pre-tax bid-YTW of 6.10% based on a bid of 24.30 and a limitMaturity.
BNA.PR.C SplitShare +1.1777% Asset coverage of just under 3.6:1 as of May 31 according to the company Now with a pre-tax bid-YTW of 7.30% based on a bid of 19.76 and a hardMaturity 2019-1-10 at 25.00.
BAM.PR.N PerpetualDiscount +1.3309% Now with a pre-tax bid-YTW of 7.14% based on a bid of 16.75 and a limitMaturity.
IAG.PR.A PerpetualDiscount +2.1053% Now with a pre-tax bid-YTW of 5.97% based on a bid of 19.40 and a limitMaturity.
Volume Highlights
Issue Index Volume Notes
PWF.PR.J OpRet 103,000 Desjardins crossed 100,000 at 25.71. Now with a pre-tax bid-YTW of 4.26% based on a bid of 25.71 and a softMaturity 2013-7-30 at 25.00.
PWF.PR.K PerpetualDiscount 57,025 RBC crossed 50,000 at 20.65. Now with a pre-tax bid-YTW of 6.09% based on a bid of 20.70 and a limitMaturity.
SLF.PR.D PerpetualDiscount 50,767 Now with a pre-tax bid-YTW of 6.10% based on a bid of 18.35 and a limitMaturity.
HSB.PR.D PerpetualDiscount 32,675 RBC crossed 25,000 at 20.90. Now with a pre-tax bid-YTW of 6.03% based on a bid of 20.85 and a limitMaturity.
MFC.PR.B PerpetualDiscount 31,400 RBC bought 10,000 from Nesbitt at 20.36, then crossed 10,000 at 20.40. Now with a pre-tax bid-YTW of 5.76% based on a bid of 20.35 and a limitMaturity.

There were thirty other index-included $25-pv-equivalent issues trading over 10,000 shares today.

BAM.PR.O Hits Market: Bam! Oh!

June 25th, 2008

Brookfield Asset Management has announced:

the completion of its previously-announced Class A Series 21 preference share issue in the amount of C$150 million.

Brookfield Asset Management Inc. issued 6 million Cumulative Class A Preference Shares, Series 21, at a price of C$25 per share with a yield of 5.00% per annum. The net proceeds will be utilized for general corporate purposes. The Series 21 Preference Shares will commence trading on the Toronto Stock Exchange on June 25, 2008 under the symbol BAM.PR.O.

They had to announce it, otherwise nobody would have noticed: the new issue traded 4,250 shares today, all at 24.50, closing at 24.50-55, 1×10. There were seven trades in the most sluggish opening day since … er … the last one.

Mind you, the issue itself isn’t all that terrible. Comparables are:

BAM Retractibles
Issue Quote
6/25
Bid
Yield
to
Worst
End-Date
BAM.PR.H 25.50-90 5.17% SoftMaturity
2012-3-30
BAM.PR.I 25.24-35 5.32% SoftMaturity
2013-12-30
BAM.PR.J 23.55-77 6.23% SoftMaturity
2018-3-30
BAM.PR.O 24.50-55 5.50% SoftMaturity
2013-6-30

The issue suffered through its timing, having been announced on June 16 during the Swoon in June.

NBC Asset Trust issues Asset-Based Tier 1 Paper

June 25th, 2008

National Bank has announced:

that NBC Asset Trust, a subsidiary of National Bank, and National Bank have filed a preliminary prospectus with the securities regulatory authorities in each of the provinces of Canada with respect to a public offering of Trust Capital Securities – Series 2 (“NBC CapS II – Series 2”) by NBC Asset Trust.

The NBC CapS II – Series 2 will be offered by a syndicate of underwriters including National Bank Financial Inc., acting as lead underwriter.

Subject to receipt of final approval from the regulatory authorities, the NBC CapS II – Series 2 will constitute Tier 1 capital of National Bank. This source of financing will also allow National Bank to optimize its capital structure. The net proceeds of the offering will be used for general corporate purposes.

In addition, although no definitive decision has been made, in connection with the offering, National Bank is considering making funds available to NB Capital Corporation to effect the redemption of all the outstanding 8.35% Non-Cumulative Exchangeable Preferred Stock, Series A of NB Capital Corporation, which currently qualify as Tier 1 capital of National Bank, in accordance with their redemption provisions. This redemption would be subject to the completion of the NBC CapS II – Series 2 offering by NBC Asset Trust, the determination by National Bank to make funds available to NB Capital Corporation for the redemption, the approval of the redemption by the Board of Directors of NB Capital Corporation, any applicable regulatory approvals and the issuance of a redemption notice by NB Capital Corporation specifying the redemption date and other relevant information regarding the redemption. The 8.35% Non-Cumulative Exchangeable Preferred Stock, Series A will cease to be included in the regulatory capital of National Bank upon completion of the NBC CapS II – Series 2 offering by NBC Asset Trust.

This is not something I would normally highlight in PrefBlog, but the nature of the security is of interest. According to the prospectus (on SEDAR):

The Trust proposes to issue and sell to investors pursuant to this prospectus (the “Offering”) transferable trust units called Trust Capital Securities – Series 1 or “NBC CapS II – Series 1”, each of which represents an undivided beneficial ownership interest in the Trust Assets (as defined herein), comprised of Residential Mortgages, Mortgage Co-Ownership Interests, Mortgage-Backed Securities, Eligible Investments (each as defined herein) and contractual rights of the Trust in respect of the activities and operations of the Trust.

So it’s ASSET-BACKED, not loan backed. This issue simply goes further to show that cumulative coupons to enable the issuance of Loan Based Tier 1 paper are not necessary; OSFI should rescind its ill-advised draft advisory, which rescues the loan-backed structure at the expense of non-cumulativity.