MGIC, the US Mortgage Insurer, announced a huge loss today and is seeking capital:
MGIC Investment Corp., the largest U.S. mortgage insurer, fell the most in a month after posting a record quarterly loss of $1.47 billion and said it hired an adviser to raise capital.
MGIC’s fourth-quarter net loss was $18.17 a share, compared with a profit of $122 million, or $1.47, a year earlier, the Milwaukee-based company said in a statement today. Excluding investment losses, the insurer lost $18.09 a share, worse than the $8.13 average loss estimate of seven analysts compiled by Bloomberg.
They’ll have to pay up for capital in this environment!
Buffet’s municipal bond re-insurance offer, mentioned yesterday, attracted some comment at Naked Capitalism amid rumours that it is merely a stalking horse for regulatory action:
This seems to be a misguided application of the “good bank-bad bank” approach used in the saving & loan workouts.
But consider the differences: the dead S&L’s landed in the FDIC’s lap. They had to figure out what to do with them, and they wanted to make a recovery on the payments they made in deposit insurance. So the Resolution Trust Corporation was set up. Note that a big issue was that the Federal government had to continue to fund the S&L’s working capital and also pay to keep some staffing going. That cost was considerable and controversial, and led the RTC to sell assets faster than it would have if it had wanted to maximize value.
The reason for segregating assets was simple: there were two different types of investors who might want to acquire them: banks that hadn’t been too badly damaged were interested in the “good bank” assets; distressed players and wealthy individuals went after the “bad bank” assets. The bad bank assets were going sufficiently on the cheap that even parties that had never dabbled in that sort of deal like Ron Perlman made acquisitions and did very well.
But what does a segregation achieve here? No one but an AAA rated party would make sense as a buyer/reinsurer of the muni portfolio. Buffett already having decided to enter the business on a de novo basis means the only interest another insurer is likely to have is reinsurance.
…
And who would buy the rest? The parties who best understand the CDO/CDS exposures and have reason to do a deal are already at the table. You aren’t going to have new parties materialize out of the blue. Private equity investors like TPG and Bain Capital predictably said no thank you, we don’t understand this stuff.
…
So a simple runoff of the portfolios would make the most sense. Any other activity appears to be for the benefit of lawyers and Perella Weinberg, not the policyholders.
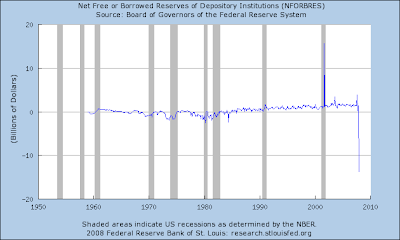
As corporate spreads widen, there are fears that Fed cuts are pushing on a rope:
Companies are paying more to borrow now than before the Fed reduced its benchmark rate by 1.25 percentage point over nine days in January, based on data compiled by Merrill Lynch & Co. Rates on so-called jumbo mortgages, those above $417,000, have increased in the past month, making it tougher to sell properties and risking further price declines.
“It’s the clogging up of the credit markets that worries me most,” Harvard University economist Martin Feldstein said in an interview in New York. “The Fed has done a lot of cutting, the question is whether it’s going to get the traction that it did in the past.”
One example of this is the recent spate of Auction Rate Municipal auction failure. These auctions were last discussed – and explained! – on February 6. Another example is the market for Leveraged Buy-Out loans. Naked Capitalism provides an update to the commentary that was discussed February 11. Incidentally, there’s a new issue of CLO being touted:
Goldman Sachs Group Inc. and Carlyle Group plan to sell a 2 billion-euro ($2.9 billion) collateralized loan obligation and invest their own funds in the riskiest portion, according to a person with direct knowledge.
…
The CLO will mostly hold loans used to finance European leveraged buyouts, purchasing directly from the managers of the transactions as well as loans traded in the market, the person said. Goldman is handling the CLO sale and Carlyle will manage the investments.
…
CELF Partnership Loan Funding 2008-1Class Size Rating Reinvestment Initial terms
(euros) (M/SP)** Period (years)
A 1.47 bln Aaa/AAA 2 150 bp* B 85 mln Aa2/AA 2 350 bp* C 90 mln A3/A- 2 525 bp* D 70 mln Baa3/BBB- 2 750 bp* E 50 mln Ba3/BB- 2 1100 bp* F 80 mln B3/B- 2 1500 bp* Pref 55 mln 20 percent Sub 100 mln
* in basis points over Euribor ** Ratings are Moody’s Investors Service and Standard & Poor’s
However, when I look at two Fed H.15 releases, for Feb. 11, 2008, and Feb. 12, 2007, I see that 30-year interest rate swaps are now at 4.83% to receive 3.20% LIBOR, vs. the year ago figures of 5.42% to receive 5.36% LIBOR. In Canada, long corporates hit 5.8%+ around the end of September and have been relatively stable since … and when we make a selection from the Fed’s easily accessible data, we see that the October 1 rates were 5.42% to receive 5.30% LIBOR. Note that Swaps were discussed briefly on PrefBlog in the context of synthesizing floating rate preferreds.
So maybe things are being transmitted quite as quickly as some might hope, but it certainly appears to me that there has been a bull steepening … at least as far as the swaps market is concerned! To the extent that arbitrage still exists – and friction has increased a lot in the last six months! – that should filter through to the cash bond market in the course of time.
It should also be noted that in Canada, long corporates and long Canadas are down (in price) roughly the same amount Year-to-Date, so all this fancy-pants Swap-Rate stuff should be taken with a grain of salt – at least as far as Canadian prospects are concerned.
Meanwhile, Treasury Secretary Paulson, fresh from his successes with the Hope Now Alliance and Super-SIV/MLEC is proposing new rules for securitization.
U.S. financial regulators will propose changes in the rules for packaging loans into bonds in the aftermath of the subprime credit collapse.
Paulson said it will be “a number of months” before the Presidential Working Group on Financial Markets announces its recommendations and that easing credit strains is the first “priority.”
In not entirely unrelated news, Moody’s has requested comment on the question “Should Moody’s Consider Differentiating Structured Finance and Corporate Ratings?”. There’s a survey! Log in RIGHT NOW and tell them that cosmetic differences are relevant solely to cosmeticians and bullshit artists!
The German government has bailed out IKB:
Germany will provide 1 billion euros in capital to the Dusseldorf-based lender, government officials told reporters in Berlin today. The country’s banks should help pay for the rest and talks on how to raise the remaining 500 million euros are continuing, the officials said.
…
An agreement on the bailout was necessary because IKB needed 500 million euros immediately to have sufficient capital to fulfill demands by German financial regulator BaFin to avoid insolvency, Scheel said. BaFin President Jochen Sanio threatened to close the bank last week if it didn’t quickly receive new capital, Handelsblatt newspaper reported.
I have been extremely annoyed about the emphasis on SocGen scapegoat Kerviel’s background as a back-office employee, most recently on January 30. My fears of a decline in career mobility appear to be justified:
Kerviel’s unauthorized trading at Societe Generale SA ruined the chances of French bank clerks getting promoted to the trading floor, headhunters say.
Kerviel, 31, became a trader at Societe Generale in 2005 after spending five years in the compliance and control section of the bank’s so-called middle office. Last month, the Paris- based bank blamed him for trading losses of 4.9 billion euros ($7.2 billion).
“The middle office won’t be a springboard to become a trader anymore,” said Gael de Roquefeuil, an adviser for financial industry headhunting at Korn/Ferry International in Paris. “Career bridges were already difficult and at least for the short term they are completely over.”
Great. So, especially in France, one of the primary qualifications in gaining promotion to a management position in trading is not having a clue about operations; such clues are gained only through experience. Expect more blow-ups over the next twenty years as competence and knowledge becomes even further divorced from authority than is already the case in financial services. Not to mention reduced profits even in the absence of problems if the major dealers wilfully reduce the size of their talent pool.
A very strong day for preferreds, with returns well-distributed within each asset class.
| Note that these indices are experimental; the absolute and relative daily values are expected to change in the final version. In this version, index values are based at 1,000.0 on 2006-6-30 | |||||||
| Index | Mean Current Yield (at bid) | Mean YTW | Mean Average Trading Value | Mean Mod Dur (YTW) | Issues | Day’s Perf. | Index Value |
| Ratchet | 5.51% | 5.54% | 46,030 | 14.61 | 2 | -0.1837% | 1,080.7 |
| Fixed-Floater | 5.03% | 5.67% | 79,948 | 14.70 | 7 | +0.0300% | 1,020.0 |
| Floater | 4.96% | 5.01% | 76,259 | 15.45 | 3 | +0.5653% | 853.1 |
| Op. Retract | 4.82% | 3.17% | 80,397 | 2.68 | 15 | +0.1978% | 1,045.4 |
| Split-Share | 5.28% | 5.45% | 98,451 | 4.22 | 15 | +0.3168% | 1,042.6 |
| Interest Bearing | 6.23% | 6.40% | 60,247 | 3.58 | 4 | +0.2275% | 1,082.7 |
| Perpetual-Premium | 5.73% | 4.39% | 387,693 | 5.20 | 16 | +0.1448% | 1,028.8 |
| Perpetual-Discount | 5.36% | 5.40% | 291,501 | 14.80 | 52 | +0.4638% | 957.4 |
| Major Price Changes | |||
| Issue | Index | Change | Notes |
| BCE.PR.C | FixFloat | -1.6250% | |
| MFC.PR.C | PerpetualDiscount | -1.1984% | Now with a pre-tax bid-YTW of 5.13% based on a bid of 22.26 and a limitMaturity. |
| RY.PR.B | PerpetualDiscount | +1.0200% | Now with a pre-tax bid-YTW of 5.18% based on a bid of 22.78 and a limitMaturity. |
| SLF.PR.B | PerpetualDiscount | +1.0927 | Now with a pre-tax bid-YTW of 5.25% based on a bid of 23.13 and a limitMaturity. |
| SLF.PR.C | PerpetualDiscount | +1.1029% | Now with a pre-tax bid-YTW of 5.12% based on a bid of 22.00 and a limitMaturity. |
| ELF.PR.F | PerpetualDiscount | +1.1211% | Now with a pre-tax bid-YTW of 5.94% based on a bid of 22.55 and a limitMaturity. |
| BNS.PR.M | PerpetualDiscount | +1.1899% | Now with a pre-tax bid-YTW of 5.13% based on a bid of 22.11 and a limitMaturity. |
| SLF.PR.D | PerpetualDiscount | +1.2414 | Now with a pre-tax bid-YTW of 5.12% based on a bid of 22.02 and a limitMaturity. |
| TD.PR.O | PerpetualDiscount | +1.2414% | Now with a pre-tax bid-YTW of 5.16% based on a bid of 23.63 and a limitMaturity. |
| GWO.PR.I | PerpetualDiscount | +1.2582% | Now with a pre-tax bid-YTW of 5.23% based on a bid of 21.73 and a limitMaturity. |
| RY.PR.W | PerpetualDiscount | +1.4031 | Now with a pre-tax bid-YTW of 5.15% based on a bid of 23.85 and a limitMaturity. |
| BAM.PR.K | Floater | +1.4870% | |
| W.PR.H | PerpetualDiscount | +1.5063% | Now with a pre-tax bid-YTW of 5.67% based on a bid of 24.26 and a limitMaturity. |
| RY.PR.E | PerpetualDiscount | +1.5661% | Now with a pre-tax bid-YTW of 5.12% based on a bid of 22.05 and a limitMaturity. |
| SLF.PR.E | PerpetualDiscount | +1.7471% | Now with a pre-tax bid-YTW of 5.15% based on a bid of 22.13 and a limitMaturity. |
| BAM.PR.I | OpRet | +1.7476% | Now with a pre-tax bid-YTW of 4.51% based on a bid of 26.20 and a call 2010-7-30 at 25.50. Compare with BAM.PR.J (5.32% to softMaturity 2018-3-30). |
| Volume Highlights | |||
| Issue | Index | Volume | Notes |
| PWF.PR.K | PerpetualDiscount | 121,885 | RBC crossed 110,000 at 23.15. Now with a pre-tax bid-YTW of 5.38% based on a bid of 23.15 and a limitMaturity. |
| GWO.PR.E | OpRet | 106,741 | Now with a pre-tax bid-YTW of 3.72% based on a bid of 25.89 and a call 2011-4-30 at 25.00. |
| MFC.PR.C | PerpetualDiscount | 83,815 | RBC crossed 31,200 at 22.64. Now with a pre-tax bid-YTW of 5.13% based on a bid of 22.26 and a limitMaturity. |
| TD.PR.Q | PerpetualPremium | 78,680 | Now with a pre-tax bid-YTW of 5.41% based on a bid of 25.45 and a limitMaturity. |
| CM.PR.I | PerpetualDiscount | 64,575 | National Bank crossed 38,900 at 20.90. Now with a pre-tax bid-YTW of 5.69% based on a bid of 20.86 and a limitMaturity. |
There were fourteen other index-included $25-pv-equivalent issues trading over 10,000 shares today.
