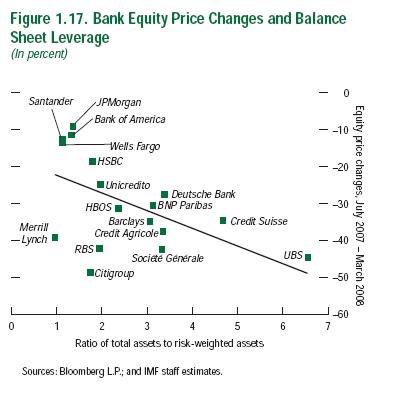
I have been fascinated with the IMF Global Financial Stability Report that was recently reviewed on PrefBlog … particularly Figure 1.17:
The IMF comments:
Some banks have rapidly expanded their balance sheets in recent years, largely by increasing their holdings of highly rated securities that carry low risk weightings for regulatory capital purposes (see Box 1.3 on page 31). Part of the increase in assets reflects banks’ trading and investment activities. Investments grew as a share of total assets, and wholesale markets, including securitizations used to finance such assets, grew as a share of total funding (Figure 1.16). Banks that adopted this strategy aggressively became more vulnerable to illiquidity in the wholesale money markets, earnings volatility from marked-to-market assets, and illiquidity in structured finance markets. Equity markets appear to be penalizing those banks that adopted this strategy most aggressively (Figure 1.17).
The variation in multiple for the banks listed is ENORMOUS. The new derisive nickname for UBS is Union Bank of Singapore … but what are the implications for Canadian banks?
First, let’s gather up the ratios for these banks:
| Assets to Risk-Weighted-Assets Ratios for Canadian Banks |
| |
RBC |
BNS |
TD |
BMO |
CIBC |
| Risk-Weighted Assets |
241,206 |
234,900 |
163,230 |
179,487 |
128,267 |
| Total Assets |
632,761 |
449,422 |
435,200 |
376,825 |
347,734 |
| Assets:RWA |
2.6 |
1.9 |
2.7 |
2.1 |
2.7 |
All the numbers are within the range for most banks – as reported by the IMF – but there are some fascinating differences that I might write about at another time.
Clearly, however, these differences can be significant and there is a clear indication that UBS was “gaming the system” by loading up with AAA assets that had no risk weight but – regardless of their investment merit – had, shall we say, considerable mark-to-market risk.
OSFI attempts to control such gaming by the imposition of an Assets-to-Capital multiple:
Institutions are expected to meet an assets to capital multiple test on a continuous basis. The assets to capital multiple is calculated by dividing the institution’s total assets, including specified off-balance sheet items, by the sum of its adjusted net tier 1 capital and adjusted tier 2 capital as defined in section 2.5 of this guideline. All items that are deducted from capital are excluded from total assets. Tier 3 capital is excluded from the test.
Off-balance sheet items for this test are direct credit substitutes1, including letters of credit and guarantees, transaction-related contingencies, trade-related contingencies and sale and repurchase agreements, as described in chapter 3. These are included at their notional principal amount. In the case of derivative contracts, where institutions have legally binding netting agreements (meeting the criteria established in chapter 3, Netting of Forwards, Swaps, Purchased Options and Other Similar Derivatives) the resulting on-balance sheet amounts can be netted for the purpose of calculating the assets to capital multiple.
Under this test, total assets should be no greater than 20 times capital, although this multiple can be exceeded with the Superintendent’s prior approval to an amount no greater than 23 times. Alternatively, the Superintendent may prescribe a lower multiple. In setting the assets to capital multiple for individual institutions, the Superintendent will consider such factors as operating and management experience, strength of parent, earnings, diversification of assets, type of assets and appetite for risk.
BMO is to be commended for disclosing its Asset-to-Capital multiple of 18.39, but I don’t see this number disclosed for any of the others. So … it will have to be done roughly, using the total assets from the table above, over the total regulatory capital:
| Assets to Risk-Weighted-Assets Ratios for Canadian Banks |
| |
RBC |
BNS |
TD |
BMO |
CIBC |
| Total Assets |
632,761 |
449,422 |
435,200 |
376,825 |
347,734 |
Total Regulatory Capital
Tier 1 + Tier 2 |
27,113 |
23,874 |
23,117 |
20,203 |
18,713 |
Very Rough
Assets-to-Capital
Multiple
(internal check) |
23.3
(23.3) |
18.8
(18.6) |
18.8
(19.0) |
18.7
(18.6) |
18.6
(18.5) |
Reported
Total Capital
Ratio |
11.2% |
10.2% |
14.2% |
11.3% |
14.6% |
| The internal check on the Assets-to-Capital multiple is the Assets-to-RWA multiple divided by the Total Capital Ratio. Variance will be due to rounding. |
Well! This is interesting! According to these very, very rough calculations, RBC has an Assets-to-Capital multiple of 23.3:1, which is both over the limit and well above its competitors. This may be a transient thing … there was a jump in assets in the first quarter:
RBC: Change in Assets
From 4Q07 to 1Q08 |
| Item |
Change ($-billion) |
| Securities |
+6 |
| Repos |
+12 |
| Loans |
+8 |
| Derivatives |
+7 |
| Total |
+33 |
I have sent the following message to RBC via their Investor Relations Page:
I would appreciate learning your Assets-to-Capital multiple (as defined by OSFI) as of the end of the first quarter, 2008, and any detail you can provide regarding its calculation.
I have derived a very rough estimate of 23.3:1, based on total assets of 632,761 and total regulatory capital of 27,113
Update, 2008-04-17: RBC has responded:
Thank you for your question about our assets to capital multiple (ACM). In keeping with prior quarter-end practice, we did not disclose our ACM in Q1/08 but were well within the OSFI minimum requirement. Our ACM is disclosed on a quarterly basis (with a 6-7 week lag) on OSFI’s website. We understand this should be available over the next few days. Below is an excerpt from the OSFI guidelines outlining the calculation of the ACM. We hope this helps.
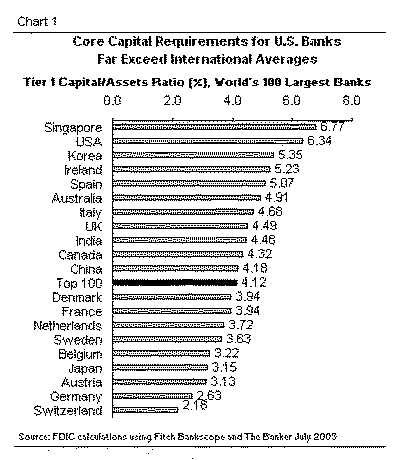
Update, 2008-6-4: From the FDIC publication, Estimating the Capital Impact of Basel II in the United States: