Assiduous Reader kaspu has complained about the volatility of the S&P/TSX Preferred Share Index (TXPR on Bloomberg) – or, at least, the reported volatility.
The problem is that this index is based on actual trades; hence, it can bounce around a lot when 100 shares trade at the ask, $1 above the bid. For instance, today:
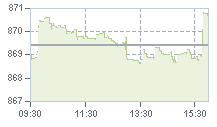
This sort of behaviour is endemic to indices created by small shops without much market knowledge or experience. Readers in need of indices with more precision may wish to use the HIMIPref™ Indices, which are, of course, based on much less volatile bid prices.
“Gummy” has announced a new spreadsheet, available from his website. This spreadsheet allows the download of bid and ask prices – and lots of other information – for stocks reported (with a 20 minute delay) by Yahoo. It strikes me that with minimal effort, one could reproduce TXPR (using the defined basket of CPD) and update the index at the touch of a button, with minimal set-up time required.
The Gummy Stuff website, by the way, is reliable AS FAR AS IT GOES. Dr. Ponzo is math-oriented to a much greater degree than investment-oriented and does not always respect hallowed fixed income market conventions. In other words, I have found that things are properly calculated in accordance with the (usually stated) assumptions, but these assumptions are not necessarily the ones I might make when performing a calculation with the same purpose.
With respect to Kaspu‘s question about other indices … the latest CPD literature references the “Desjardins Preferred Share Universe Index”, which is new to me … and I have no further information. Claymore may be preparing for a showdown with the TSX about licensing fees (you should find out what they want for DEX bond data … it’s a scandal).
Additionally, there is the BMO Capital Markets “50” index, but that is available only to Nesbitt clients … maybe at a library, if you have a really good one nearby that gets their preferred share reports.
Update, 2008-5-1: “Gummy” has announced a spreadsheet that does exactly this! Just watch out for dividend ex-Dates!
Ahhh! the first clue: “much less volatile bid prices”. I’ve always wondered why you use them. I imagined it might have something to do with how a pref owner would view his portfolio (“I could sell at ….”) — though this does not deal with the depth of the bid (# of shares), and I have seen times when the bid falls away to nothing (during the day).
1. What info do you have on the volatility of bid, ask and close prices? By how much is the bid less volatile?
2. For what other reasons do you prefer the bid?
3. Does knowing the bid lead to a daily-trading-volume-based estimate of a likely “ask” (through a “volume dependent normal spread”)?
4. Wouldn’t a “Fair Value” somehow estimated on the basis of Level II quotes with bids, asks and depths be of use to investors valuing a pref portfolio or considering what to bid or ask? A so-called “Fair Value” might depend on the portfolio holding — only own 100 shares? then use the bid; own 10,000 shares? then it could be a lot different.
Finally, I would warn against using Yahoo! as a data source for several reasons:
1. Although you can get delayed quotes on prefs, you can’t often get historical data from them
2. Sometimes the data fields download corrupted, despite being fine on-screen.
3. Even their indices have days missing (e.g. S&P-500, DJIA et al).
4. For stocks, splits and dividends are done inconsistently and sometimes incorrectly (i.e. some of the data is missing).
If these are not important, Yahoo! does have the advantage of being free.
1. I have no hard data on the relative volatilities of bid / ask / closing prices. The “close” is not a number I track (I will put it in the database if there is no bid or offer, but that doesn’t happen very often).
2. The bid is simply a better number. Preferreds trade, shall we say, intermittently. There is no reason to suppose that the price of a trade executed at 9:45am has any meaning at 4:00pm, but use of the close makes this assumption.
The volatility comes into this … we could have a two stock universe, constantly quoted at 25.00-25, but (if we use the last trade as the indicator of market price) the price differential between the two will vary from +25 to -25, depending on whether the trade immediately preceding the snapshot was done at the bid or offer. This makes no sense.
In backtesting HIMIPref™, I need to know where a trade could have been executed. It is a much better approximation to assume (within limits) that I could have sold at the bid and bought at the offer, than to assume I could trade in either direction at the close.
3. I use the ask prices as reported by the TSX.
4. You could get fancier, but I don’t think the game would be worth the candle. If you want to trade 10,000 shares, you do it through the institutional desk; this liquidity will simply not be reported anywhere on the TSX order book.
Y1. I get historical data from the TSX
Y2. If the download file is corrupt, the HIMIPref™ price input editor catches it and I fix it.
Y3. I don’t use historical data from Yahoo.
Y4. Not applicable to HIMIPref™ or to the intra-day index updating reported here.
Note that all these warnings (except #1) are applicable to extremely expensive data purchased direct from the exchange. Half the fun of being a quant is puzzling over a piece of trivial 10-year-old data and trying to decide whether it’s valid or not.