This would have been a better post yesterday, but I’ve never claimed to be much good at market timing!
The IMF has published its World Economic Outlook, October 2008, Financial Stress, Downturns, and Recoveries. There’s some very interesting data in Chapter Four, discussing “The Current Financial Crisis in Historical Context”.
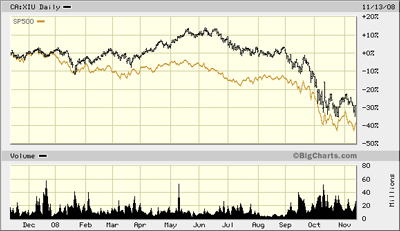
The global nature of the crisis as illustrated by this report has been discussed on FT-Alphaville on November 3, so I won’t repeat that stuff. Instead, I’ll show a chart of XIU vs. the S&P 500 for the past year:
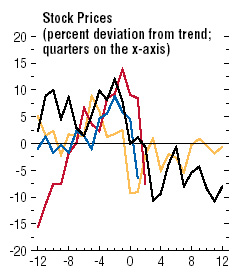
… and the IMF chart of equity returns …
… and a table from Stock Market Bubbles: Some Historical Perspective, by Achla Marathe and Edward Renshaw:
Declines of Three Percent or More in the S&P 500 Stock Price Index After it
Has Achieved a New All Time High Since September 7, 1929
                                          % Change S&P
      Date of         Value S&P Index   -----------------------------------------       Trading
-------------------   ---------------    Peak to   Peak to                            Day
   Peak      Trough    Peak    Trough    Peak      Trough      Duration
                        (1)      (2)      (3)        (4)       (5)n

 9/ 7/29    6/ 1/32   31.92     4.40**    ---      -86.2

10/ 6/54   10/29/54   32.76    31.68      2.6      - 3.3        10
 1/ 3/55    1/17/55   36.75    34.58     12.2$     - 5.9#       40H
 3/ 4/55    3/14/55   37.52    34.96      2.1$     - 6.8        19
 4/21/55    5/17/55   38.32*   36.97      2.1      - 3.5         7
 7/27/55    8/10/55   43.76    41.74     14.2      - 4.6#       37
 9/23/55   10/11/55   45.63    40.80      4.3      -10.6        13
11/14/55    1/23/56   46.41    43.11      1.7$     - 7.1         0
 3/20/56    5/28/56   48.87    44.10      5.3$     - 9.8         7
 8/ 2/56   10/22/57   49.74    38.98**    1.8      -21.6        13

11/17/58   11/25/58   53.24    51.02      7.0      - 4.2#       37
 1/21/59    2/ 9/59   56.04    53.58      5.3$     - 4.4#       27
 5/29/59    6/10/59   58.68    56.36      4.7      - 4.0#       61H
 8/ 3/59   10/25/60   60.71*   52.30**    3.5      -13.9        22

 4/17/61    4/24/61   66.68    64.40      9.8      - 3.4#       54H
 5/17/61    7/18/61   67.39E   64.41D     1.1      - 4.4         2
 9/ 6/61    9/25/61   68.46E   65.77D     1.6      - 3.9        22
12/12/61    6/26/62   72.64E*  52.32D**   6.1      -28.0        35

10/28/63   11/22/63   74.48    69.61      2.5      - 6.5        39
 5/12/64    6/ 8/64   81.16    78.64      9.0      - 3.1#      101H
 7/17/64    8/26/64   84.01    81.32      3.5      - 3.2#       15
11/20/64   12/15/64   86.28*   83.22      2.7      - 3.5        17
 5/13/65    6/28/65   90.27    81.60      4.6      - 9.6        81
 2/ 9/66   10/ 7/66   94.06    73.20**    4.2      -22.2        94

 5/ 8/67    6/ 5/67   94.58    88.43       .6      - 6.5         2
 8/ 4/67    8/28/67   95.83    92.64      1.3      - 3.3         4
 9/25/67    3/ 5/68   97.59    87.72      1.8$     -10.1         8
 7/11/68    8/ 2/68  102.39*   96.63      4.9      - 5.6        44H
11/29/68    5/26/70  108.37    69.29**    5.8      -36.1        38

 4/12/72    5/ 9/72  110.18   104.74D     1.7      - 4.9        24
 5/26/72    7/20/72  110.66   105.81D      .4      - 4.4         2
 8/14/72   10/16/72  112.55   106.77D     1.7      - 5.1         4
12/11/72   12/21/72  119.12*  115.11D     5.8      - 3.4#       26H
 1/11/73P  10/ 3/74  120.24    62.28D**    .9      -48.2         6
 8/22/80P   8/28/80  126.02   122.08      4.8$     - 3.1#       26H
 9/22/80P   9/29/80  130.40   123.54      3.5$     - 5.3        13
10/15/80P  10/30/80  133.70   126.29      2.5$     - 5.5         7
11/28/80P   8/12/82  140.52*  102.42**    5.1$     -27.1        11

11/ 9/82   11/23/82  143.02   132.93      1.8$     - 7.1         4
 1/10/83    1/24/83  146.78   139.97      2.6$     - 4.6         2
 6/22/83    8/ 8/83  170.99   159.18     16.5      - 6.9#       94H
10/10/83    7/24/84  172.65*  147.82**    1.0$     -14.4         0

 2/13/85    3/15/85  183.35   176.53      6.2$     - 3.7#       17
 6/ 6/85    6/13/85  191.06   185.33      4.2      - 3.0#       29
 7/17/85    9/25/85  195.65   180.66      2.4      - 7.7        13
 1/ 7/86    1/22/86  213.80*  203.49      9.3$     - 4.8#       37
 3/27/86    4/ 7/86  238.97   228.63     11.8      - 4.3#       37
 4/21/86    5/16/86  244.74   232.76      2.4$     - 4.9         3
 5/29/86    6/10/86  247.98   239.58      1.3$     - 3.4         2
 7/ 2/86    7/15/86  252.70   233.66      1.9      - 7.5         5
 9/ 4/86    9/29/86  253.83   229.91       .4$     - 9.4         6
12/ 2/86   12/31/86  254.00   242.17       .1$     - 4.7         0
 3/24/87    3/30/87  301.64   289.20     18.8      - 4.1#       53H
 4/ 6/87    5/20/87  301.95   278.21D      .1      - 7.9         0
 8/25/87   12/ 4/87  336.77   223.92**   11.5      -33.5        50

 9/ 1/89    9/14/89  353.73   343.16      5.0$     - 3.0#       27H
10/ 9/89    1/30/90  359.80   322.98      1.7$     -10.2         4
 6/ 4/90P   6/26/90  367.40   352.06      2.1$     - 4.2         4
 7/16/90P  10/11/90  368.95*  295.46**     .4      -19.9         0

 4/17/91    5/15/91  390.45   368.57      5.8      - 5.6#       43
 8/ 6/91    8/19/91  390.62   376.47       .0$     - 3.6         0
 8/28/91   10/ 9/91  396.64   376.80      1.5      - 5.0         4
11/13/91   11/29/91  397.41E* 375.22       .2      - 5.6         1
 1/15/92    4/ 8/92  420.77E  394.50      5.9      - 6.2        14
 8/ 3/92    8/24/92  425.09E  410.72      1.0$     - 3.4         3
 9/14/92   10/ 9/92  425.27E  402.66D      .0$     - 5.3         0
 2/ 4/93    2/18/93  449.56E  431.90      5.7      - 3.9#       51
 3/10/93    4/26/93  456.33E  433.54D     1.5$     - 5.0         2
 2/ 2/94    4/ 4/94  482.00E  438.92D     5.6      - 8.9       116
12/13/95    1/10/96  621.69   598.48D    29.0      - 3.7#      210H
 2/12/96    4/11/96  661.45   631.18D     6.4      - 4.6#       10
 5/24/96    7/24/96  678.51   626.65D     2.6$     - 7.6         9
11/18/96   12/16/96  757.03   720.98D    15.1G$    - 4.8#       51
 2/18/97             816.29         D     7.8G         ?        26
Footnotes for Table 20.1
(5)n. Number of additional trading days after the recovery to a first new
high to the last new high or peak date.
* Fourth new high to be followed by a three percent decline for the bull
market in question.
**A major bear market low.
$ identifies cases where the first new high was associated with a daily gain
of 1.1 percent or more.
#Cases where the peak to trough decline in column (4) is less than the
preceding peak to peak increase in column (3).
D identifies cases where the first new high occurred after a month when the
dividend yield for the S&P index was equal to 3.0 percent or less.
E identifies cases where the first new high occurred after a quarter when
the P/E ratio for the S&P index was equal to 20.50 or more.
G identifies peak to peak gains that may have encouraged Fed Chairman Alan
Greenspan to warn investors about the possibility of irrational exuberance.
H identifies the trading day duration record, without a cumulative decline
of three percent or more, for each bull market separated by cumulative
declines of 13 percent or more.
P identifies declines of three percent or more that occurred during years
containing a recessionary peak designated by the National Bureau of Economic
Research.
Source of basic data: The Practical Forecasters’ Almanac(Burr Ridge,
Illinois: Irwin, 1992), Table 3.05 and Standard and Poor’s Security
Price Index Record.
Update: See also this source:
S&P 500 Index:
March 24, 2000 closes at 1527.46 (Peak)
July 23, 2002 closes at 797.70 (Trough)
Percentage decline from Peak to Trough: 47.78%
and
from FAC Wealth Management.


