I believe that Rebecca Wilder is correct that I was misinterpreting the FDIC October 16 technical briefing.
The gist of the argument is that the fees don’t start until November 13.
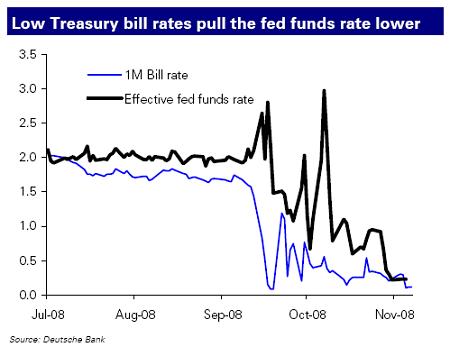
One of the commenters noted Deutsche Bank’s hypothesis, discussed on FT Alphaville:
The main reason for this inefficiency has been that Treasury yields are so low that funds leak from the Treasury bill market to the fed funds market. This suppresses the effective funds rate, as investors seek out the higher return until the spread between bills and fed funds compresses. Another reason is that non-banks can participate in the fed funds market, but are excluded from receiving interest on Federal Reserve balances, which are meant for depository institutions… If the agencies supplied these funds to the fed funds market, they would potentially drive the effective fed funds rate lower. Thus monetary policy has been more stimulative than the Fed has intended by setting the target rate, a symptom of an increasing loss of control over monetary conditions.
Rebecca Wilder also makes the supply and demand argument, with two major influences:
First, the huge influx of bank credit increased the reserve base for all banks, and in spite of a surge in excess reserves, the incentive to loan overnight funds grew. This is seen in the second column of the Table; as soon as the credit affecting reserves rose from $31 billion over the year on 9/10 to $275 billion over the year on 9/24, the effective funds rate traded well below its target by an average of 81 bps from 9/10 to 9/24 (the average of the daily spread, or the blue line, in the chart). And no interest was being paid during this period.
Second, as soon as interest was being paid on excess reserves, the GSEs and other banks that hold reserves with the Fed but do not qualify for the new reserve interest payments were forced to offer very low rates in order to sell the overnight funds. The announcement that the Fed would pay interest on reserves (IOR) went into effect on October 9. During that maintenance period, the average spread between the federal funds target and the effective federal funds rate grew to 68 bps. The GSEs forced the market rate downward with the excess supply of reserve balances.
I don’t understand her second point. Interest on Reserves should – and is intended to – boost the demand for reserves, not supply. What may have happened is a supply shock from the GSEs – the latest H.4.1 report shows that “Other” Deposits were $22.8-billion on November 5, an increase of $21.6-billion from October 29 … which is kind of a massive increase!
All this represents a straightforward supply and demand argument. In order for a supply and demand argument to work, we have to dispense with notions of infinite liquidity – we’ve been dispensing with this notion quite a lot in the past year! To nail this down, we have to ask ourselves – why would the big banks not simply bid, say, 90bp for an infinite amount of fed funds and take out a 10bp spread.
One reason might be balance sheet concerns. A borrow is still a borrow and a loan is still a loan, even if both are in the Fed Funds market. A deposit of Fed Funds to the Fed will not attract any risk weight, but will affect the leverage ratio. There may well be reasons for the banks to maintain their leverage ratios as low as possible – even on a daily basis, even with Fed Funds – at the moment.
Another reason might be simply availability of lines. According to the paper Systematic Illiquidity in the Federal Funds Market by Ashcraft & Duffie (Ashcraft’s paper on Understanding the Securitization of Subprime Mortgage Credit has been discussed on PrefBlog):
Two financial institutions can come into contact with each other by various methods in order to negotiate a loan. For example, a federal funds trader at one bank could call a federal funds trader at another bank and ask for quotes. The borrower and lender can also be placed in contact through a broker, although the final amount of a brokered loan is arranged by direct negotiation between the borrowing and lending bank. With our data, described in the next section, we are unable to distinguish which loans were brokered. In aggregate, approximately 27% of the volume of federal funds loans during 2005 were brokered. Based on conversations with market experts, we believe that brokerage of loans is less common among the largest banks, which are the focus of our study.
It should be noted that the authors were required to do a great deal of analysis to determine which FedWire payments were loans and which were other transactions – banks are not required to report their Fed Funds loans and borrows to any central authority. For example, consider this interview on the WSJ:
WSJ: All banks and thrifts qualify for discount window loans. Who participates in the fed funds market?
[Chief economist at Wrightson Associates] Lou Crandall: Almost all banks make use of fed funds transactions, though not necessarily through the brokered market you see quoted on screens. Smaller banks, which typically have surplus funds they want to lend to other banks in the interbank market, will typically often have a correspondent banking relationship with a larger bank, in which the large bank will borrow those funds every day either for its own purposes or to re-sell in the market. Those rolling contracts are booked as fed funds for call report purposes and so forth, but the rates on them aren’t included in the Fed’s effective fed funds rate calculation, which only reflects the brokered market.
This distinction between the “direct” market and the “brokered” market is confirmed by the New York Fed’s definition of the daily effective fed funds rate:
The daily effective federal funds rate is a volume-weighted average of rates on trades arranged by major brokers. The effective rate is calculated by the Federal Reserve Bank of New York using data provided by the brokers and is subject to revision.
So when we talk about the Effective Fed Funds Rate, we must bear in mind that we are only talking about brokered transactions – and I will assert that the Ascraft estimate of 27%-brokered is probably much higher than the ratio in the current market.
All this is pretty general, and I don’t have any magic explanations. I will suggest, however, that the immense volume of Fed Funds has simply overwhelmed the operational procedures set up in calmer times; accounts need to be opened, credit limits need to be increased, all the bureaucracy of modern banking has to be brought to bear on the issue before we can again deal with a situation in which liquidity may be approximated to “infinite”.
Update, 2008-11-11: Lou Crandall (or somebody claiming to be him!) has commented on the second Econbrowser post:
Just a quick clarification about FDIC insurance premiums and the fed funds rate. The new 75 basis point insurance premiums won’t go into effect until December, so they are not an explanation for the current low level of the effective funds rate. Our discussion (on the Wrightson ICAP site) of the indeterminacy of the funds rate in that future regime was hypothetical, as we still think there is a chance that the FDIC will choose to exclude overnight fed funds from the unsecured debt guarantee program. As for the current environment, the role of the GSEs and international institutions is in fact a sufficient explanation. Banks have no desire to expand their balance sheets, and so demand a large spread on the transaction before they are willing to accommodate GSEs and others who have surplus funds to dispose of. It’s a specific example of a general phenomenon: the hurdle rate on arbitrage trades has soared due to balance sheet constraints. That fact can be seen everywhere from the spread between the effective fed funds rate and the target in the overnight market to the negative swap spreads in the 20- to 30-year range that have appeared intermittently of late. Finance models that are based on a “no-arbitrage” assumption will need to be shelved, or at least tweaked, for the duration of the financial crisis.
So … he’s saying it’s balance sheet constraints and that it will be a long time until we can return to our comfortable assumptions of infinite liquidity.
2008-11-11, Update #2: This is attracting a lot of attention and Zubin Jelveh of Portfolio.com brings us the views of:
Action Economics’ Mike Englund who argues that there may not actually be one. For example, the average effective rate since the Fed started paying interest on reserves was 0.68 percent. The average excess rate over the same span was 0.70 percent. That’s pretty close and if you look at the last chart again, the market rate does seem to dance around the excess rate until the Fed lowered the target in late-October. Englund tries to explain this last part away:
Note that there is a speculative component to holding excess reserves, as the excess reserve rate for the [reserve maintenance period] RMP is pegged to the “lowest” target in the period, which is not precisely known until the last day of the period. This might explain some “bets” of emergency Fed easing late in the RMP that would lower the excess rate for the entire period, and hence leave a rate that trades through most of the period below the excess reserve “floor.”
I agree with Jelveh … the Englund explanation is not satisfying.
The Fed’s balance sheet continues to grow, with the latest H.4.1 release showing an increase of about $100-billion in Commercial Paper assets, funded by deposits – mainly from banks. However, LIBOR is now well below the Fed’s yield on paper:
The London interbank offered rate, or Libor, that banks say they charge one another for loans fell 10 basis points to 2.29 percent today, the lowest level since November 2004, the British Bankers’ Association said. The overnight rate held at a record low of 0.33 percent and the TED spread, a gauge of bank cash availability, dropped under 200 basis points for the first time since the day before Lehman Brothers Holdings Inc. collapsed.
The CPFF rate is now 1.54%, but there is a 100bp surcharge on top of that..
Today’s jobs number was icky:
The jobless rate rose to 6.5 percent in October from 6.1 percent the previous month, the Labor Department reported today in Washington. Employers cut 240,000 workers after a loss of 284,000 in September, the biggest two-month slide since 2001.
Econbrowser‘s James Hamilton provides a graph (which doesn’t look so good when re-sized for PrefBlog, so read the original post!):
The next battleground for do-over whining is GMAC SmartNotes:
Chuck Woodall, 66, who lives with his wife in Columbus, Ohio, amassed $200,000 of SmartNotes starting eight years ago, and they now equal about 25 percent of his investments. At the time, the securities were rated investment-grade and they paid more interest than government bonds or certificates of deposit. They also were backed by Detroit-based GM, the biggest U.S. automaker.
Woodall, a former owner of apparel stores and a pet-supply business, holds SmartNotes due in 2018 that he says have lost about 80 percent of their value. He said his Merrill broker told him that in more than 20 years, no client had lost money on bonds.
Sadly, the Bloomberg reporter didn’t ask ‘What the hell are you doing putting 25% of your entire portfolio in a single name?’
GM is in a bad way:
General Motors Corp., seeking federal aid to avoid collapse, said it may not have enough cash to keep operating this year and will fall “significantly short” of the amount needed by the end of June unless the auto market improves or it raises more capital.
…
GM’s $3 billion of 8.375 percent bonds due in 2033 tumbled about 4 cents to 24.4 cents on the dollar as of 11:46 a.m. in New York, according to Trace, the bond-price reporting system of the Financial Industry Regulatory Authority. The debt yields 34 percent, or about 30 percentage points more than similar- maturity Treasuries, Trace data show.
…
One-year credit-default swaps were quoted at a mid-price of 51 percentage points upfront, compared with 50 percentage points yesterday, CMA data show. That means it would cost $5.1 million initially in addition to $500,000 over one year to protect $10 million of GM bonds. The contracts reached as high as 52 percentage points upfront on Oct. 16.
I am certain that we are going to see a reprise of the Oshawa shuffle … Why should we subsidize them? Because they’re good jobs. Why are they good jobs? Because they’re subsidized.
A solid day for PerpetualDiscounts, up 20bp on the day to yield 6.85% pre-tax dividend, equivalent to 9.59% pre-tax interest at the standard 1.4x factor. Long corporates now yield about 7.55%, so the spread is 204bp.
Note that these indices are experimental; the absolute and relative daily values are expected to change in the final version. In this version, index values are based at 1,000.0 on 2006-6-30.
The Fixed-Reset index was added effective 2008-9-5 at that day’s closing value of 1,119.4 for the Fixed-Floater index. |
| Index |
Mean Current Yield (at bid) |
Mean YTW |
Mean Average Trading Value |
Mean Mod Dur (YTW) |
Issues |
Day’s Perf. |
Index Value |
| Ratchet |
N/A |
N/A |
N/A |
N/A |
0 |
N/A |
N/A |
| Fixed-Floater |
5.13% |
5.14% |
71,771 |
15.44 |
6 |
+1.3756% |
1,019.4 |
| Floater |
7.04% |
7.15% |
52,580 |
12.30 |
2 |
+1.5326% |
495.9 |
| Op. Retract |
5.25% |
5.83% |
135,097 |
3.98 |
15 |
+0.6890% |
1,006.5 |
| Split-Share |
6.28% |
10.65% |
58,010 |
3.97 |
12 |
+0.5225% |
940.2 |
| Interest Bearing |
7.95% |
13.61% |
58,857 |
3.25 |
3 |
+1.9680% |
892.6 |
| Perpetual-Premium |
N/A |
N/A |
N/A |
N/A |
N/A |
N/A |
N/A |
| Perpetual-Discount |
6.77% |
6.85% |
178,352 |
12.77 |
71 |
+0.2014% |
804.8 |
| Fixed-Reset |
5.37% |
5.14% |
1,013,076 |
15.11 |
12 |
+0.3062% |
1,084.3 |
| Major Price Changes |
| Issue |
Index |
Change |
Notes |
| FFN.PR.A |
SplitShare |
-5.1316% |
Asset coverage of 1.6-:1 as of October 31 according to the company. Now with a pre-tax bid-YTW of 11.97% based on a bid of 7.21 and a hardMaturity 2014-12-1 at 10.00. Closing quote of 7.21-69, 5×5. Day’s range of 7.05-60. |
| POW.PR.C |
PerpetualDiscount |
-3.7209% |
Now with a pre-tax bid-YTW of 7.10% based on a bid of 20.70 and a limitMaturity. Closing quote 20.70-14, 2×2. Day’s range 20.93-22.03. |
| PWF.PR.L |
PerpetualDiscount |
-2.8947% |
Now with a pre-tax bid-YTW of 6.98% based on a bid of 18.45 and a limitMaturity. Closing Quote 18.45-84, 5×4. Day’s range of 18.45-00. |
| SBN.PR.A |
SplitShare |
+2.5946% |
Asset coverage of 1.9+:1 as of October 31 according to Mulvihill. Now with a pre-tax bid-YTW of 7.40% based on a bid of 9.01 and a hardMaturity 2014-12-1 at 10.00. Closing quote of 9.01-50, 3×5. No trades today. |
| SLF.PR.A |
PerpetualDiscount |
-2.0000% |
Now with a pre-tax bid-YTW of 7.25% based on a bid of 16.66 and a limitMaturity. Closing Quote 16.66-90, 24×24. Day’s range of 16.86-14. |
| CM.PR.H |
PerpetualDiscount |
+2.1199% |
Now with a pre-tax bid-YTW of 7.20% based on a bid of 16.86 and a limitMaturity. Closing Quote 16.86-94, 4×2. Day’s range of 16.53-95. |
| TD.PR.N |
OpRet |
+2.4580% |
Now with a pre-tax bid-YTW of 4.63% based on a bid of 25.01 and a softMaturity 2014-1-30 at 25.00. Closing quote of 25.01-26.14, 3×11. No trades today. |
| BMO.PR.H |
PerpetualDiscount |
+2.5428% |
Now with a pre-tax bid-YTW of 6.73% based on a bid of 19.76 and a limitMaturity. Closing Quote 19.76-95, 3×3. Day’s range of 19.51-98. |
| BSD.PR.A |
InterestBearing |
+2.6891% |
Asset coverage of 1.0+:1 as of October 31, according to Brookfield Funds. Now with a pre-tax bid-YTW of 16.39% based on a bid of 6.11 and a hardMaturity 2015-3-31 at 10.00. Closing quote of 6.11-21, 4×23. Day’s range of 6.17-21. |
| FIG.PR.A |
InterestBearing |
+3.1637% |
Asset coverage of 1.3+:1 based on Capital Units NAV of 4.56 on November 6 and 0.71 Capital Units per Preferred. Now with a pre-tax bid-YTW of 12.44% based on a bid of 7.50 and a hardMaturity 2014-12-31 at 10.00. Closing quote of 7.50-73, 29×30. Day’s range of 7.31-51. |
| BCE.PR.Y |
FixFloat |
+3.2184% |
|
| BCE.PR.A |
FixFloat |
+3.3992% |
|
| FTN.PR.A |
SplitShare |
+3.6269% |
Asset coverage of 1.9-:1 as of October 31, according to the company. Now with a pre-tax bid-YTW of 9.26% based on a bid of 8.00 and a hardMaturity 2015-12-1 at 10.00. Closing quote of 8.00-13, 39×3. Day’s range of 7.70-15. |
| MFC.PR.C |
PerpetualDiscount |
+3.9759% |
Now with a pre-tax bid-YTW of 6.64% based on a bid of 17.26 and a limitMaturity. Closing Quote 17.26-40, 3×8. Day’s range of 16.60-40. |
| BCE.PR.R |
FixFloat |
+4.6062% |
|
| BNA.PR.C |
SplitShare |
+7.6864% |
Asset coverage of just under 2.8:1 as of September 30 according to the company. Coverage now of 2.1-:1 based on BAM.A at 21.38 and 2.4 BAM.A held per preferred. Now with a pre-tax bid-YTW of 12.20% based on a bid of 14.01 and a hardMaturity 2019-1-10 at 25.00. Compare with BNA.PR.A (17.46% to 2010-9-30) and BNA.PR.B (10.08% to 2016-3-25). Closing quote 14.01-94, 2×7. Day’s range 13.20-14.49. |
| Volume Highlights |
| Issue |
Index |
Volume |
Notes |
| CM.PR.I |
PerpetualDiscount |
168,254 |
Nesbitt crossed 150,000 at 16.50. Now with a pre-tax bid-YTW of 7.13% based on a bid of 16.65 and a limitMaturity. |
| RY.PR.L |
Fixed-Reset |
133,900 |
TD bought 10,300 from anonymous at 24.93; RBC bought 11,600 from Nesbitt at 24.95; TD bought 11,500 from National at 24.99. New Issue settled Nov. 3 |
| TD.PR.C |
Fixed-Reset |
54,450 |
New issue settled Nov. 5 |
| BCE.PR.C |
FixFloat |
43,600 |
TD crossed 19,400 at 22.10; CIBC crossed 20,000 at 22.50. |
| BMO.PR.M |
Fixed-Reset |
37,240 |
Nesbitt crossed 25,000 at 23.60. |
There were twenty-nine other index-included $25-pv-equivalent issues trading over 10,000 shares today.
DBRS has announced that it:
has today changed the trend on the ratings of Manulife Financial Corporation (Manulife or the Company) and its affiliates to Stable from Positive, including the Company’s AA Issuer Rating and R-1 (middle) Commercial Paper rating.
In light of the equity market deterioration through the third quarter of 2008 and into October and November, Manulife has become increasingly exposed under its variable annuity and segregated fund guarantees, requiring both additional actuarial reserve development and regulatory capital for its major operating subsidiary, The Manufacturers Life Insurance Company (MLI). Even though Manulife managed to increase MLI’s available regulatory capital in the third quarter, the increased capital requirement for the market-related guarantees increased at a faster pace, reducing the minimum continuing capital and surplus requirement (MCCSR) ratio to 193% from 200% at the end of the second quarter. Since that time, the Office of the Superintendent of Financial Institutions (OSFI) has revised the required capital to be held against such guarantees to the Company’s advantage and Manulife has arranged a $3 billion credit facility with the six major Canadian banks, $2 billion of which is expected to be injected into MLI as Tier 1 capital. Following the 20% decline in North American equity markets in the month of October, the MCCSR ratio would now be 225% on a pro forma basis. A further 10% decline in equity markets would reduce the MCCSR ratio by an estimated 20 percentage points.
Even though DBRS remains confident that Manulife is well positioned to be one of the strongest credits in the financial services sector, the Company’s overexposure to the current softness in global equity markets by virtue of these product guarantees and the associated economic uncertainty suggests that a Positive trend is, for the time being, no longer appropriate.
The rating trend was changed from Stable to Positive on July 8, 2008, reflecting the Company’s strong earnings performance since the acquisition of John Hancock Financial Services, Inc. in 2004, its advantageous strategic positions in selected diverse products and geographic market segments and its consistency in being among the first to introduce new and innovative products, tempered by effective risk and expense management controls and the most conservative capitalization of its peer group. With the recent increase in financial leverage, taking the total debt ratio to just below 25%, Manulife’s capitalization is no longer more conservative than others in the industry, but it is still within the accepted DBRS level for the current ratings.
The prior trend change to positive was reported by PrefBlog in July.
It is most interesting to speculate as to whether we will see Fixed-Reset issuance from MFC in the near future. The press release announcing the $3-billion term loan stated:
MFC today also announced that it has executed a binding credit agreement with the six largest Canadian banks to provide a 5-year term loan of $3 billion. The loan will be fully drawn down by November 20, 2008, and will be deployed, as necessary, to provide additional regulatory capital for its operating subsidiaries.
So … how will they pay off the loan? I see from the 3Q08 Slides that the loan is at a rate of BAs+380bp and is fully prepayable.
All three issues are tracked by HIMIPref™. MFC.PR.A is included in the OperatingRetractible index; MFC.PR.B and MFC.PR.C are members of the PerpetualDiscount index.
OSFI has released a proposed Framework for a New Standard Approach to Setting Capital Requirements
This paper proposes a new standard approach to determine how much capital a Canadian life insurance company should be required to have on hand in order to be able to meet its obligations. The proposed framework is consistent with the “Canadian Vision for Life Insurer Solvency Assessment,” endorsed by the Office of the Superintendent of Financial Institutions (OSFI) and Autorité des marchés financiers (AMF). It uses a target asset requirement approach1, meaning that insurance companies would be required to hold assets equal to the sum of the best estimate of their insurance obligations and a solvency buffer.
They note that:
The current MCCSR does not adequately account for risk concentration and risk diversification. Nor does it provide explicitly for operational risk. These areas will also need to be considered in the updated standard approach. However, implementation may be later than for credit, market, and insurance requirements.
In yet another example of OSFI’s contempt for investors – who are the ones supposed to be supplying the market discipline. Remember? – they restrict participation in the discussions to industry:
We will now be preparing more detailed papers on market, credit, insurance and operational risk. We will ask the industry for comments on each paper and for participation in quantitative impact studies.
Further:
The framework will consider in the future the possible recognition of concentration or diversification of risk.
We can only hope that this is the NEAR future! It is not clear to me how a rational determination of the credit risk of a portfolio can be made without considering concentration risk, but maybe that’s just me.
There were massive rate cuts in Europe:
The Bank of England led European central banks in reducing borrowing costs to counter the worst financial crisis in almost a century, cutting its key rate by 1.5 percentage points to the lowest level since 1955.
The U.K. central bank reduced its key rate by the most since 1992, taking it to 3 percent. The European Central Bank lowered its benchmark by 50 basis points to 3.25 percent and Swiss policy makers cut their main lending rate by the same margin to 2 percent after an unscheduled meeting.
The BoE press release is unusually sombre:
Since mid-September, the global banking system has experienced its most serious disruption for almost a century. While the measures taken on bank capital, funding and liquidity in several countries, including our own, have begun to ease the situation, the availability of credit to households and businesses is likely to remain restricted for some time. As a consequence, money and credit conditions have tightened sharply. Equity prices have fallen substantially in many countries.
In the United Kingdom, output fell sharply in the third quarter. Business surveys and reports by the Bank’s regional Agents point to continued severe contraction in the near term. Consumer spending has faltered in the face of a squeeze on household budgets and tighter credit. Residential investment has fallen sharply and the prospects for business investment have weakened. Economic conditions have also deteriorated in the UK’s main export markets.
With the expansion of the Fed’s balance sheet comes an extraordinary level of Treasury issuance:
Over the October – December 2008 quarter, the Treasury expects to borrow $550 billion of marketable debt, assuming an end-of-December cash balance of $300 billion, which includes $260 billion for the Supplementary Financing Program (SFP). Without the SFP, the end-of-December cash balance is expected to be $40 billion. This borrowing estimate is $408 billion higher than announced in July 2008. The increase in borrowing is primarily due to higher outlays related to economic assistance programs, lower receipts, and lower net issuances of State and Local Government Series securities.
Over the January – March 2009 quarter, the Treasury expects to borrow $368 billion of marketable debt, assuming an end-of-March cash balance of $75 billion.
This issuance is causing dislocation in the Treasury yield curve:
One trader pointed out some amazing anomalies on the 3 year /4 year portion of the curve. For instance, one can sell the 3 3/8s of November 2012 and buy the new 3 year (November 2011) at even yield. The curve is quite steep so unless one expects dramatic flattening soon that trader is a winner,
Similarly, an investor can sell the 4 1/4s September 2012 and buy a combination of three year notes and 5 year notes and pick up 88 basis points of gross yield. That just does not make sense and anyone owning those bonds should sell them in favor of most anything else.
There are rumours GMAC will become a bank:
Cerberus is weighing a plan to distribute its GMAC stake to investors in its private-equity funds, according to the people, who declined to be identified because the deliberations aren’t public. The tactic, one of several options under discussion, may enable Detroit-based GMAC to become a bank and get funding from the U.S. Treasury and Federal Reserve without subjecting Cerberus to banking regulations.
In a bit of good news Wells Farge raised significant equity:
Wells Fargo & Co., the biggest bank on the U.S. West Coast, raised $11 billion in a stock sale to help fund its purchase of Wachovia Corp., exceeding its estimate for the offering.
The bank sold 407.5 million shares for $27 each, 6.2 percent below today’s closing price of $28.77, according to a company statement. The company may sell an additional 61 million shares if demand warrants. The San Francisco-based lender had planned to raise $10 billion.
The U.S. Treasury bought $25 billion of Wells Fargo’s preferred shares in October as part of its rescue of the banking industry. Wells Fargo is expanding its deposit base to the East Coast and creating the biggest U.S. bank by branches with its purchase of Charlotte, North Carolina-based Wachovia.
Wells Fargo joins other banks in raising capital, including JPMorgan Chase & Co’s $11.5 billion offering in September and $10 billion pulled in by Bank of America Corp. in October.
A day enlivened by news of the new GWO Fixed-Reset 6.00%+307 issue; PerpetualDiscounts gave up some of the gains they made in the first part of the week. Volume remained vigorous.
Note that these indices are experimental; the absolute and relative daily values are expected to change in the final version. In this version, index values are based at 1,000.0 on 2006-6-30.
The Fixed-Reset index was added effective 2008-9-5 at that day’s closing value of 1,119.4 for the Fixed-Floater index. |
| Index |
Mean Current Yield (at bid) |
Mean YTW |
Mean Average Trading Value |
Mean Mod Dur (YTW) |
Issues |
Day’s Perf. |
Index Value |
| Ratchet |
N/A |
N/A |
N/A |
N/A |
0 |
N/A |
N/A |
| Fixed-Floater |
5.20% |
5.23% |
69,022 |
15.32 |
6 |
+2.2961% |
1,005.5 |
| Floater |
7.14% |
7.26% |
52,851 |
12.18 |
2 |
-3.2164% |
488.4 |
| Op. Retract |
5.29% |
6.03% |
135,941 |
3.98 |
15 |
+0.0596% |
999.6 |
| Split-Share |
6.31% |
10.70% |
58,374 |
3.94 |
12 |
-0.8761% |
935.3 |
| Interest Bearing |
8.10% |
14.17% |
59,414 |
3.21 |
3 |
-0.5261% |
875.3 |
| Perpetual-Premium |
N/A |
N/A |
N/A |
N/A |
N/A |
N/A |
N/A |
| Perpetual-Discount |
6.79% |
6.86% |
178,964 |
12.76 |
71 |
-0.9708% |
803.2 |
| Fixed-Reset |
5.39% |
5.16% |
1,030,535 |
15.09 |
12 |
-0.4709% |
1,081.0 |
| Major Price Changes |
| Issue |
Index |
Change |
Notes |
| FTN.PR.A |
SplitShare |
-7.7658% |
Asset coverage of 1.9-:1 as of October 31, according to the company. Now with a pre-tax bid-YTW of 9.91% based on a bid of 7.72 and a hardMaturity 2015-12-1 at 10.00. Closing quote of 7.72-00, 5×6. Day’s range of 7.66-8.22 |
| GWO.PR.I |
PerpetualDiscount |
-5.7382% |
Now with a pre-tax bid-YTW of 7.26% based on a bid of 15.77 and a limitMaturity. Closing quote 15.77-29, 3×4. Day’s range 15.76-71. |
| BAM.PR.B |
Floater |
-5.2684% |
|
| MFC.PR.C |
PerpetualDiscount |
-4.4879% |
Now with a pre-tax bid-YTW of 6.91% based on a bid of 16.60 and a limitMaturity. Closing Quote 16.60-73, 12×3. Day’s range of 16.60-45. |
| PWF.PR.I |
PerpetualDiscount |
-4.3043% |
Now with a pre-tax bid-YTW of 6.87% based on a bid of 22.01 and a limitMaturity. Closing Quote 22.01-23.50, 8×16. Day’s range of 22.01-23.50. |
| RY.PR.E |
PerpetualDiscount |
-4.0437% |
Now with a pre-tax bid-YTW of 6.44% based on a bid of 17.56 and a limitMaturity. Closing Quote 17.56-79, 3×4. Day’s range of 17.41-18.64. |
| BSD.PR.A |
InterestBearing |
-4.0323% |
Asset coverage of 1.0+:1 as of October 31, according to Brookfield Funds. Now with a pre-tax bid-YTW of 16.97% based on a bid of 5.95 and a hardMaturity 2015-3-31 at 10.00. Closing quote of 5.95-99, 87×1. Day’s range of 5.90-15. |
| PWF.PR.K |
PerpetualDiscount |
-3.2520% |
Now with a pre-tax bid-YTW of 7.00% based on a bid of 17.85 and a limitMaturity. Closing Quote 17.85-00, 5×12. Day’s range of 17.85-45. |
| ELF.PR.G |
PerpetualDiscount |
-3.0243% |
Now with a pre-tax bid-YTW of 8.17% based on a bid of 14.75 and a limitMaturity. Closing Quote 14.75-94, 8×5. Day’s range of 14.75-50. |
| RY.PR.G |
PerpetualDiscount |
-2.7933% |
Now with a pre-tax bid-YTW of 6.50% based on a bid of 17.40 and a limitMaturity. Closing Quote 17.40-85, 10×12. Day’s range of 17.25-96. |
| GWO.PR.H |
PerpetualDiscount |
-2.7778% |
Now with a pre-tax bid-YTW of 7.05% based on a bid of 17.50 and a limitMaturity. Closing Quote 17.50-94, 2×2. Day’s range of 17.50-25. |
| RY.PR.A |
PerpetualDiscount |
-2.6752% |
Now with a pre-tax bid-YTW of 6.14% based on a bid of 18.19 and a limitMaturity. Closing Quote 18.19-52, 1×4. Day’s range of 18.00-33. |
| BNA.PR.B |
SplitShare |
-2.4582% |
Asset coverage of just under 2.8:1 as of September 30 according to the company. Coverage now of 2.0-:1 based on BAM.A at 20.80 and 2.4 BAM.A held per preferred. Now with a pre-tax bid-YTW of 10.14% based on a bid of 18.65 and a hardMaturity 2016-3-25 at 25.00. Compare with BNA.PR.A (17.29% to 2010-9-30) and BNA.PR.C (13.28% to 2019-1-10). Closing quote 18.65-96, 16×12. Day’s range 18.26-50. |
| POW.PR.A |
PerpetualDiscount |
-2.4085% |
Now with a pre-tax bid-YTW of 7.00% based on a bid of 20.26 and a limitMaturity. Closing Quote 20.26-99, 1×2. Day’s range of 20.00-99. |
| CIU.PR.A |
PerpetualDiscount |
-2.2005% |
Now with a pre-tax bid-YTW of 7.21% based on a bid of 18.50 and a limitMaturity. Closing Quote 16.00-25, 2×15. Day’s range of 16.27-50. |
| BAM.PR.J |
OpRet |
-2.1739% |
Now with a pre-tax bid-YTW of 10.28% based on a bid of 18.00 and a softMaturity 2018-3-30 at 25.00. Compare with BAM.PR.H (9.24% to 2012-3-30), BAM.PR.I (9.96% to 2013-12-30) and BAM.PR.O (10.48% to 2013-6-30) and the perpetuals at 9.44%. Closing quote of 18.00-30, 2×3. Day’s range of 18.00-50. |
| BCE.PR.R |
FixFloat |
+2.3091% |
|
| SBN.PR.A |
SplitShare |
+2.6637% |
Asset coverage of 1.9+:1 as of October 31 according to Mulvihill. Now with a pre-tax bid-YTW of 6.87% based on a bid of 9.25 and a hardMaturity 2014-12-1 at 10.00. Closing quote of 9.25-50, 7×1. Both trades today at 9.25. |
| BCE.PR.I |
FixFloat |
+2.7353% |
|
| BNA.PR.C |
SplitShare |
+4.1633% |
See BNA.PR.B, above. Closing quote of 13.01-40, 10×7. Day’s range of 12.60-40. |
| BCE.PR.Z |
FixFloat |
+4.2677% |
|
| BCE.PR.G |
FixFloat |
+4.3333% |
|
| Volume Highlights |
| Issue |
Index |
Volume |
Notes |
| GWO.PR.G |
PerpetualDiscount |
283,039 |
Nesbitt crossed 250,000 at 19.70, then another 17,000 at the same price. Now with a pre-tax bid-YTW of 6.77% based on a bid of 19.51 and a limitMaturity. |
| TD.PR.C |
Fixed-Reset |
147,200 |
New issue settled Nov. 5 |
| TD.PR.N |
Fixed-Reset |
85,800 |
CIBC crossed 33,800 at 25.00, then another 50,000 at the same price. |
| CM.PR.A |
OpRet |
70,000 |
TD crossed 33,000 at 25.35, then another (the same?) 33,000 at the same price. Now with a pre-tax bid-YTW of 4.95% based on a bid of 25.28 and a softMaturity 2011-7-30 at 25.00. |
| MFC.PR.A |
OpRet |
68,975 |
CIBC crossed 47,200 at 24.30. Now with a pre-tax bid-YTW of 5.02% based on a bid of 23.81 and a softMaturity 2015-12-18 at 25.00. |
There were thirty-three other index-included $25-pv-equivalent issues trading over 10,000 shares today.
Connor Clark & Lunn has announced:
ROC Pref Corp. (the “Company”) announced today the implementation of restructuring initiatives by Connor, Clark & Lunn Capital Markets Inc. (the “Manager”) and Connor, Clark & Lunn Investment Management Ltd. (the “Investment Manager”) which acts as investment manager to Credit Trust IV. Credit Trust IV owns the credit linked note issued by Scotiabank to which the Company has exposure. The initiatives have been undertaken in order to increase the likelihood that the Company will be able to repay the $25.00 preferred share issue price at maturity.
In this regard:
1. For the next three quarters the underlying coupons payable under the credit linked note have been sold to The Bank of Nova Scotia to buy additional subordination (additional subordination increases the “safety cushion” by increasing the number of defaults the reference portfolio can withstand before principal and interest payments on the credit linked note are adversely affected). As a result of these changes, the dividends on the preferred shares of the Company have been suspended commencing with the December 31, 2008 dividend.
Regular quarterly dividends are expected to be reinstituted in respect of the quarter ending September 30, 2009. As a result of these actions, the Manager will ask Standard & Poors to withdraw its rating on the preferred shares as the rating applies to the payment of all dividends.
2. The deferred management fee has been made available for the benefit of the preferred shareholders.
As a result of the purchase of additional subordination approximately 0.5 additional defaults have been added to the number of defaults the note can sustain before payments of coupon and principal are affected. As a result, a total of 5.4 defaults among the companies in the credit linked note’s reference portfolio can be sustained before payments under the credit linked
note are impacted.
The following payout table, which assumes a recovery rate on default of 40%, is provided:
| RPQ.PR.A Payout |
Additional
Defaults |
Estimated
Maturity
Payout |
| 5.0 or less |
$25.00 |
| 5.4 |
$25.00 |
| 6.0 |
15.20 |
| 7.0 or more |
$0.00 |
According to Connor Clark, there were 138 names in the portfolio as of September 30, with the following (truncated) credit distribution:
RPQ.PR.A Underlying Credit Distribution
(Truncated by JH) |
Credit
Rating |
Number
of Names |
| BB+ |
2.5 |
| BB |
7.0 |
| BB- |
3.0 |
| B+ |
2.5 |
| B- |
3.0 |
According to the company the NAV was $5.93 as of October 31. The Prospectus has the following language:
Preferred Shares may be surrendered for retraction at any time but will be
retracted only on the last day of the month (a ‘‘Valuation Date’’) commencing August 31, 2004. Preferred Shares surrendered for retraction by a Holder at least five (5) Business Days prior to a Valuation Date will be retracted on such Valuation Date and such holder will receive payment on or before the tenth Business Day following such Valuation Date. On a retraction, Holders will be entitled to receive a retraction price per share (the ‘‘Preferred Share Retraction Price’’) equal to 95% of the net asset value per Preferred Share determined as of the relevant Valuation Date less $0.25. As this Preferred Share Retraction Price may be less than $25.00 and will vary
depending on the net asset value at the time of retraction, the S&P rating of the Preferred Shares does not extend to the amount payable on a retraction. See ‘‘Details of the Offering — Certain Provisions of the Preferred Shares — Retraction’’ and ‘‘Details of the Offering — Suspension of Redemption or Retractions of Preferred Shares’’.
According to the latest semi-annual report:
No Preferred Shares were retracted or redeemed during the period from June 2, 2004 (inception date) to March 31, 2008.
RPQ.PR.A closed today on the TSX at 3.31-4.35, 4×10. Drooling arbitrageurs should check for themselves whether retractions have been suspended, or under what conditions they might be!
RPQ.PR.A was last mentioned on PrefBlog with respect to S&P’s Credit-Watch-Negative. The issue is not tracked by HIMIPref™.
CC&L Group has announced:
the implementation of restructuring initiatives by Connor, Clark & Lunn Capital Markets Inc. (the “Manager”) and Connor, Clark & Lunn Investment Management Ltd. (the “Investment Manager”) which acts as investment manager to Credit Trust III. Credit Trust III owns the credit linked note issued by TD Bank to which the Company has exposure. The initiatives have been undertaken in order to increase the likelihood that the Company will be able to repay the $25.00 preferred share issue price at maturity.
In this regard:
1. The trading reserve account has been used to buy additional subordination in the credit linked note (additional subordination increases the “safety cushion” by increasing the number of defaults the reference portfolio can withstand before principal and interest payments on the note are adversely affected).
2. For the next three quarters the coupons on the credit linked note have been sold to TD Bank in exchange for additional subordination. As a result, dividends on the preferred shares of the Company have been suspended commencing with the December 31, 2008 dividend. Regular quarterly dividends are expected to be re-instated in respect of the quarter ending September 30, 2009. The manager will ask Standard & Poors to withdraw its rating on the preferred shares as the rating applies to the payment of all dividends.
3. The deferred management fee has been made available for the benefit of the preferred shareholders.
The following pay-off table is provided:
| RPB.PR.A Payoff Table |
Additional
Defaults |
Estimated
Maturity
Payout |
| 4.0 or less |
$25.00 |
| 4.1 |
$25.00 |
| 5.0 |
13.92 |
| 6.0 |
1.92 |
| 6.2 |
$0.00 |
According to the company, there were 125 names in the portfolio as of September 30, of which 5 have defaulted. The non-defaulted issues have the credit distribution:
RPB.PR.A Credit Distribution
(Truncated by JH) |
Credit
Rating |
Number
of Names |
| BB+ |
3.5 |
| BB |
4.0 |
| BB- |
1.0 |
| B+ |
4.0 |
| B |
1.0 |
| B- |
3.0 |
| CCC/C |
1.0 |
The NAV is $2.97 as of October 31. Interestingly, the prospectus includes the language:
Preferred Shares may be surrendered for retraction at any time but will be retracted only on the last day of the month (a ‘‘Valuation Date’’) commencing June 30, 2005. Preferred Shares surrendered for retraction by a Holder at least five (5) Business Days prior to a Valuation Date will be retracted on such Valuation Date and such holder will receive payment on or before the tenth Business Day following such Valuation Date. On a retraction, Holders will be entitled to receive a retraction price per share (the ‘‘Preferred Share Retraction Price’’) equal to 95% of the net asset value per Preferred Share determined as of the relevant Valuation Date less $0.25. As this Preferred Share Retraction Price may be less than $25.00 and will vary depending on the net asset value at the time of retraction, the S&P rating of the Preferred Shares does not extend to the amount payable on a retraction. See ‘‘Details of the Offering — Certain Provisions of the Preferred Shares — Retraction’’ and ‘‘Details of the Offering — Suspension of Redemption or Retractions of Preferred Shares’’.
The issue’s closing quote today was 1.70-75, 3×87. The TSX reports 10.248-million shares currently outstanding, a slight decline from the 10.342-million shares outstanding as of June 30. Shares redeemed in the twelve months to June 2008 were 18,900.
I’m not aware of redemptions having been suspended … but anyone drooling at the arbitrage had better check!
RPB.PR.A is not tracked by HIMIPref™. It was last mentioned on PrefBlog in connection with the Fannie/Freddie Credit Event.
CIX Split Corp. has announced:
that it was precluded by the terms of the Class A Shares from declaring a dividend of $0.07 per Class A Share to holders of record as at November 15, 2008. According to the terms of the Class A Shares, a dividend cannot be paid thereon when the net asset value per unit (one Class A Share and one Priority Equity Share, together) is equal to or less than $15.00. As of the close of business on November 5, 2008, the net asset value per unit was $13.53. A distribution of $0.04167 per Priority Equity Share payable on November 30, 2008 to shareholders of record as at November 15, 2008 will still be paid.
The Corporation’s Priority Equity Shares and Class A Shares are listed on the Toronto Stock Exchange under the symbol CXC.PR.A and CXC respectively.
CXC.PR.A was last mentioned on PrefBlog amidst rumours of a takeover of CI Financial, shares of which are the split corporations only portfolio investment.
CXC.PR.A is not tracked by HIMIPref™.