Archive for January, 2009

NYT Piece on Value at Risk

Wednesday, January 28th, 2009

I read this a while ago … was looking for it in my “notes” (as I refer to the Interesting External Papers category of PrefBlog … and couldn’t find it!

Anyway, Joe Nocera of the New York Times wrote an excellent feature article on Value at Risk: Risk Mismanagement.

The major point to be understood is that management of Goldman Sachs used VaR in an intelligent manner:

in December 2006, Goldman’s various indicators, including VaR and other risk models, began suggesting that something was wrong. Not hugely wrong, mind you, but wrong enough to warrant a closer look.

“We look at the P.& L. of our businesses every day,” said Goldman Sachs’ chief financial officer, David Viniar, when I went to see him recently to hear the story for myself. (P.& L. stands for profit and loss.) “We have lots of models here that are important, but none are more important than the P.& L., and we check every day to make sure our P.& L. is consistent with where our risk models say it should be. In December our mortgage business lost money for 10 days in a row. It wasn’t a lot of money, but by the 10th day we thought that we should sit down and talk about it.”

So Goldman called a meeting of about 15 people, including several risk managers and the senior people on the various trading desks. They examined a thick report that included every trading position the firm held. For the next three hours, they pored over everything. They examined their VaR numbers and their other risk models. They talked about how the mortgage-backed securities market “felt.” “Our guys said that it felt like it was going to get worse before it got better,” Viniar recalled. “So we made a decision: let’s get closer to home.”

Various other elements of VaR and its critiques have been referenced in An Early Debate on Value at Risk.

The main problem as I see it is that VaR does not – and cannot – account for trends. If, for instance, you measure your daily VaR based on data from, say, an environment of steadily increasing real-estate prices, that tells you nothing – NOTHING! – about what happens when they decline. Especially if they decline suddenly and interact with factors not in your model, such as “jingle mail”.

And the other problem is – as Taleb appears to have made a career out of saying – fat tails and black swans.

January 28, 2009

Wednesday, January 28th, 2009

Pussycat, in a desperate attempt to sound tough, is putting What-Debt? on “probation”:

[Pussycat] said his party is prepared to “swallow hard” and support the Conservative government, provided they agree to table regular updates outlining how they are living up to their commitments outlined in the federal budget.

We have now officially forgotten the lesson of hitting the wall in 1994 – I confidently predict twenty years of deficits until we hit the wall again.

Rubin has spoken out against fair-value accounting:

“I spent my whole life at Goldman Sachs believing in mark- to-market accounting, and having said that, if you look at the experience from the last two years, I think mark-to-market accounting has led to terrible vicious cycles in asset prices,” Rubin, the former U.S. Treasury secretary, said during a discussion at the 92nd St. YMCA late yesterday.

Companies including Citigroup and American International Group Inc. say mark-to-market, also known as fair-value accounting, doesn’t work when few buyers are willing to trade assets like subprime mortgages. Proponents such as the U.S. Financial Accounting Standards Board say the rule adds to transparency and gives investors information about companies.

Under reserve accounting, assets like loans are carried at cost, offset by reserves for potential losses.

I have stated many times that the regulatory regime should differentiate between banks and investment firms. Fair value accounting is appropriate for investment firms, at which the default assumption is that they hold assets for a short period, then sell them. Reserve accounting is often (though not always) more appropriate for banks, at which the default assumption is that they hold assets until maturity.

The FOMC released its monetary policy statement today – no real surprises.

The BoC has released an analysis of bond auction formats by Olivier Armantier and Nourredine Lafhel, examining the methods by which bonds can be auctioned. Three systems are considered:

  • discriminatory auctions: the highest bids are filled at the price bid until supply is exhausted
  • at uniform-price auctions, bidders pay the stop-out price for all units they requested at prices exceeding the stop-out price.
  • At Spanish auctions, bidders pay the average price of the bids for all their bids above the average and their bid price if it below the accepted average

it appears that the ranking of the two auction formats may only be established on a case-by-case basis.3 As demonstrated by A&S (2005), the presence of asymmetries across participants is an important factor in ranking auction formats in terms of the revenues they generate. Indeed, A&S show that risk averse and/or less-informed bidders may become relatively more aggressive at uniform-price auctions, since they do not have to pay their bids.

Table 7 also indicates that, had the Canadian government conducted the 100 auctions in our sample under the Spanish format instead of the discriminatory format, it would have significantly increased its revenues by an average of 2:34%; or close to 52:71 million dollars, per auction. Furthermore, we can see in Table 8 that, given the assumptions underlying the model, Canadian government revenues would have been higher in roughly 62% of the auctions if it had conducted them under the Spanish format. Observe also that the Spanish format dominates in an additional dimension. Indeed, we can see in Table 7 that the standard deviation of the revenues generated across the 100 auctions is the smallest under the Spanish format. In other words, the stream of revenues generated by the Canadian government from one auction to the next would have been more stable than under the current pricing rule. Finally, Table 7 indicates that the additional revenues the Canadian government would generate by switching from the discriminatory to the Spanish format, would be almost equally spread across maturities. Indeed, we are unable to detect any clear pattern in the additional revenues generated at auctions for 30, 10, 5 or 2 years bonds.

In other words, as found by Armantier and Sbaï (2006), the Spanish format appears to provide an appropriate compromise between asking bidders to pay up to their bids, and promoting aggressive behaviour by o¤ering participants the guarantee that they will not have to pay more than the average winning bid.

SplitShares did well today, presumably on hopes that the bad-bank bailout plan will lead to a world of smiling bankers and bonuses for everybody. Well … I wouldn’t want to say it’s a completely insane hope. I’ll just say that every effort yet to persuade banks to sell their so-called toxic assets in bulk and at a politically acceptable price has failed. I think that Caballero’s plan has a better chance of success.

Fixed-Resets were down again today while PerpetualDiscounts were up, in a continuing fine reversal of their standard form in 2008. Volume continued high. The new RY Fixed-Reset 6.25%+450 will commence trading tomorrow with the symbol RY.PR.R.

HIMIPref™ Preferred Indices
These values reflect the December 2008 revision of the HIMIPref™ Indices

Values are provisional and are finalized monthly
Index Mean
Current
Yield
(at bid)
Median
YTW
Median
Average
Trading
Value
Median
Mod Dur
(YTW)
Issues Day’s Perf. Index Value
Ratchet 6.90 % 7.68 % 23,690 13.50 2 0.5777 % 849.4
FixedFloater 7.47 % 6.97 % 162,003 13.83 8 0.8968 % 1,385.2
Floater 5.36 % 4.51 % 33,519 16.39 4 0.1534 % 980.5
OpRet 5.31 % 4.86 % 160,988 4.04 15 0.0167 % 2,022.8
SplitShare 6.19 % 10.12 % 76,556 4.10 15 1.5794 % 1,799.9
Interest-Bearing 7.09 % 7.93 % 36,657 0.88 2 -0.9748 % 1,994.3
Perpetual-Premium 0.00 % 0.00 % 0 0.00 0 0.3495 % 1,558.3
Perpetual-Discount 6.88 % 6.93 % 228,524 12.67 71 0.3495 % 1,435.2
FixedReset 6.09 % 5.38 % 743,735 14.37 22 -0.1856 % 1,779.2
Performance Highlights
Issue Index Change Notes
BNS.PR.P FixedReset -2.87 % YTW SCENARIO
Maturity Type : Limit Maturity
Maturity Date : 2039-01-28
Maturity Price : 21.93
Evaluated at bid price : 22.00
Bid-YTW : 4.72 %
FIG.PR.A Interest-Bearing -2.63 % Asset coverage of 1.1-:1 as of January 19, based on Capital Units NAV of 1.55 and 0.53 Capital Units per preferred.
YTW SCENARIO
Maturity Type : Hard Maturity
Maturity Date : 2014-12-31
Maturity Price : 10.00
Evaluated at bid price : 7.41
Bid-YTW : 12.85 %
TD.PR.C FixedReset -2.34 % YTW SCENARIO
Maturity Type : Limit Maturity
Maturity Date : 2039-01-28
Maturity Price : 22.96
Evaluated at bid price : 23.00
Bid-YTW : 5.30 %
TD.PR.A FixedReset -2.00 % YTW SCENARIO
Maturity Type : Limit Maturity
Maturity Date : 2039-01-28
Maturity Price : 22.01
Evaluated at bid price : 22.05
Bid-YTW : 4.68 %
ELF.PR.G Perpetual-Discount -1.79 % YTW SCENARIO
Maturity Type : Limit Maturity
Maturity Date : 2039-01-28
Maturity Price : 14.25
Evaluated at bid price : 14.25
Bid-YTW : 8.45 %
BAM.PR.J OpRet -1.51 % YTW SCENARIO
Maturity Type : Soft Maturity
Maturity Date : 2018-03-30
Maturity Price : 25.00
Evaluated at bid price : 17.63
Bid-YTW : 10.66 %
TD.PR.Y FixedReset -1.38 % YTW SCENARIO
Maturity Type : Limit Maturity
Maturity Date : 2039-01-28
Maturity Price : 21.51
Evaluated at bid price : 21.51
Bid-YTW : 4.56 %
RY.PR.I FixedReset -1.30 % YTW SCENARIO
Maturity Type : Limit Maturity
Maturity Date : 2039-01-28
Maturity Price : 22.02
Evaluated at bid price : 22.06
Bid-YTW : 4.79 %
CU.PR.B Perpetual-Discount -1.23 % YTW SCENARIO
Maturity Type : Limit Maturity
Maturity Date : 2039-01-28
Maturity Price : 22.36
Evaluated at bid price : 22.54
Bid-YTW : 6.79 %
BCE.PR.I FixedFloater -1.00 % YTW SCENARIO
Maturity Type : Limit Maturity
Maturity Date : 2039-01-28
Maturity Price : 25.00
Evaluated at bid price : 15.84
Bid-YTW : 6.97 %
CM.PR.H Perpetual-Discount 1.02 % YTW SCENARIO
Maturity Type : Limit Maturity
Maturity Date : 2039-01-28
Maturity Price : 16.79
Evaluated at bid price : 16.79
Bid-YTW : 7.21 %
TD.PR.P Perpetual-Discount 1.06 % YTW SCENARIO
Maturity Type : Limit Maturity
Maturity Date : 2039-01-28
Maturity Price : 20.00
Evaluated at bid price : 20.00
Bid-YTW : 6.61 %
TCA.PR.X Perpetual-Discount 1.10 % YTW SCENARIO
Maturity Type : Limit Maturity
Maturity Date : 2039-01-28
Maturity Price : 43.98
Evaluated at bid price : 45.01
Bid-YTW : 6.24 %
TCA.PR.Y Perpetual-Discount 1.11 % YTW SCENARIO
Maturity Type : Limit Maturity
Maturity Date : 2039-01-28
Maturity Price : 44.25
Evaluated at bid price : 45.50
Bid-YTW : 6.17 %
PWF.PR.F Perpetual-Discount 1.13 % YTW SCENARIO
Maturity Type : Limit Maturity
Maturity Date : 2039-01-28
Maturity Price : 18.86
Evaluated at bid price : 18.86
Bid-YTW : 7.02 %
CM.PR.K FixedReset 1.13 % YTW SCENARIO
Maturity Type : Limit Maturity
Maturity Date : 2039-01-28
Maturity Price : 21.82
Evaluated at bid price : 22.30
Bid-YTW : 4.95 %
SBC.PR.A SplitShare 1.14 % Asset coverage of 1.3-:1 as of January 22, according to Brompton Group.
YTW SCENARIO
Maturity Type : Hard Maturity
Maturity Date : 2012-11-30
Maturity Price : 10.00
Evaluated at bid price : 8.00
Bid-YTW : 12.06 %
W.PR.J Perpetual-Discount 1.15 % YTW SCENARIO
Maturity Type : Limit Maturity
Maturity Date : 2039-01-28
Maturity Price : 19.32
Evaluated at bid price : 19.32
Bid-YTW : 7.34 %
POW.PR.B Perpetual-Discount 1.21 % YTW SCENARIO
Maturity Type : Limit Maturity
Maturity Date : 2039-01-28
Maturity Price : 19.22
Evaluated at bid price : 19.22
Bid-YTW : 7.04 %
BMO.PR.J Perpetual-Discount 1.25 % YTW SCENARIO
Maturity Type : Limit Maturity
Maturity Date : 2039-01-28
Maturity Price : 17.01
Evaluated at bid price : 17.01
Bid-YTW : 6.76 %
PWF.PR.H Perpetual-Discount 1.46 % YTW SCENARIO
Maturity Type : Limit Maturity
Maturity Date : 2039-01-28
Maturity Price : 20.80
Evaluated at bid price : 20.80
Bid-YTW : 6.97 %
DFN.PR.A SplitShare 1.60 % Asset coverage of 1.7-:1 as of January 15 according to the company.
YTW SCENARIO
Maturity Type : Hard Maturity
Maturity Date : 2014-12-01
Maturity Price : 10.00
Evaluated at bid price : 9.10
Bid-YTW : 7.21 %
POW.PR.C Perpetual-Discount 1.61 % YTW SCENARIO
Maturity Type : Limit Maturity
Maturity Date : 2039-01-28
Maturity Price : 21.41
Evaluated at bid price : 21.41
Bid-YTW : 6.85 %
LFE.PR.A SplitShare 1.64 % Asset coverage of 1.5-:1 as of January 15 according to the company.
YTW SCENARIO
Maturity Type : Hard Maturity
Maturity Date : 2012-12-01
Maturity Price : 10.00
Evaluated at bid price : 9.50
Bid-YTW : 6.77 %
DF.PR.A SplitShare 1.64 % Asset coverage of 1.4-:1 as of January 15 according to the company.
YTW SCENARIO
Maturity Type : Hard Maturity
Maturity Date : 2014-12-01
Maturity Price : 10.00
Evaluated at bid price : 8.87
Bid-YTW : 7.74 %
BCE.PR.R FixedFloater 1.67 % YTW SCENARIO
Maturity Type : Limit Maturity
Maturity Date : 2039-01-28
Maturity Price : 25.00
Evaluated at bid price : 15.78
Bid-YTW : 6.88 %
BMO.PR.H Perpetual-Discount 1.87 % YTW SCENARIO
Maturity Type : Limit Maturity
Maturity Date : 2039-01-28
Maturity Price : 20.75
Evaluated at bid price : 20.75
Bid-YTW : 6.52 %
BNA.PR.A SplitShare 1.88 % Asset coverage of 1.8+:1 as of December 31 according to the company.
YTW SCENARIO
Maturity Type : Hard Maturity
Maturity Date : 2010-09-30
Maturity Price : 25.00
Evaluated at bid price : 23.80
Bid-YTW : 10.12 %
FBS.PR.B SplitShare 2.01 % Asset coverage of 1.0-:1 as of January 22 according to TD Securities.
YTW SCENARIO
Maturity Type : Hard Maturity
Maturity Date : 2011-12-15
Maturity Price : 10.00
Evaluated at bid price : 7.61
Bid-YTW : 15.75 %
WFS.PR.A SplitShare 2.11 % Asset coverage of 1.1+:1 as of January 22 according to Mulvihill.
YTW SCENARIO
Maturity Type : Hard Maturity
Maturity Date : 2011-06-30
Maturity Price : 10.00
Evaluated at bid price : 8.70
Bid-YTW : 11.87 %
PWF.PR.G Perpetual-Discount 2.14 % YTW SCENARIO
Maturity Type : Limit Maturity
Maturity Date : 2039-01-28
Maturity Price : 21.51
Evaluated at bid price : 21.51
Bid-YTW : 6.91 %
POW.PR.A Perpetual-Discount 2.50 % YTW SCENARIO
Maturity Type : Limit Maturity
Maturity Date : 2039-01-28
Maturity Price : 20.89
Evaluated at bid price : 20.89
Bid-YTW : 6.78 %
SBN.PR.A SplitShare 2.69 % Asset coverage of 1.6-:1 as of January 22 according to Mulvihill.
YTW SCENARIO
Maturity Type : Hard Maturity
Maturity Date : 2014-12-01
Maturity Price : 10.00
Evaluated at bid price : 9.15
Bid-YTW : 7.12 %
BNA.PR.C SplitShare 2.75 % Asset coverage of 1.8+:1 as of December 31 according to the company.
YTW SCENARIO
Maturity Type : Hard Maturity
Maturity Date : 2019-01-10
Maturity Price : 25.00
Evaluated at bid price : 11.57
Bid-YTW : 15.20 %
NA.PR.N FixedReset 3.02 % YTW SCENARIO
Maturity Type : Limit Maturity
Maturity Date : 2039-01-28
Maturity Price : 22.15
Evaluated at bid price : 22.20
Bid-YTW : 4.78 %
PPL.PR.A SplitShare 3.13 % Asset coverage of 1.4+:1 as of January 15 according to the company.
YTW SCENARIO
Maturity Type : Hard Maturity
Maturity Date : 2012-12-01
Maturity Price : 10.00
Evaluated at bid price : 8.91
Bid-YTW : 8.35 %
FFN.PR.A SplitShare 3.48 % Asset coverage of 1.1+:1 as of January 15 according to the company.
YTW SCENARIO
Maturity Type : Hard Maturity
Maturity Date : 2014-12-01
Maturity Price : 10.00
Evaluated at bid price : 7.51
Bid-YTW : 11.27 %
BCE.PR.G FixedFloater 8.57 % YTW SCENARIO
Maturity Type : Limit Maturity
Maturity Date : 2039-01-28
Maturity Price : 25.00
Evaluated at bid price : 15.21
Bid-YTW : 7.18 %
Volume Highlights
Issue Index Shares
Traded
Notes
LFE.PR.A SplitShare 153,337 Asset coverage of 1.5-:1 as of January 15 according to the company. Desjardins crossed 150,000 at 9.50.
YTW SCENARIO
Maturity Type : Hard Maturity
Maturity Date : 2012-12-01
Maturity Price : 10.00
Evaluated at bid price : 9.50
Bid-YTW : 6.77 %
RY.PR.P FixedReset 121,757 Recent new issue.
YTW SCENARIO
Maturity Type : Limit Maturity
Maturity Date : 2039-01-28
Maturity Price : 25.00
Evaluated at bid price : 25.05
Bid-YTW : 6.13 %
MFC.PR.A OpRet 108,010 Desjardins crossed two blocks of 50,000 each, both at 24.72.
YTW SCENARIO
Maturity Type : Soft Maturity
Maturity Date : 2015-12-18
Maturity Price : 25.00
Evaluated at bid price : 24.48
Bid-YTW : 4.56 %
SLF.PR.B Perpetual-Discount 91,650 Nesbitt crossed 75,000 at 16.78.
YTW SCENARIO
Maturity Type : Limit Maturity
Maturity Date : 2039-01-28
Maturity Price : 16.64
Evaluated at bid price : 16.64
Bid-YTW : 7.32 %
SLF.PR.A Perpetual-Discount 83,368 Nesbitt crossed 75,000 at 16.60.
YTW SCENARIO
Maturity Type : Limit Maturity
Maturity Date : 2039-01-28
Maturity Price : 16.63
Evaluated at bid price : 16.63
Bid-YTW : 7.25 %
TD.PR.M OpRet 77,700 Scotia crossed 74,000 at 25.79.
YTW SCENARIO
Maturity Type : Soft Maturity
Maturity Date : 2013-10-30
Maturity Price : 25.00
Evaluated at bid price : 25.86
Bid-YTW : 3.92 %
There were 46 other index-included issues trading in excess of 10,000 shares.

IMF Releases Global Financial Stability Report Update

Wednesday, January 28th, 2009

The International Monetary Fund has released its January 28 Update to the October Global Financial Stability Report:

Financial markets worldwide reflect ongoing deleveraging pressures amidst a deepening economic downturn. In spite of extensive policies, the global financial system remains under intense stress. Moreover, worsening economic conditions are producing new, large writedowns for financial institutions. In response, balance sheets are being cut back through asset sales and the retiring of maturing credits. These actions have increased downward pressure on asset prices and reduced credit availability. Restoring financial sector functionality and confidence are necessary elements of economic recovery. However, more aggressive actions by both policymakers and market participants are needed to ensure that the necessary deleveraging process is less disorderly. A broad three-pronged approach—including liquidity provision, capital injections, and disposal of problem assets—should be implemented fully and quickly so as to encourage balance sheet cleansing. At the same time, international cooperation will be required to ensure the policy coherence and consistency needed to re-establish financial stability.

They suggest:

International cooperation on a common framework for financial policies should receive high priority. The application of substantially different conditions when supporting financial institutions should be avoided in order to prevent unintended consequences that may arise from competitive distortions and regulatory arbitrage. International coordination is also needed to avoid excessive “national bias,” whereby domestic institutions are favored or local credit provision is encouraged, to the detriment of other countries. A more consistent insolvency framework for financial institutions would also help.

January 27, 2009

Tuesday, January 27th, 2009

There will be a chance to see a milestone in the recovery of the credit market this week – commercial paper held by the Fed will mature:

About $245 billion of 90-day commercial paper that companies sold to the Federal Reserve starting in October will mature this week and next, central bank data show. As much as $50 billion to $70 billion of the debt may be rolled over and bought by investors, according to Barclays Capital in New York.

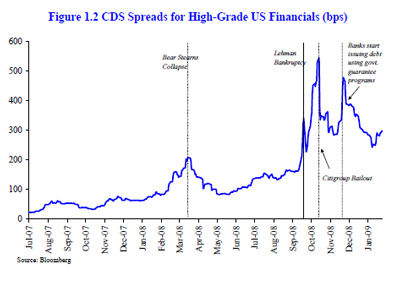
Rates on AA ranked financial commercial paper due in 90 days fell to a record low of 0.28 percent on Jan. 8, or 21 basis points more than the U.S. borrowing rate, Fed data show. They have since jumped to 1.04 percent, or 94 basis points more than the government yield on 90-day Treasury bills, as investors prepared to absorb at least $486 billion of overall paper coming due this week, according to Fed data. The gap peaked at 374 basis points on Oct. 15.

The Fed demands 2.24 percent to own unsecured debt, including a one percentage point fee, under its Commercial Paper Funding Facility.

Fed purchases declined in the first two weeks of the year as investors picked up the slack, reducing government buying to $179 million. First-tier commercial paper assets in prime money- market funds increased 26 percent to $790.6 billion as of Jan. 13, iMoneyNet data show.

Purchases jumped last week to $15.7 billion, the most since November, as some companies remained unable to sell 90-day commercial paper to investors at rates below the cost of issuing to the Fed.

Policy makers also may force companies to wean themselves from federal help by making it “increasingly expensive” to use the CPFF, said Louis Crandall, the chief economist at Jersey City, New Jersey-based Wrightson ICAP, a research unit of ICAP Plc, the world’s largest inter-dealer broker.

The Fed should indeed be increasing its spread to get the banks inter alia to pick up the slack. This would be an important step in removing the Fed from routine intermediation and shrinking the balance sheet. Across the Curve, however, cites some street chatter to the effect that the rollover will be a non-event. But … that’s what we like. Non-events. Aren’t they lovely?

There is an encouraging sign! $150-billion in 84-day TAF money attracted only $136-billion bids and went at 0.25%. This follows a bid-to-cover of 0.72 on January 12, 0.69 on Dec 29, 0.42 on Dec 15 and 0.44 on Dec 2. So this is good. Unfortunately, the Fed is having to purchase agencies in size so don’t celebrate too soon! On the other hand – any more hands and I’ll become an economist – today’s $40-billion 2-Year auction went well and lit up the Treasury market.

I will admit though, that I am becoming a little concerned. Across the Curve contains several ecstatic references to positive carry today – for example, here and here. I heard a lot of remarks about positive carry in 1993 … and we all know what happened in 1994, don’t we?

Carney gave a speech on deflation:

It is worth noting that our lower overnight rates have largely been passed through at shorter maturities. Since the easing cycle began in December 2007, we have lowered the overnight rate by 350 basis points. The prime rate has fallen by 325 basis points, Bankers Acceptance rates (key short-term financing instruments for corporations) have fallen by about 380 basis points, and variable rate mortgages by about 185 basis points.

At longer maturities, the declines have been more modest. In part, this reflects the typical pattern, as long-term rates tend to be less volatile than short-term rates over the business cycle. For example, five-year fixed-rate mortgages have fallen by just over one and a half percentage points. Corporate bond yields have been virtually flat, as a substantial increase in the risk premium charged by investors has offset the decline in government bond yields. While the widening of spreads at longer maturities is larger than usual, this partly reflects the fact that these spreads were unusually narrow to begin with.

The Bank has taken into consideration the higher risk premiums demanded in today’s markets in setting its overnight rate. As well, it has taken into account the effect on future Canadian inflation of the lower level of foreign demand that has resulted, in part, from financial difficulties in other countries. The policy rate is lower than it otherwise would be in the absence of these difficulties.

To conclude, let me say that the inflation target that has served Canada so well when inflation was above the 1 to 3 per cent control range, will also serve it well when inflation falls temporarily below that range. So let me leave no doubt, no uncertainty about the Bank’s commitment. Our focus is clear, our actions consistent, and our objective explicit: 2 per cent CPI inflation.

And the Bank published another working paper, What Accounts for the U.S.-Canada Education-Premium Difference?:

This paper analyzes the differences in wage ratios of university graduates to less than university graduates, the education premium, in Canada and the United States from 1980 to 2000. Both countries experienced a similar increase in the fraction of university graduates and a similar increase in skill biased technological change based on capital-embodied technological progress, but only the United States had a large increase in the education premium. Using a calibrated Krussel et al. (2000) model, the paper finds that the cross country difference is in equal proportion due to the effective stock of capital equipment, the growth in skilled labor supply relative to unskilled labor and the relative abundance of skilled population in 1980. Growth in the working age population is unimportant for the difference.

In other words, we don’t really need a lot more graduates; what we need is money to buy equipment for existing graduates to put their skills to use. I confidently predict that this nuance will be ignored in all future political debates.

Spend-Every-Penny introduced his pre-election budget today. There are some good things … some bad things. In summary:

After taking into account the cost of the measures proposed in Budget 2009 to support the economy, the Government is projecting deficits of $1.1 billion in 2008–09, $33.7 billion in 2009–10, $29.8 billion in 2010–11, $13.0 billion in 2011–12, $7.3 billion in 2012–13 and a surplus of $0.7 billion in 2013–14.

It will take many years of $0.7-billion surpluses to pay for the planned spending, but it didn’t stop him from cutting taxes, just like Mr. Bush:

Taxpayers will begin to benefit from the proposed personal income tax reductions as soon as the Canada Revenue Agency revises its tax withholding tables, in spring 2009.

It is estimated that, together, these measures will cost $470 million in 2008–09, $1,885 million in 2009–10 and $1,950 million in 2010–11.

There is funding for new infrastructure, but no indication that recipients must have a credible plan to pay for maintenance. The word “dividend” does not appear in the document, so I will assume that implications for preferred share investment are minor.

I will reserve special scorn for the “Extraordinary Financing Framework”, partially because it is doomed to be ignored by most. Essentially, the government will provide up to $200-billion worth of intermediation, taking assets onto its books financed by sale of Canada bonds. There’s nothing wrong with that, in principle. However:

To help manage the EFF, the Government will form the Advisory Committee on Financing. This committee will include users and suppliers of financing, along with other experts. The committee will advise on financing conditions and the design, scope and scale of initiatives under the EFF.

There’s already a competent body to administer the programme: it’s called the Bank of Canada. What-Debt’s politicization of monetary policy is absurd – but, after all, he’s the guy who went out of his way to politicize nuclear power regulation.

PerpetualDiscounts managed to eke out a marginal gain today, while FixedResets continued their recent decline.

HIMIPref™ Preferred Indices
These values reflect the December 2008 revision of the HIMIPref™ Indices

Values are provisional and are finalized monthly
Index Mean
Current
Yield
(at bid)
Median
YTW
Median
Average
Trading
Value
Median
Mod Dur
(YTW)
Issues Day’s Perf. Index Value
Ratchet 6.93 % 7.75 % 43,115 13.35 2 -0.4618 % 844.5
FixedFloater 7.46 % 7.02 % 161,551 13.73 8 -1.6067 % 1,372.9
Floater 5.37 % 4.51 % 34,065 16.39 4 3.7676 % 979.0
OpRet 5.31 % 4.82 % 151,949 4.04 15 -0.0446 % 2,022.5
SplitShare 6.28 % 10.44 % 77,090 4.11 15 0.6697 % 1,772.0
Interest-Bearing 7.02 % 8.25 % 36,212 0.89 2 1.6910 % 2,014.0
Perpetual-Premium 0.00 % 0.00 % 0 0.00 0 0.0337 % 1,552.9
Perpetual-Discount 6.90 % 6.95 % 231,245 12.61 71 0.0337 % 1,430.2
FixedReset 6.08 % 5.40 % 774,565 14.34 22 -0.4492 % 1,782.6
Performance Highlights
Issue Index Change Notes
BCE.PR.G FixedFloater -12.44 % Not as bad as it looks! Closed at 14.01-16.20 (!) 13×13 after trading 7,700 shares in a range of 16.00-20.
YTW SCENARIO
Maturity Type : Limit Maturity
Maturity Date : 2039-01-27
Maturity Price : 25.00
Evaluated at bid price : 14.01
Bid-YTW : 7.83 %
IAG.PR.C FixedReset -3.32 % Still struggling with the implications of the abortive Inventory Blow-out Sale.
YTW SCENARIO
Maturity Type : Limit Maturity
Maturity Date : 2039-01-27
Maturity Price : 22.06
Evaluated at bid price : 22.10
Bid-YTW : 6.36 %
LBS.PR.A SplitShare -2.76 % Asset coverage of 1.2+:1 as of January 22 according to Brompton Group.
YTW SCENARIO
Maturity Type : Hard Maturity
Maturity Date : 2013-11-29
Maturity Price : 10.00
Evaluated at bid price : 8.11
Bid-YTW : 10.44 %
PWF.PR.F Perpetual-Discount -1.84 % YTW SCENARIO
Maturity Type : Limit Maturity
Maturity Date : 2039-01-27
Maturity Price : 18.65
Evaluated at bid price : 18.65
Bid-YTW : 7.10 %
TD.PR.Q Perpetual-Discount -1.41 % YTW SCENARIO
Maturity Type : Limit Maturity
Maturity Date : 2039-01-27
Maturity Price : 20.95
Evaluated at bid price : 20.95
Bid-YTW : 6.73 %
BMO.PR.M FixedReset -1.35 % YTW SCENARIO
Maturity Type : Limit Maturity
Maturity Date : 2039-01-27
Maturity Price : 21.95
Evaluated at bid price : 22.00
Bid-YTW : 4.44 %
W.PR.H Perpetual-Discount -1.32 % YTW SCENARIO
Maturity Type : Limit Maturity
Maturity Date : 2039-01-27
Maturity Price : 18.75
Evaluated at bid price : 18.75
Bid-YTW : 7.42 %
SLF.PR.A Perpetual-Discount -1.25 % YTW SCENARIO
Maturity Type : Limit Maturity
Maturity Date : 2039-01-27
Maturity Price : 16.56
Evaluated at bid price : 16.56
Bid-YTW : 7.28 %
BNA.PR.B SplitShare -1.16 % Asset coverage of 1.8+:1 as of December 31 according to the company.
YTW SCENARIO
Maturity Type : Hard Maturity
Maturity Date : 2016-03-25
Maturity Price : 25.00
Evaluated at bid price : 21.26
Bid-YTW : 7.91 %
PWF.PR.G Perpetual-Discount -1.13 % YTW SCENARIO
Maturity Type : Limit Maturity
Maturity Date : 2039-01-27
Maturity Price : 21.06
Evaluated at bid price : 21.06
Bid-YTW : 7.06 %
PWF.PR.H Perpetual-Discount -1.11 % YTW SCENARIO
Maturity Type : Limit Maturity
Maturity Date : 2039-01-27
Maturity Price : 20.50
Evaluated at bid price : 20.50
Bid-YTW : 7.07 %
CIU.PR.A Perpetual-Discount -1.00 % YTW SCENARIO
Maturity Type : Limit Maturity
Maturity Date : 2039-01-27
Maturity Price : 16.81
Evaluated at bid price : 16.81
Bid-YTW : 6.99 %
RY.PR.F Perpetual-Discount 1.06 % YTW SCENARIO
Maturity Type : Limit Maturity
Maturity Date : 2039-01-27
Maturity Price : 17.24
Evaluated at bid price : 17.24
Bid-YTW : 6.47 %
TCA.PR.Y Perpetual-Discount 1.12 % YTW SCENARIO
Maturity Type : Limit Maturity
Maturity Date : 2039-01-27
Maturity Price : 43.94
Evaluated at bid price : 45.00
Bid-YTW : 6.24 %
BNA.PR.A SplitShare 1.13 % Asset coverage of 1.8+:1 as of December 31 according to the company.
YTW SCENARIO
Maturity Type : Hard Maturity
Maturity Date : 2010-09-30
Maturity Price : 25.00
Evaluated at bid price : 23.36
Bid-YTW : 11.34 %
SBN.PR.A SplitShare 1.14 % Asset coverage of 1.6-:1 as of January 22 according to the company.
YTW SCENARIO
Maturity Type : Hard Maturity
Maturity Date : 2014-12-01
Maturity Price : 10.00
Evaluated at bid price : 8.91
Bid-YTW : 7.67 %
SBC.PR.A SplitShare 1.15 % Asset coverage of 1.3-:1 as of January 22 according to the company.
YTW SCENARIO
Maturity Type : Hard Maturity
Maturity Date : 2012-11-30
Maturity Price : 10.00
Evaluated at bid price : 7.91
Bid-YTW : 12.40 %
BNS.PR.K Perpetual-Discount 1.17 % YTW SCENARIO
Maturity Type : Limit Maturity
Maturity Date : 2039-01-27
Maturity Price : 19.08
Evaluated at bid price : 19.08
Bid-YTW : 6.34 %
GWO.PR.F Perpetual-Discount 1.38 % YTW SCENARIO
Maturity Type : Limit Maturity
Maturity Date : 2039-01-27
Maturity Price : 21.70
Evaluated at bid price : 22.00
Bid-YTW : 6.79 %
BAM.PR.K Floater 1.47 % YTW SCENARIO
Maturity Type : Limit Maturity
Maturity Date : 2039-01-27
Maturity Price : 7.60
Evaluated at bid price : 7.60
Bid-YTW : 7.01 %
BMO.PR.K Perpetual-Discount 1.50 % YTW SCENARIO
Maturity Type : Limit Maturity
Maturity Date : 2039-01-27
Maturity Price : 19.60
Evaluated at bid price : 19.60
Bid-YTW : 6.84 %
POW.PR.A Perpetual-Discount 1.54 % YTW SCENARIO
Maturity Type : Limit Maturity
Maturity Date : 2039-01-27
Maturity Price : 20.38
Evaluated at bid price : 20.38
Bid-YTW : 6.95 %
PPL.PR.A SplitShare 1.64 % Asset coverage of 1.4+:1 as of January 15 according to the company.
YTW SCENARIO
Maturity Type : Hard Maturity
Maturity Date : 2012-12-01
Maturity Price : 10.00
Evaluated at bid price : 8.68
Bid-YTW : 9.26 %
ALB.PR.A SplitShare 1.66 % Asset coverage of 1.1-:1 as of January 22 according to Scotia.
YTW SCENARIO
Maturity Type : Hard Maturity
Maturity Date : 2011-02-28
Maturity Price : 25.00
Evaluated at bid price : 20.23
Bid-YTW : 15.80 %
NA.PR.K Perpetual-Discount 1.67 % YTW SCENARIO
Maturity Type : Limit Maturity
Maturity Date : 2039-01-27
Maturity Price : 20.72
Evaluated at bid price : 20.72
Bid-YTW : 7.09 %
BAM.PR.N Perpetual-Discount 1.75 % YTW SCENARIO
Maturity Type : Limit Maturity
Maturity Date : 2039-01-27
Maturity Price : 12.22
Evaluated at bid price : 12.22
Bid-YTW : 9.91 %
FTN.PR.A SplitShare 2.08 % Asset coverage of 1.3+:1 as of January 15 according to the company.
YTW SCENARIO
Maturity Type : Hard Maturity
Maturity Date : 2015-12-01
Maturity Price : 10.00
Evaluated at bid price : 7.86
Bid-YTW : 9.77 %
ELF.PR.F Perpetual-Discount 2.36 % YTW SCENARIO
Maturity Type : Limit Maturity
Maturity Date : 2039-01-27
Maturity Price : 15.60
Evaluated at bid price : 15.60
Bid-YTW : 8.61 %
TRI.PR.B Floater 3.07 % YTW SCENARIO
Maturity Type : Limit Maturity
Maturity Date : 2039-01-27
Maturity Price : 11.75
Evaluated at bid price : 11.75
Bid-YTW : 4.51 %
FIG.PR.A Interest-Bearing 3.96 % Asset coverage of 1.1-:1 as of January 19, based on Capital Units NAV of 1.42 and 0.53 Capital Units per preferred.
YTW SCENARIO
Maturity Type : Hard Maturity
Maturity Date : 2014-12-31
Maturity Price : 10.00
Evaluated at bid price : 7.61
Bid-YTW : 12.25 %
DFN.PR.A SplitShare 4.05 % Asset coverage of 1.7-:1 as of January 15 according to the company.
YTW SCENARIO
Maturity Type : Hard Maturity
Maturity Date : 2014-12-01
Maturity Price : 10.00
Evaluated at bid price : 9.00
Bid-YTW : 7.53 %
PWF.PR.A Floater 8.60 % The bid came back after taking yesterday off. Closed at 12.00-99, 7×2, after trading 800 shares in one trade at 12.00.
YTW SCENARIO
Maturity Type : Limit Maturity
Maturity Date : 2039-01-27
Maturity Price : 12.00
Evaluated at bid price : 12.00
Bid-YTW : 4.37 %
Volume Highlights
Issue Index Shares
Traded
Notes
TRI.PR.B Floater 171,000 Nesbitt crossed 169,500 at 11.50.
YTW SCENARIO
Maturity Type : Limit Maturity
Maturity Date : 2039-01-27
Maturity Price : 11.75
Evaluated at bid price : 11.75
Bid-YTW : 4.51 %
BCE.PR.A FixedFloater 153,500 Nesbitt crossed 100,000 at 17.00, then another 50,000 at 16.99.
YTW SCENARIO
Maturity Type : Limit Maturity
Maturity Date : 2039-01-27
Maturity Price : 25.00
Evaluated at bid price : 17.06
Bid-YTW : 6.65 %
BCE.PR.F FixedFloater 153,000 Nesbitt crossed 100,000 at 16.00, then another 50,000 at 15.99.
YTW SCENARIO
Maturity Type : Limit Maturity
Maturity Date : 2039-01-27
Maturity Price : 25.00
Evaluated at bid price : 15.62
Bid-YTW : 6.36 %
BAM.PR.K Floater 147,615 Nesbitt crossed 140,000 at 7.55.
YTW SCENARIO
Maturity Type : Limit Maturity
Maturity Date : 2039-01-27
Maturity Price : 7.60
Evaluated at bid price : 7.60
Bid-YTW : 7.01 %
TD.PR.E FixedReset 131,115 Recent new issue.
YTW SCENARIO
Maturity Type : Limit Maturity
Maturity Date : 2039-01-27
Maturity Price : 24.94
Evaluated at bid price : 24.99
Bid-YTW : 6.27 %
RY.PR.P FixedReset 116,833 Recent new issue.
YTW SCENARIO
Maturity Type : Limit Maturity
Maturity Date : 2039-01-27
Maturity Price : 24.96
Evaluated at bid price : 25.01
Bid-YTW : 6.14 %
BNS.PR.T FixedReset 101,791 Recent new issue.
YTW SCENARIO
Maturity Type : Limit Maturity
Maturity Date : 2039-01-27
Maturity Price : 24.96
Evaluated at bid price : 25.01
Bid-YTW : 6.10 %
There were 34 other index-included issues trading in excess of 10,000 shares.

BMO.PR.J vs. CIU.PR.A: Credit or Cumulativity?

Tuesday, January 27th, 2009

I have had occasion recently to look carefully at BMO.PR.J and CIU.PR.A and thought I’d pass along some of the data.

They’re very similar issues: both came out during the issuance rush of early 2007 (BMO.PR.J at the beginning, CIU.PR.A at the end … BMO.PR.J pays $1.125 p.a., while CIU.PR.A pays $1.15.

The major differences between them are:

  • Credit: BMO is Pfd-1; CIU is Pfd-2(high)
  • Cumulativity: BMO.PR.J is non-cumulative; CIU.PR.A is cumulative.
  • Volume: BMO.PR.J has an average daily trading volume worth $511M; CIU’s is only $95M

CIU.PR.A should be analyzed as junior to the series second showing on their books.

I have previously compared BMO.PR.J with BMO.PR.H.

Both issues were added to TXPR in July 2007.

Anyway, with no further comment, here are some graphs:

Opinion: OSFI and the Third Pillar

Tuesday, January 27th, 2009

OSFI is often criticized on PrefBlog! In a recently published article I developed the theme and set six milestones for improvement.

Look for the opinion link!

An Early Debate on Value at Risk

Tuesday, January 27th, 2009

I found the The Jorion-Taleb Debate from 1997 to be most interesting – particularly Taleb’s comment:

Banks have the ingrained habit of plunging headlong into mistakes together where blame-minimizing managers appear to feel comfortable making blunders so long as their competitors are making the same ones. The state of the Japanese and French banking systems, the stories of lending to Latin America, the chronic real estate booms and busts, and the S&L debacle provide us with an interesting cycle of communal irrationality. I believe that the VAR is the alibi bankers will give shareholders (and the bailing-out taxpayer) to show documented due diligence, and will express that their blow-up came from truly unforeseeable circumstances and events with low probability-not from taking large risks they did not understand. But my sense of social responsibility will force me to point my finger menacingly. I maintain that the due-diligence VAR tool encourages untrained people to take misdirected risk with shareholders’, and ultimately the taxpayers’, money.

There’s also a debate between David Einhorn & Aaron Brown from the summer of 2008 that is of great interest.

And straight line from CAPM through VaR to Basel II is drawn by Kaplanski, Guy and Levy, Haim,Value-at-Risk Capital Requirement Regulation and Asset Allocation: A Mean-Variance Analysis(August 2007). Available at SSRN: http://ssrn.com/abstract=1081288

Research: Where Are We Now?

Tuesday, January 27th, 2009

The January edition of Canadian Moneysaver included my latest effort – “Where Are We Now?”, a review of 2008 … the most horrific year for preferreds in recent memory, at any rate.

Look for the research link!

January 26, 2009

Monday, January 26th, 2009

I complained on January 19 that the political leverage given to politicians by the TARP funds would lead to calls to expand non-economic but politically attractive business methodologies. Dealbreaker passes along more commentary on this subject:

Surprise! Now anyone with public money is bathing in the gelatinous “squish” of a million squirming appetites, forced to submit to a literal morass of legislative tentacle sex with hundreds of pet projects, social theory experiments and personal causes (from the left and the right), not to mention the utter chaos and unpredictability of having every idiot in the House pop off about what new rule you should be following this week. Predicting what is or will be expected of you (or what you may or may not be paid) is a nightmarish prospect.

Dealbreaker also comments on the Caballero Insurance Plan that I have previously written about:

Typically when Congress can’t get the political backing to actually pass a bill to pay for something, they do the next best thing: get the political backing to guarantee something, or insure any losses. At the very least this reduces the cost of capital for the activity. Throw some tax benefits in and you go a long way to encouraging the behavior you are trying to stimulate. So potent can the effect be that you don’t even necessarily need a direct guarantee. (The “too big to fail” condition and the “implicit guarantee” of a Fannie Mae is a good example here).

The problem with this level of insurance is that while it preserves public capital (and prevents dilution) you can write a lot of insurance before anyone starts to notice that you are on the hook for, well, a lot of insurance. (See e.g., Fannie and Freddie).

An interesting day in the preferred market! Split shares got hurt, presumably due to continued equity weakness – a lot of the January 22 NAVs are coming out and don’t look very pretty. FBS.PR.B is now valued below the preferred par value, but is still rated Pfd-2(low) by DBRS, and has been under review negative for three months now.

Fixed-Resets got hurt, presumably due to continued heavy issuance: a new CIBC fixed-reset 650+447 was announced today, bringing the total number of pending issues to five. Amidst all this, PerpetualDiscounts were up on the day, albeit marginally and with a certain sloppiness.

TD went into a frenzy of activity, trading a huge number of blocks after the close – remember that after hours trading is fine, but it all has to occur at the same price as the last trade of a board lot.

HIMIPref™ Preferred Indices
These values reflect the December 2008 revision of the HIMIPref™ Indices

Values are provisional and are finalized monthly
Index Mean
Current
Yield
(at bid)
Median
YTW
Median
Average
Trading
Value
Median
Mod Dur
(YTW)
Issues Day’s Perf. Index Value
Ratchet 6.93 % 7.70 % 40,130 13.38 2 -0.7405 % 848.4
FixedFloater 7.34 % 6.91 % 162,168 13.74 8 0.6072 % 1,395.4
Floater 5.57 % 4.75 % 34,686 15.98 4 -2.4838 % 943.4
OpRet 5.31 % 4.76 % 154,215 4.04 15 -0.0195 % 2,023.4
SplitShare 6.32 % 9.75 % 76,264 4.13 15 -0.6945 % 1,760.2
Interest-Bearing 7.14 % 8.23 % 35,281 0.89 2 0.5865 % 1,980.5
Perpetual-Premium 0.00 % 0.00 % 0 0.00 0 0.1236 % 1,552.4
Perpetual-Discount 6.91 % 6.95 % 230,184 12.61 71 0.1236 % 1,429.7
FixedReset 6.06 % 5.40 % 788,333 14.34 22 -0.8178 % 1,790.6
Performance Highlights
Issue Index Change Notes
PWF.PR.A Floater -8.07 % A flurry of activity (insofar as 800 shares may be considered a “flurry”) took out the bid and the closing quote was 11.05-12.49 (!) 10×1, after trading 800 shares in a range of 11.02-12.01.
YTW SCENARIO
Maturity Type : Limit Maturity
Maturity Date : 2039-01-26
Maturity Price : 11.05
Evaluated at bid price : 11.05
Bid-YTW : 4.75 %
FFN.PR.A SplitShare -4.73 % Asset coverage of 1.1+:1 as of January 15 according to the company.
YTW SCENARIO
Maturity Type : Hard Maturity
Maturity Date : 2014-12-01
Maturity Price : 10.00
Evaluated at bid price : 7.25
Bid-YTW : 12.14 %
RY.PR.L FixedReset -4.64 % YTW SCENARIO
Maturity Type : Limit Maturity
Maturity Date : 2039-01-26
Maturity Price : 22.56
Evaluated at bid price : 22.60
Bid-YTW : 5.45 %
FBS.PR.B SplitShare -3.99 % Asset coverage of 1.0-:1 as of January 22, according to TD Securities.
YTW SCENARIO
Maturity Type : Hard Maturity
Maturity Date : 2011-12-15
Maturity Price : 10.00
Evaluated at bid price : 7.45
Bid-YTW : 16.58 %
NA.PR.N FixedReset -3.78 % YTW SCENARIO
Maturity Type : Limit Maturity
Maturity Date : 2039-01-26
Maturity Price : 21.35
Evaluated at bid price : 21.65
Bid-YTW : 4.89 %
CM.PR.K FixedReset -2.20 % YTW SCENARIO
Maturity Type : Limit Maturity
Maturity Date : 2039-01-26
Maturity Price : 21.79
Evaluated at bid price : 22.25
Bid-YTW : 4.96 %
PWF.PR.L Perpetual-Discount -1.96 % YTW SCENARIO
Maturity Type : Limit Maturity
Maturity Date : 2039-01-26
Maturity Price : 18.04
Evaluated at bid price : 18.04
Bid-YTW : 7.12 %
SBN.PR.A SplitShare -1.67 % Asset coverage of 1.7-:1 as of January 15 according to Mulvihill.
YTW SCENARIO
Maturity Type : Hard Maturity
Maturity Date : 2014-12-01
Maturity Price : 10.00
Evaluated at bid price : 8.81
Bid-YTW : 7.90 %
POW.PR.C Perpetual-Discount -1.67 % YTW SCENARIO
Maturity Type : Limit Maturity
Maturity Date : 2039-01-26
Maturity Price : 21.19
Evaluated at bid price : 21.19
Bid-YTW : 6.92 %
CM.PR.H Perpetual-Discount -1.55 % YTW SCENARIO
Maturity Type : Limit Maturity
Maturity Date : 2039-01-26
Maturity Price : 16.50
Evaluated at bid price : 16.50
Bid-YTW : 7.34 %
SLF.PR.E Perpetual-Discount -1.52 % YTW SCENARIO
Maturity Type : Limit Maturity
Maturity Date : 2039-01-26
Maturity Price : 15.50
Evaluated at bid price : 15.50
Bid-YTW : 7.37 %
PWF.PR.K Perpetual-Discount -1.52 % YTW SCENARIO
Maturity Type : Limit Maturity
Maturity Date : 2039-01-26
Maturity Price : 17.53
Evaluated at bid price : 17.53
Bid-YTW : 7.12 %
BMO.PR.K Perpetual-Discount -1.48 % YTW SCENARIO
Maturity Type : Limit Maturity
Maturity Date : 2039-01-26
Maturity Price : 19.31
Evaluated at bid price : 19.31
Bid-YTW : 6.95 %
BCE.PR.Y Ratchet -1.46 % YTW SCENARIO
Maturity Type : Limit Maturity
Maturity Date : 2039-01-26
Maturity Price : 25.00
Evaluated at bid price : 14.15
Bid-YTW : 7.70 %
BCE.PR.Z FixedFloater -1.31 % YTW SCENARIO
Maturity Type : Limit Maturity
Maturity Date : 2039-01-26
Maturity Price : 25.00
Evaluated at bid price : 15.01
Bid-YTW : 7.49 %
BNS.PR.P FixedReset -1.31 % YTW SCENARIO
Maturity Type : Limit Maturity
Maturity Date : 2039-01-26
Maturity Price : 22.57
Evaluated at bid price : 22.65
Bid-YTW : 4.57 %
SLF.PR.C Perpetual-Discount -1.28 % YTW SCENARIO
Maturity Type : Limit Maturity
Maturity Date : 2039-01-26
Maturity Price : 15.41
Evaluated at bid price : 15.41
Bid-YTW : 7.33 %
RY.PR.F Perpetual-Discount -1.27 % YTW SCENARIO
Maturity Type : Limit Maturity
Maturity Date : 2039-01-26
Maturity Price : 17.06
Evaluated at bid price : 17.06
Bid-YTW : 6.54 %
RY.PR.I FixedReset -1.27 % YTW SCENARIO
Maturity Type : Limit Maturity
Maturity Date : 2039-01-26
Maturity Price : 22.47
Evaluated at bid price : 22.51
Bid-YTW : 4.69 %
BNS.PR.K Perpetual-Discount -1.26 % YTW SCENARIO
Maturity Type : Limit Maturity
Maturity Date : 2039-01-26
Maturity Price : 18.86
Evaluated at bid price : 18.86
Bid-YTW : 6.41 %
GWO.PR.J FixedReset -1.17 % YTW SCENARIO
Maturity Type : Limit Maturity
Maturity Date : 2039-01-26
Maturity Price : 24.46
Evaluated at bid price : 24.51
Bid-YTW : 5.40 %
BCE.PR.C FixedFloater -1.17 % YTW SCENARIO
Maturity Type : Limit Maturity
Maturity Date : 2039-01-26
Maturity Price : 25.00
Evaluated at bid price : 16.06
Bid-YTW : 7.09 %
SLF.PR.D Perpetual-Discount -1.16 % YTW SCENARIO
Maturity Type : Limit Maturity
Maturity Date : 2039-01-26
Maturity Price : 15.37
Evaluated at bid price : 15.37
Bid-YTW : 7.35 %
MFC.PR.A OpRet -1.10 % YTW SCENARIO
Maturity Type : Soft Maturity
Maturity Date : 2015-12-18
Maturity Price : 25.00
Evaluated at bid price : 24.34
Bid-YTW : 4.65 %
BNS.PR.J Perpetual-Discount -1.05 % YTW SCENARIO
Maturity Type : Limit Maturity
Maturity Date : 2039-01-26
Maturity Price : 19.81
Evaluated at bid price : 19.81
Bid-YTW : 6.68 %
RY.PR.B Perpetual-Discount -1.04 % YTW SCENARIO
Maturity Type : Limit Maturity
Maturity Date : 2039-01-26
Maturity Price : 18.01
Evaluated at bid price : 18.01
Bid-YTW : 6.54 %
BNS.PR.N Perpetual-Discount 1.06 % YTW SCENARIO
Maturity Type : Limit Maturity
Maturity Date : 2039-01-26
Maturity Price : 20.11
Evaluated at bid price : 20.11
Bid-YTW : 6.58 %
TD.PR.Q Perpetual-Discount 1.19 % YTW SCENARIO
Maturity Type : Limit Maturity
Maturity Date : 2039-01-26
Maturity Price : 21.25
Evaluated at bid price : 21.25
Bid-YTW : 6.64 %
CM.PR.E Perpetual-Discount 1.19 % YTW SCENARIO
Maturity Type : Limit Maturity
Maturity Date : 2039-01-26
Maturity Price : 19.52
Evaluated at bid price : 19.52
Bid-YTW : 7.24 %
RY.PR.W Perpetual-Discount 1.23 % YTW SCENARIO
Maturity Type : Limit Maturity
Maturity Date : 2039-01-26
Maturity Price : 18.91
Evaluated at bid price : 18.91
Bid-YTW : 6.50 %
GWO.PR.I Perpetual-Discount 1.35 % YTW SCENARIO
Maturity Type : Limit Maturity
Maturity Date : 2039-01-26
Maturity Price : 15.72
Evaluated at bid price : 15.72
Bid-YTW : 7.26 %
BAM.PR.N Perpetual-Discount 1.44 % YTW SCENARIO
Maturity Type : Limit Maturity
Maturity Date : 2039-01-26
Maturity Price : 12.01
Evaluated at bid price : 12.01
Bid-YTW : 10.09 %
TCA.PR.Y Perpetual-Discount 1.46 % YTW SCENARIO
Maturity Type : Limit Maturity
Maturity Date : 2039-01-26
Maturity Price : 43.61
Evaluated at bid price : 44.50
Bid-YTW : 6.31 %
BMO.PR.H Perpetual-Discount 1.54 % YTW SCENARIO
Maturity Type : Limit Maturity
Maturity Date : 2039-01-26
Maturity Price : 20.47
Evaluated at bid price : 20.47
Bid-YTW : 6.61 %
BCE.PR.F FixedFloater 1.55 % YTW SCENARIO
Maturity Type : Limit Maturity
Maturity Date : 2039-01-26
Maturity Price : 25.00
Evaluated at bid price : 15.75
Bid-YTW : 6.31 %
CU.PR.A Perpetual-Discount 1.76 % YTW SCENARIO
Maturity Type : Limit Maturity
Maturity Date : 2039-01-26
Maturity Price : 21.91
Evaluated at bid price : 21.91
Bid-YTW : 6.75 %
BAM.PR.K Floater 1.77 % YTW SCENARIO
Maturity Type : Limit Maturity
Maturity Date : 2039-01-26
Maturity Price : 7.49
Evaluated at bid price : 7.49
Bid-YTW : 7.11 %
BCE.PR.I FixedFloater 1.84 % YTW SCENARIO
Maturity Type : Limit Maturity
Maturity Date : 2039-01-26
Maturity Price : 25.00
Evaluated at bid price : 16.07
Bid-YTW : 6.91 %
PWF.PR.H Perpetual-Discount 2.02 % YTW SCENARIO
Maturity Type : Limit Maturity
Maturity Date : 2039-01-26
Maturity Price : 20.73
Evaluated at bid price : 20.73
Bid-YTW : 6.99 %
BNA.PR.C SplitShare 2.09 % Asset coverage of 1.8+:1 as of December 31 according to the company.
YTW SCENARIO
Maturity Type : Hard Maturity
Maturity Date : 2019-01-10
Maturity Price : 25.00
Evaluated at bid price : 11.24
Bid-YTW : 15.64 %
NA.PR.M Perpetual-Discount 2.14 % YTW SCENARIO
Maturity Type : Limit Maturity
Maturity Date : 2039-01-26
Maturity Price : 21.50
Evaluated at bid price : 21.50
Bid-YTW : 7.01 %
RY.PR.C Perpetual-Discount 2.18 % YTW SCENARIO
Maturity Type : Limit Maturity
Maturity Date : 2039-01-26
Maturity Price : 17.85
Evaluated at bid price : 17.85
Bid-YTW : 6.46 %
PWF.PR.E Perpetual-Discount 2.32 % YTW SCENARIO
Maturity Type : Limit Maturity
Maturity Date : 2039-01-26
Maturity Price : 20.25
Evaluated at bid price : 20.25
Bid-YTW : 6.84 %
GWO.PR.G Perpetual-Discount 2.52 % YTW SCENARIO
Maturity Type : Limit Maturity
Maturity Date : 2039-01-26
Maturity Price : 18.75
Evaluated at bid price : 18.75
Bid-YTW : 7.03 %
BAM.PR.M Perpetual-Discount 3.43 % YTW SCENARIO
Maturity Type : Limit Maturity
Maturity Date : 2039-01-26
Maturity Price : 12.37
Evaluated at bid price : 12.37
Bid-YTW : 9.79 %
BAM.PR.G FixedFloater 4.66 % YTW SCENARIO
Maturity Type : Limit Maturity
Maturity Date : 2039-01-26
Maturity Price : 25.00
Evaluated at bid price : 11.00
Bid-YTW : 9.99 %
Volume Highlights
Issue Index Shares
Traded
Notes
PWF.PR.K Perpetual-Discount 283,255 TD crossed 277,000 after hours at 17.85.
YTW SCENARIO
Maturity Type : Limit Maturity
Maturity Date : 2039-01-26
Maturity Price : 17.53
Evaluated at bid price : 17.53
Bid-YTW : 7.12 %
HSB.PR.C Perpetual-Discount 269,940 TD crossed 257,400 after hours at 17.23.
YTW SCENARIO
Maturity Type : Limit Maturity
Maturity Date : 2039-01-26
Maturity Price : 17.23
Evaluated at bid price : 17.23
Bid-YTW : 7.51 %
SLF.PR.A Perpetual-Discount 224,950 TD crossed 215,800 after hours at 16.95.
YTW SCENARIO
Maturity Type : Limit Maturity
Maturity Date : 2039-01-26
Maturity Price : 16.77
Evaluated at bid price : 16.77
Bid-YTW : 7.19 %
SLF.PR.E Perpetual-Discount 208,615 TD crossed 198,700 after hours at 15.50.
YTW SCENARIO
Maturity Type : Limit Maturity
Maturity Date : 2039-01-26
Maturity Price : 15.50
Evaluated at bid price : 15.50
Bid-YTW : 7.37 %
TD.PR.E FixedReset 201,785 Recent new issue.
YTW SCENARIO
Maturity Type : Limit Maturity
Maturity Date : 2039-01-26
Maturity Price : 24.95
Evaluated at bid price : 25.00
Bid-YTW : 6.27 %
BNS.PR.K Perpetual-Discount 190,250 TD crossed 189,800 after hours at 19.05.
YTW SCENARIO
Maturity Type : Limit Maturity
Maturity Date : 2039-01-26
Maturity Price : 18.86
Evaluated at bid price : 18.86
Bid-YTW : 6.41 %
TD.PR.R Perpetual-Discount 190,003 TD crossed 184,500 at 21.20.
YTW SCENARIO
Maturity Type : Limit Maturity
Maturity Date : 2039-01-26
Maturity Price : 20.92
Evaluated at bid price : 20.92
Bid-YTW : 6.74 %
BMO.PR.K Perpetual-Discount 184,160 TD crossed 180,000 after hours at 19.62.
YTW SCENARIO
Maturity Type : Limit Maturity
Maturity Date : 2039-01-26
Maturity Price : 19.31
Evaluated at bid price : 19.31
Bid-YTW : 6.95 %
IAG.PR.A Perpetual-Discount 181,830 TD crossed 180,600 after hours at 16.62.
YTW SCENARIO
Maturity Type : Limit Maturity
Maturity Date : 2039-01-26
Maturity Price : 16.61
Evaluated at bid price : 16.61
Bid-YTW : 7.02 %
TD.PR.O Perpetual-Discount 173,480 TD crossed 164,800 after hours at 18.88.
YTW SCENARIO
Maturity Type : Limit Maturity
Maturity Date : 2039-01-26
Maturity Price : 18.81
Evaluated at bid price : 18.81
Bid-YTW : 6.49 %
RY.PR.P FixedReset 167,217 Recent new issue.
YTW SCENARIO
Maturity Type : Limit Maturity
Maturity Date : 2039-01-26
Maturity Price : 24.95
Evaluated at bid price : 25.00
Bid-YTW : 6.14 %
GWO.PR.H Perpetual-Discount 164,810 TD crossed 162,100 at 16.71.
YTW SCENARIO
Maturity Type : Limit Maturity
Maturity Date : 2039-01-26
Maturity Price : 16.71
Evaluated at bid price : 16.71
Bid-YTW : 7.37 %
RY.PR.C Perpetual-Discount 145,660 TD crossed 142,800 after hours at 17.91. YTW SCENARIO
Maturity Type : Limit Maturity
Maturity Date : 2039-01-26
Maturity Price : 17.85
Evaluated at bid price : 17.85
Bid-YTW : 6.46 %
BNS.PR.T FixedReset 132,590 National crossed 40,000 at 25.03. TD crossed 30,100 after hours at 25.05. YTW SCENARIO
Maturity Type : Limit Maturity
Maturity Date : 2039-01-26
Maturity Price : 24.98
Evaluated at bid price : 25.03
Bid-YTW : 6.09 %
BCE.PR.A FixedFloater 131,405 TD crossed 126,100 after hours at 17.01.
YTW SCENARIO
Maturity Type : Limit Maturity
Maturity Date : 2039-01-26
Maturity Price : 25.00
Evaluated at bid price : 16.93
Bid-YTW : 6.73 %
MFC.PR.C Perpetual-Discount 123,880 TD crossed 118,100 after hours at 16.85. YTW SCENARIO
Maturity Type : Limit Maturity
Maturity Date : 2039-01-26
Maturity Price : 16.85
Evaluated at bid price : 16.85
Bid-YTW : 6.79 %
CL.PR.B Perpetual-Discount 121,975 Nesbitt crossed 18,800 at 21.81. TD crossed 94,100 after hours at 22.00.
YTW SCENARIO
Maturity Type : Limit Maturity
Maturity Date : 2039-01-26
Maturity Price : 21.90
Evaluated at bid price : 21.90
Bid-YTW : 7.24 %
CM.PR.H Perpetual-Discount 115,284 TD crossed 95,000 after hours at 16.55.
YTW SCENARIO
Maturity Type : Limit Maturity
Maturity Date : 2039-01-26
Maturity Price : 16.50
Evaluated at bid price : 16.50
Bid-YTW : 7.34 %
WFS.PR.A SplitShare 115,100 Desjardins crossed 100,000 at 8.62. Asset coverage of 1.2-:1 as of January 15 according to Mulvihill.
YTW SCENARIO
Maturity Type : Hard Maturity
Maturity Date : 2011-06-30
Maturity Price : 10.00
Evaluated at bid price : 8.52
Bid-YTW : 12.82 %
SLF.PR.B Perpetual-Discount 111,859 TD crossed 105,300 after hours at 16.85.
YTW SCENARIO
Maturity Type : Limit Maturity
Maturity Date : 2039-01-26
Maturity Price : 16.62
Evaluated at bid price : 16.62
Bid-YTW : 7.33 %
RY.PR.H Perpetual-Discount 110,530 TD crossed 103,700 after hours at 21.42.
YTW SCENARIO
Maturity Type : Limit Maturity
Maturity Date : 2039-01-26
Maturity Price : 21.42
Evaluated at bid price : 21.42
Bid-YTW : 6.61 %
PWF.PR.G Perpetual-Discount 110,246 TD crossed 109,500 after hours at 21.67.
YTW SCENARIO
Maturity Type : Limit Maturity
Maturity Date : 2039-01-26
Maturity Price : 21.30
Evaluated at bid price : 21.30
Bid-YTW : 6.98 %
BNS.PR.O Perpetual-Discount 109,740 TD crossed 108,500 after hours at 21.04.
YTW SCENARIO
Maturity Type : Limit Maturity
Maturity Date : 2039-01-26
Maturity Price : 21.01
Evaluated at bid price : 21.01
Bid-YTW : 6.72 %
BNS.PR.P FixedReset 109,700 Nesbitt crossed 50,000 at 23.00, then another 57,600 at the same price.
YTW SCENARIO
Maturity Type : Limit Maturity
Maturity Date : 2039-01-26
Maturity Price : 22.57
Evaluated at bid price : 22.65
Bid-YTW : 4.57 %
SLF.PR.C Perpetual-Discount 104,709 RBC bought 22,000 from National at 15.60; TD crossed 66,800 after hours at 15.47.
YTW SCENARIO
Maturity Type : Limit Maturity
Maturity Date : 2039-01-26
Maturity Price : 15.41
Evaluated at bid price : 15.41
Bid-YTW : 7.33 %
MFC.PR.B Perpetual-Discount 103,083 Nesbitt crossed 40,000 at 17.85; TD crossed 51,900 after hours at 16.21.
YTW SCENARIO
Maturity Type : Limit Maturity
Maturity Date : 2039-01-26
Maturity Price : 17.55
Evaluated at bid price : 17.55
Bid-YTW : 6.73 %
There were 65 other index-included issues trading in excess of 10,000 shares.

Correlation of Stock and Bond Returns

Monday, January 26th, 2009

I have had occasion to review asset class correlation – among the things I have read was: Li, Lingfeng, Macroeconomic Factors and the Correlation of Stock and Bond Returns(November 2002). Yale ICF Working Paper No. 02-46; AFA 2004 San Diego Meetings. Available at SSRN: http://ssrn.com/abstract=363641:

This paper examines the correlation between stock and bond returns. It first documents that the major trends in stock-bond correlation for G7 countries follow a similar reverting pattern in the past forty years. Next, an asset pricing model is employed to show that the correlation of stock and bond returns can be explained by their common exposure to macroeconomic factors. The link between the stock-bond correlation and macroeconomic factors is examined using three successively more realistic formulations of asset return dynamics. Empirical results indicate that the major trends in stock-bond correlation are determined primarily by uncertainty about expected inflation. Unexpected inflation and the real interest rate are significant to a lesser degree. Forecasting this stock-bond correlation using macroeconomic factors also helps improve investors’ asset allocation decisions. One implication of this link between trends in stock-bond correlation and inflation risk is the Murphy’s Law of Diversification: diversification opportunities are least available when they are most needed.

In light of the widely held view that Benjamin Graham is so famous his pronouncements should not be questioned, it is amusing to read the first footnote:

In the first version of The Intelligent Investor, published in the 1950s, the author, then investment guru Benjamin Graham, claims that the correlation between stock and bond returns is negative. His argument provides the basis for the asset allocation advice of 50-50 split in stocks and bonds. However, in the second version of this book published in the 1970s, the correlation structure has changed and the argument is dropped. Today, one can randomly search the term “stock and bond correlation” on the internet, and easily find sharply contradictory opinions among market participants. When it comes to story-telling, one man’s story is just as good as others. Most of these opinions are based on causal observations and lack the support of concrete evidence.

Figure 1: U.S. Rolling Stock-Bond Correlations, 1961-2001 This figure shows U.S. rolling stock-bond correlations using 60-month rolling window. The thick line is the rolling correlation excluding October 1987. The two dashed lines are the 90% upper and lower error bands. The thin line includes October 1987. Stock returns are calculated using the broad market total return indices. Bond returns are calculated using the long-term government bond total return indices. All returns are monthly, from January 1958 to December 2001.

Our analysis sheds light on the reverting trend observed in G7 stock-bond correlations. The 1970s saw an oil crisis and a subsequent economic stagflation in major industrial countries, which caused high and persistent inflation expectations for over a decade. Investors’ concern for inflation strongly affected the valuation of financial assets during this period and resulted in high comovement between stock and bond returns. The sharp decline in stock-bond correlations in the 1990s can be partially attributed to the lower inflation risk during this period.

Stocks and bonds are two major asset classes for ordinary investors. A lower stock-bond correlation indicates better diversification opportunities. The fact that stock-bond correlation is positively related to inflation risk is a disturbing message for investors. During the periods when inflation risk is high, asset returns tend to be more volatile. This gives investors a stronger incentive to diversify the investment risk. Unfortunately, these are also the periods when stock-bond correlations are high and diversification opportunities are meager. This observation leads to the Murphy’s Law of Diversification: diversification opportunities are least available when they are most needed.