Archive for February, 2009

February 5, 2009

Thursday, February 5th, 2009

The Russian Central Bank has come up with a novel bank recapitalization technique:

Russia’s central bank is exacerbating the ruble’s 34 percent plunge since August, even as it struggles to defend the exchange rate, by providing loans to banks that speculate on the currency, say Alfa Bank and UniCredit SpA.

Bank Rossii lent 7.7 trillion rubles ($214 billion) in overnight and seven-day loans secured with bonds or other collateral in the 16 trading days last month, about double the 4.8 trillion rubles provided in so-called repurchase auctions in December, central bank data show. Banks used “almost all” the money to bet against the ruble, said Natalia Orlova, chief economist at Alfa, Russia’s largest non-government bank. The ruble fell 18 percent against the dollar in January.

“A significant amount, if not all, of the speculative attacks on the ruble are funded by the central bank itself,” said Vladimir Osakovsky, Moscow-based economist for UniCredit, Italy’s largest bank.

Across the Curve believes that Treasury issuance is going to lead to higher government bond yields in the near future.

PerpetualDiscounts edged slightly lower today. Market volume was reasonable, but dominated by the recent Fixed-Reset issues.

HIMIPref™ Preferred Indices
These values reflect the December 2008 revision of the HIMIPref™ Indices

Values are provisional and are finalized monthly
Index Mean
Current
Yield
(at bid)
Median
YTW
Median
Average
Trading
Value
Median
Mod Dur
(YTW)
Issues Day’s Perf. Index Value
Ratchet 5.36 % 3.86 % 24,117 17.63 2 -0.1024 % 855.8
FixedFloater 7.26 % 6.98 % 68,178 13.93 7 -0.0367 % 1,382.3
Floater 5.38 % 4.42 % 29,436 16.55 4 0.2567 % 976.7
OpRet 5.29 % 4.70 % 158,414 4.02 15 0.2673 % 2,031.7
SplitShare 6.23 % 9.14 % 72,246 4.08 15 -0.2025 % 1,787.7
Interest-Bearing 7.08 % 8.13 % 35,895 0.86 2 0.0000 % 1,998.9
Perpetual-Premium 0.00 % 0.00 % 0 0.00 0 -0.0337 % 1,555.8
Perpetual-Discount 6.91 % 6.96 % 208,178 12.63 71 -0.0337 % 1,432.9
FixedReset 6.13 % 5.84 % 702,013 13.84 27 0.0942 % 1,794.2
Performance Highlights
Issue Index Change Notes
CM.PR.K FixedReset -3.45 % YTW SCENARIO
Maturity Type : Limit Maturity
Maturity Date : 2039-02-05
Maturity Price : 21.00
Evaluated at bid price : 21.00
Bid-YTW : 5.54 %
POW.PR.C Perpetual-Discount -2.47 % YTW SCENARIO
Maturity Type : Limit Maturity
Maturity Date : 2039-02-05
Maturity Price : 20.52
Evaluated at bid price : 20.52
Bid-YTW : 7.16 %
NA.PR.N FixedReset -2.45 % YTW SCENARIO
Maturity Type : Limit Maturity
Maturity Date : 2039-02-05
Maturity Price : 22.24
Evaluated at bid price : 22.30
Bid-YTW : 5.00 %
POW.PR.B Perpetual-Discount -2.03 % YTW SCENARIO
Maturity Type : Limit Maturity
Maturity Date : 2039-02-05
Maturity Price : 18.82
Evaluated at bid price : 18.82
Bid-YTW : 7.21 %
BMO.PR.J Perpetual-Discount -1.61 % YTW SCENARIO
Maturity Type : Limit Maturity
Maturity Date : 2039-02-05
Maturity Price : 16.47
Evaluated at bid price : 16.47
Bid-YTW : 6.86 %
RY.PR.E Perpetual-Discount -1.42 % YTW SCENARIO
Maturity Type : Limit Maturity
Maturity Date : 2039-02-05
Maturity Price : 17.35
Evaluated at bid price : 17.35
Bid-YTW : 6.52 %
BNS.PR.K Perpetual-Discount -1.37 % YTW SCENARIO
Maturity Type : Limit Maturity
Maturity Date : 2039-02-05
Maturity Price : 18.06
Evaluated at bid price : 18.06
Bid-YTW : 6.71 %
DFN.PR.A SplitShare -1.25 % Asset coverage of 1.6-:1 as of January 30, according to the company.
YTW SCENARIO
Maturity Type : Hard Maturity
Maturity Date : 2014-12-01
Maturity Price : 10.00
Evaluated at bid price : 8.70
Bid-YTW : 8.18 %
TD.PR.M OpRet -1.24 % YTW SCENARIO
Maturity Type : Soft Maturity
Maturity Date : 2013-10-30
Maturity Price : 25.00
Evaluated at bid price : 25.55
Bid-YTW : 4.22 %
FFN.PR.A SplitShare -1.18 % Asset coverage of 1.1-:1 as of January 30, according to the company.
YTW SCENARIO
Maturity Type : Hard Maturity
Maturity Date : 2014-12-01
Maturity Price : 10.00
Evaluated at bid price : 7.56
Bid-YTW : 11.18 %
SLF.PR.E Perpetual-Discount -1.16 % YTW SCENARIO
Maturity Type : Limit Maturity
Maturity Date : 2039-02-05
Maturity Price : 15.31
Evaluated at bid price : 15.31
Bid-YTW : 7.48 %
CM.PR.I Perpetual-Discount -1.03 % YTW SCENARIO
Maturity Type : Limit Maturity
Maturity Date : 2039-02-05
Maturity Price : 16.33
Evaluated at bid price : 16.33
Bid-YTW : 7.28 %
GWO.PR.H Perpetual-Discount 1.02 % YTW SCENARIO
Maturity Type : Limit Maturity
Maturity Date : 2039-02-05
Maturity Price : 16.81
Evaluated at bid price : 16.81
Bid-YTW : 7.34 %
TD.PR.Y FixedReset 1.06 % YTW SCENARIO
Maturity Type : Limit Maturity
Maturity Date : 2039-02-05
Maturity Price : 21.96
Evaluated at bid price : 22.00
Bid-YTW : 4.68 %
BAM.PR.O OpRet 1.07 % YTW SCENARIO
Maturity Type : Option Certainty
Maturity Date : 2013-06-30
Maturity Price : 25.00
Evaluated at bid price : 19.90
Bid-YTW : 11.22 %
PWF.PR.G Perpetual-Discount 1.09 % YTW SCENARIO
Maturity Type : Limit Maturity
Maturity Date : 2039-02-05
Maturity Price : 21.26
Evaluated at bid price : 21.26
Bid-YTW : 7.01 %
RY.PR.I FixedReset 1.14 % YTW SCENARIO
Maturity Type : Limit Maturity
Maturity Date : 2039-02-05
Maturity Price : 22.06
Evaluated at bid price : 22.10
Bid-YTW : 4.85 %
BMO.PR.H Perpetual-Discount 1.24 % YTW SCENARIO
Maturity Type : Limit Maturity
Maturity Date : 2039-02-05
Maturity Price : 21.31
Evaluated at bid price : 21.31
Bid-YTW : 6.24 %
BCE.PR.Z FixedFloater 1.27 % YTW SCENARIO
Maturity Type : Limit Maturity
Maturity Date : 2039-02-05
Maturity Price : 25.00
Evaluated at bid price : 15.20
Bid-YTW : 7.12 %
TCA.PR.X Perpetual-Discount 1.34 % YTW SCENARIO
Maturity Type : Limit Maturity
Maturity Date : 2039-02-05
Maturity Price : 44.58
Evaluated at bid price : 46.01
Bid-YTW : 6.10 %
BNS.PR.R FixedReset 1.62 % YTW SCENARIO
Maturity Type : Limit Maturity
Maturity Date : 2039-02-05
Maturity Price : 21.86
Evaluated at bid price : 21.90
Bid-YTW : 4.87 %
BNS.PR.Q FixedReset 1.85 % YTW SCENARIO
Maturity Type : Limit Maturity
Maturity Date : 2039-02-05
Maturity Price : 21.96
Evaluated at bid price : 22.00
Bid-YTW : 4.67 %
PWF.PR.E Perpetual-Discount 2.46 % YTW SCENARIO
Maturity Type : Limit Maturity
Maturity Date : 2039-02-05
Maturity Price : 19.99
Evaluated at bid price : 19.99
Bid-YTW : 6.95 %
ENB.PR.A Perpetual-Discount 2.56 % YTW SCENARIO
Maturity Type : Limit Maturity
Maturity Date : 2039-02-05
Maturity Price : 23.36
Evaluated at bid price : 23.65
Bid-YTW : 5.92 %
BAM.PR.J OpRet 3.00 % YTW SCENARIO
Maturity Type : Soft Maturity
Maturity Date : 2018-03-30
Maturity Price : 25.00
Evaluated at bid price : 18.21
Bid-YTW : 10.20 %
Volume Highlights
Issue Index Shares
Traded
Notes
CM.PR.L FixedReset 211,510 Recent new issue
YTW SCENARIO
Maturity Type : Call
Maturity Date : 2014-05-30
Maturity Price : 25.00
Evaluated at bid price : 24.91
Bid-YTW : 6.65 %
BNS.PR.X FixedReset 151,333 Recent new issue.
YTW SCENARIO
Maturity Type : Call
Maturity Date : 2014-05-25
Maturity Price : 25.00
Evaluated at bid price : 24.93
Bid-YTW : 6.40 %
RY.PR.R FixedReset 118,520 Recent new issue.
YTW SCENARIO
Maturity Type : Call
Maturity Date : 2014-03-26
Maturity Price : 25.00
Evaluated at bid price : 24.93
Bid-YTW : 6.40 %
TD.PR.G FixedReset 116,265 Recent new issue.
YTW SCENARIO
Maturity Type : Call
Maturity Date : 2014-05-30
Maturity Price : 25.00
Evaluated at bid price : 24.90
Bid-YTW : 6.42 %
WFS.PR.A SplitShare 84,300 RBC crossed 71,800 at 8.71.
YTW SCENARIO
Maturity Type : Hard Maturity
Maturity Date : 2011-06-30
Maturity Price : 10.00
Evaluated at bid price : 8.58
Bid-YTW : 12.65 %
NA.PR.P FixedReset 35,150 Recent new issue.
YTW SCENARIO
Maturity Type : Call
Maturity Date : 2014-03-17
Maturity Price : 25.00
Evaluated at bid price : 24.85
Bid-YTW : 6.83 %
There were 22 other index-included issues trading in excess of 10,000 shares.

MAPF Performance: January 2009

Thursday, February 5th, 2009

The fund was able to post superb performance in January, greatly in excess of its benchmark. In fact, all I need to do to have a great year is to break even for the next eleven months!

For clients, I must say that I am relieved that absolute return has finally joined relative return in the black.

Returns to January 30, 2009
Period MAPF Index CPD
according to
Claymore
One Month +10.45% +3.98% N/A%
Three Months +17.34% -1.22% N/A%
One Year +4.86% -13.84% N/A
Two Years (annualized) +2.71% -9.68%  
Three Years (annualized) +3.66% -5.26%  
Four Years (annualized) +4.18% -3.15%  
Five Years (annualized) +5.63% -1.65%  
Six Years (annualized) +8.95% 0.00%  
Seven Years (annualized) +8.05% +0.40%  
The Index is the BMO-CM “50”
CPD Returns are for the NAV and are after all fees and expenses.

Returns assume reinvestment of dividends, and are shown after expenses but before fees. Past performance is not a guarantee of future performance. You can lose money investing in Malachite Aggressive Preferred Fund or any other fund. For more information, see the fund’s main page.

All I can say is … don’t expect this every month, folks! Extreme inefficiency in the preferred share market made trading highly profitable and returns were also enhanced by receipt of retraction proceeds from the split-shares WFS.PR.A and FFN.PR.A

When it works, it really, really works!

The yields available on high quality preferred shares remain elevated, which is reflected in the current estimate of sustainable income.

Calculation of MAPF Sustainable Income Per Unit
Month NAVPU Portfolio
Average
YTW
Leverage
Divisor
Securities
Average
YTW
Sustainable
Income
June, 2007 9.3114 5.16% 1.03 5.01% 0.4665
September 9.1489 5.35% 0.98 5.46% 0.4995
December, 2007 9.0070 5.53% 0.942 5.87% 0.5288
March, 2008 8.8512 6.17% 1.047 5.89% 0.5216
June 8.3419 6.034% 0.952 6.338% $0.5287
September 8.1886 7.108% 0.969 7.335% $0.6006
December, 2008 8.0464 9.24% 0.992 9.166% $0.7375
January 2009 8.8875 8.17% 1.008 8.105% $0.7203
NAVPU is shown after quarterly distributions.
“Portfolio YTW” includes cash (or margin borrowing), with an assumed interest rate of 0.00%
“Securities YTW” divides “Portfolio YTW” by the “Leverage Divisor” to show the average YTW on the securities held; this assumes that the cash is invested in (or raised from) all securities held, in proportion to their holdings.
“Sustainable Income” is the best available estimate of the fund’s dividend income per unit, before fees and expenses.

As discussed in the post MAPF Portfolio Composition: January 2009, the fund has positions in splitShares, which complicate the calculation greatly. Since the yield is, by and large, higher than that of the perpetuals despite the fact that the term is limited, the sustainability of the calculated “sustainable yield” is suspect, as discussed in August.

Additionally, the calculated yield for the fixed-floater in the portfolio, BCE.PR.I, depends on the presumed value of Canada Prime (3.00%) and the percentage of Canada Prime paid on par value (100%); both of these figures may change. Prime did, in fact, change this month and the presumed future dividend payments for BCE.PR.I changed from $25 * 0.035 = 0.875 to $25 * 0.03 = 0.75. This effect accounted for the bulk of the decline in estimated sustainable income … but frankly, I’m happy that trading in the fund was effective in offsetting the negative effects on the calculation of reducing the holdings of high-yielding short-term instruments, the split shares.

However, if the entire portfolio except for the PerpetualDiscounts were to be sold and reinvested in these issues, the yield of the portfolio would be the 7.28% shown in the January 30 Portfolio Composition analysis (which is in excess of the 6.85% index yield on January 30). Given such reinvestment, the sustainable yield would be 8.8875 * 0.0728 = $0.6470, an increase from the $0.6027 derived by a similar calculation last month.

Different assumptions lead to different calculations, but the overall positive trend is apparent. I’m very pleased with the results! It will be noted that if there was no trading in the portfolio, one would expect the sustainable yield to be constant (before fees and expenses). The success of the fund’s trading is showing up in

  • the very good performance against the index
  • the long term increases in sustainable income per unit

As has been noted, the fund has maintained a credit quality equal to or better than the index; outperformance is due to constant exploitation of trading anomalies.

The fixed-floater postion discussed last month remains – but is much more profitable than it was

Post-Mortem on BCE.PR.I Purchase
Date BCE.PR.I SLF.PR.E BMO.PR.K NA.PR.L
Nov. 28 17.00 13.60 16.75 15.00
Dec. 22 Bought
13.00
Sold
12.50
   
Dec 23 Bought
13.03
  Sold
15.50
Sold
14.36
Closing Bid
Dec 31
13.50 15.18 18.51 15.58
Closing Bid
Jan. 30
15.80 15.48 19.58 17.66
Dividend
Effects
December
Earned
$0.29
None None None
Dividend
Effects
January
None None None Missed $0.30

So, again, there are no predictions for the future. The fund will continue to trade between issues in an attempt to exploit market gaps in liquidity, in an effort to outperform the index and keep the sustainable income per unit – however calculated! – growing.

New Issue: Canadian Western Bank Fixed-Reset 7.25%+500

Thursday, February 5th, 2009

Canadian Western Bank has announced:

that it has entered into an agreement with a group of underwriters led by Genuity Capital Markets to issue 2,600,000 Preferred Units (the “Public Offering Preferred Units”) on a bought deal basis for total proceeds of $65 million. The Public Offering Preferred Units each consist of one Non-Cumulative 5-Year Rate Reset Preferred Share, Series 3 (the “Series 3 Preferred Shares”) in the capital of the Bank with an issue price of $25.00 per share and 1.78 common share purchase warrants (each whole warrant a “Warrant”). Each Warrant will be exercisable at a price of $14.00 to purchase one common share in the capital of the Bank for five years. The Bank has also granted the underwriters an option to purchase, on the same terms, up to an additional 390,000 Public Offering Preferred Units. This option is exercisable in whole or in part by the underwriters at any time up to 30 days following the closing of the offering. The maximum gross proceeds raised under the public offering would be $74.75 million should this option be exercised in full.

The Bank has also received commitments from institutional investors, including Fairfax Financial Holdings Limited and certain pension fund clients of Alberta Investment Management Corporation, to purchase 5,400,000 Preferred Units (the “Private Placement Preferred Units”) by way of a private placement for total proceeds of $135 million. The Private Placement Preferred Units will consist of one Series 3 Preferred Share and 1.7857 Warrants. The Warrants will have the same terms at those issued under the public offering.

The private and public offerings are subject to a number of conditions, including the concurrent closing of the other. The private placement is also subject to the approval of the Minister of Finance.

The Series 3 Preferred Shares yield 7.25% annually, payable quarterly, as and when declared by the Board of Directors of CWB for an initial period ending April 30, 2014. Thereafter, the dividend rate will reset every five years at a level of 500 basis points over the then five-year Government of Canada bond yield. Holders of Series 3 Preferred Shares will, subject to certain conditions, have the option to convert their shares to Non-Cumulative Floating Rate Preferred Shares, Series 4 (the “Series 4 Preferred Shares”) on April 30, 2014 and on April 30 every five years thereafter. Holders of the Series 4 Preferred Shares will be entitled to a floating quarterly dividend rate equal to the 90-day Canadian Treasury Bill Rate plus 500 basis points, as and when declared by the Board of Directors of CWB.

The Preferred Shares Series 3 and the Preferred Shares Series 4 are anticipated to qualify as Tier 1 capital for the Bank and the closing date will be subject to the timing of the approval from the Minister of Finance. CWB will make an application to list the warrants and the Series 3 Preferred Shares as of the closing date on the Toronto Stock Exchange. CWB’s Tier 1 capital ratio was 8.9% and its total capital ratio was 13.5% as of October 31, 2008. On the assumption that $200 million of preferred units are issued through these offerings, the pro forma Tier 1 and total capital ratios as of October 31, 2008 would be approximately 11.2% and 15.8%, respectively.

Well, there’s some things going on here that I don’t understand. Why are “certain pension fund clients of Alberta Investment Management Corporation” purchasing units? Is it for flipping? Regional Pride? A sweetheart deal? Stupidity? Why would a non-taxable investor buy these things? I want to know the answer. We’ve had quite enough market-rigging by regional government-sponsored pension funds and their allies in Canada recently, thank you very much.

I also want to know why there isn’t a credit rating on these things. CWB’s recent issue of sub-debt was not and is not rated. Why isn’t CWB lifting its skirts for the rating agencies? CWB certainly looks well capitalized at this point, but I want a little public pressure in bad times for the bank to clean itself up; and the most trustworthy sparkplug for this public pressure remains the credit rating agencies.

This issue will not be tracked by HIMIPref™.

IIROC Report on Short Selling Ban

Wednesday, February 4th, 2009

IIROC has released its Study on the Impact of the Prohibition on the Short Sale of Interlisted Financial Sector Issuers. This report, according to the press release:

was undertaken at the request of the Canadian Securities Administrators to examine the impact of the Ontario Securities Commission Order prohibiting short sales of certain financial sector issuers (“Restricted Financials”) on trading activity. The Order, issued on September 19, 2008, prohibited short sales of Restricted Financials listed on the Toronto Stock Exchange that were also inter-listed with exchanges in the United States. The IIROC study shows that, prior to the introduction of the prohibition on short sales, short selling activity in Restricted Financials was generally consistent with historic levels of short selling for inter-listed securities.

A big argument in favour of the short selling ban, as some may remember, was:

prevent regulatory arbitrage with respect to short selling in Ontario of the securities of Restricted Financials as a result of initiatives undertaken in the United States by the Securities and Exchange Commission (“SEC”)

Geez, you know, I’ve always thought that one of the differences between Canada and the US is that in Canada we are not subject to US law; we get to make up our own laws instead. Now, I am more than willing to agree that a little communication, if not cooperation, is always in order; and I will also agree that from time to time we will defer to our gigantic neighbor simply because they control the game; and I will also agree that in the case of interlisted securities a difference in short-selling rules could cause unknown-and-possibly-bad things to happen to market tone … but none of these rationales were addressed. In today’s brave new world it is, apparently, entirely sufficient to mumble something about “regulatory arbitrage” without the need to complicate matters by determining what is good for Canadian markets and good for Canada.

I would have met each US political blather about bonus control and criminalization of CDS trading with a political announcement that such activities in Canada were not just going to be encouraged, but actually subsidized! Let’s steal all their business, that’s what I say! But I digress.

One source of amusement is IIROC’s use of significant figures:

For example, as at August 1, 2008, the market capitalization for the Restricted Financials as a group was $291,409,251,788 ranging from a high of $62,525,252,799 for Royal Bank of Canada to a low of $138,929,587 for Thomas Weisel Partners Group Inc. with three other securities having a market capitalization of less than $400,000,000.

It is rare that I see a report containing twelve significant figures (was that at the ask, the bid, the close, the Volume-Weighted-Average-Price, or what, I wonder) and I thank IIROC for publishing these data.

The summary of findings is consistent with everything else I’ve seen:

In summary, during the Study Period:
• the issuance of the Orders did not appear to have had any appreciable effect on the price of securities of either Restricted Financials or Non-Restricted Financial (both of which have performed better than benchmark index of market performance);
• there were “unusual” levels of activity in “financial sector” securities (both the Restricted and Non-Restricted Financials) in the Pre-Order Week;
• the proportion of short sales of Restricted Financials in the Pre-Order Period was in line with, or less than, historic patterns and the evels of short selling for inter-listed securities generally;
• there was no evidence of undue short selling pressure in the Non-Restricted Financials in the Pre-Order Period (including the Pre-Order Week);
• the issuance of the Orders appeared to have had a significant impact on market quality for the trading of the Restricted Financials by:
o reducing liquidity available in the Restricted Financials, and
o increasing the “spread” for Restricted Financials as measured by the difference between the closing bid and ask prices;

However, the most delicious thing about the report is the selection of the control group – the “Non-Restricted Financials”:

The Original Temporary Order applied to the securities of the Restricted Financials, being thirteen issuers from the financial sector that are listed on the TSX and also listed on an exchange in the United States and subject to the initiatives taken by the SEC. IIROC identified seventy-seven other issuers in the financial sector, of which thirty-three securities (“Non-Restricted Financials”) had more than minimal trading activity during the Pre-Order Period.6 Appendix “A” lists the securities which are considered either a Restricted Financial or a Non-Restricted Financial.

Where possible, the analysis compares the performance of the Restricted Financials and the Non-Restricted Financials with the performance of the S&P/TSX Composite Index. Certain of the measures used in the analysis therefore weight the results for the Restricted Financials and Non-Restricted Financials by their market capitalization. Market capitalization was calculated by multiplying the issued capital of each Restricted Financial as at August 31, 2008 by the relevant price for a particular trading day.

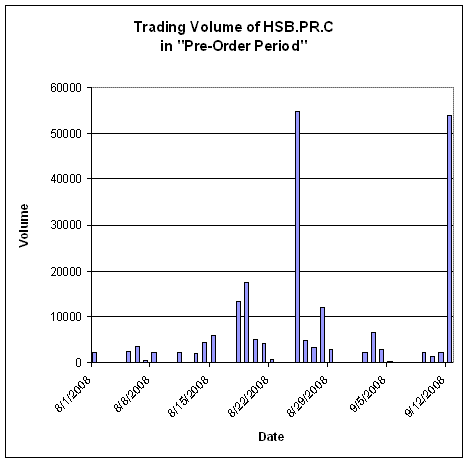
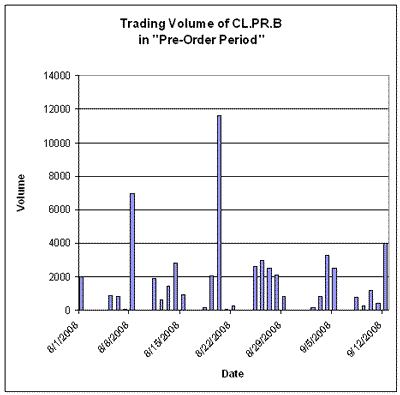
Turning to Appendix A, we find two somewhat startling inclusions in the Non-Restricted Financials: CL.PR.B and HSB.PR.C.

The data is not presented in fine enough detail for the impact of the inclusion of preferred shares in the control group to be estimated; I suspect that the effect was small. But to the extent that there was any effect at all, it should have been regarded as irrelevant.

I sympathize with IIROC with respect to the problems they faced in compiling a control group for the major financial issuers … but they might appreciate some advice from an old quant: If you don’t have the data, don’t do the analysis.

Update, 2013-11-13: Link to report updated.

February 4, 2009

Wednesday, February 4th, 2009

It seems that PrefBlog is persuading the world that Bad Bank = Bad Idea:

The Obama administration, aiming to overhaul the $700 billion financial-rescue program, is refocusing on an effort to guarantee illiquid assets against losses without taking them off banks’ balance sheets.

Treasury Secretary Timothy Geithner is skeptical of setting up a so-called bad bank to hold the toxic securities, an option that still may form part of the final package, people familiar with the matter said. Senator Charles Schumer yesterday said debt guarantees are becoming “a favorite choice” of options because a bad bank would be too costly.

Across the curve is skeptical:

The process of repairing the banking system (read the nursery rhyme Humpty Dumpty) is proving to be a challenge for the Obama Administration. News reports indicate that the bad bank idea is losing followers and that the Administration seems to be turning to idea of massive guarantees of the flotsam and jetsam in bank portfolios. As one commentator noted, that has not worked out so well for the stock price of Citibank and B of A.

PerpetualDiscounts were off slightly today on good volume and now yield 6.98% – the equivalent of 9.77% interest at the standard equivalency factor of 1.4x. Long Corporates remain fairly steady at 7.6%, so the Pre-Tax Interest-Equivalent Spread has widened slightly to +217bp.

HIMIPref™ Preferred Indices
These values reflect the December 2008 revision of the HIMIPref™ Indices

Values are provisional and are finalized monthly
Index Mean
Current
Yield
(at bid)
Median
YTW
Median
Average
Trading
Value
Median
Mod Dur
(YTW)
Issues Day’s Perf. Index Value
Ratchet 5.37 % 3.87 % 24,931 17.61 2 -0.3316 % 856.6
FixedFloater 7.26 % 6.93 % 66,917 13.93 7 0.5253 % 1,382.8
Floater 5.39 % 4.46 % 30,777 16.48 4 0.2058 % 974.2
OpRet 5.30 % 4.80 % 159,681 4.02 15 0.0110 % 2,026.2
SplitShare 6.22 % 8.85 % 72,465 4.09 15 -0.0016 % 1,791.3
Interest-Bearing 7.08 % 8.10 % 35,747 0.87 2 -0.1154 % 1,998.9
Perpetual-Premium 0.00 % 0.00 % 0 0.00 0 -0.0920 % 1,556.3
Perpetual-Discount 6.91 % 6.98 % 215,135 12.64 71 -0.0920 % 1,433.4
FixedReset 6.14 % 5.87 % 713,258 13.80 27 0.0074 % 1,792.5
Performance Highlights
Issue Index Change Notes
BNA.PR.B SplitShare -4.42 % Asset coverage of 1.8+:1 as of December 31 according to the company.
YTW SCENARIO
Maturity Type : Hard Maturity
Maturity Date : 2016-03-25
Maturity Price : 25.00
Evaluated at bid price : 20.32
Bid-YTW : 8.74 %
BNS.PR.N Perpetual-Discount -2.36 % YTW SCENARIO
Maturity Type : Limit Maturity
Maturity Date : 2039-02-04
Maturity Price : 19.43
Evaluated at bid price : 19.43
Bid-YTW : 6.82 %
PWF.PR.G Perpetual-Discount -2.19 % YTW SCENARIO
Maturity Type : Limit Maturity
Maturity Date : 2039-02-04
Maturity Price : 21.03
Evaluated at bid price : 21.03
Bid-YTW : 7.08 %
PWF.PR.E Perpetual-Discount -2.01 % YTW SCENARIO
Maturity Type : Limit Maturity
Maturity Date : 2039-02-04
Maturity Price : 19.51
Evaluated at bid price : 19.51
Bid-YTW : 7.12 %
BAM.PR.B Floater -1.81 % YTW SCENARIO
Maturity Type : Limit Maturity
Maturity Date : 2039-02-04
Maturity Price : 7.61
Evaluated at bid price : 7.61
Bid-YTW : 7.01 %
TD.PR.S FixedReset -1.36 % YTW SCENARIO
Maturity Type : Limit Maturity
Maturity Date : 2039-02-04
Maturity Price : 21.70
Evaluated at bid price : 21.75
Bid-YTW : 4.62 %
RY.PR.I FixedReset -1.35 % YTW SCENARIO
Maturity Type : Limit Maturity
Maturity Date : 2039-02-04
Maturity Price : 21.81
Evaluated at bid price : 21.85
Bid-YTW : 4.91 %
GWO.PR.H Perpetual-Discount -1.30 % YTW SCENARIO
Maturity Type : Limit Maturity
Maturity Date : 2039-02-04
Maturity Price : 16.64
Evaluated at bid price : 16.64
Bid-YTW : 7.41 %
POW.PR.C Perpetual-Discount -1.27 % YTW SCENARIO
Maturity Type : Limit Maturity
Maturity Date : 2039-02-04
Maturity Price : 21.04
Evaluated at bid price : 21.04
Bid-YTW : 6.98 %
POW.PR.B Perpetual-Discount -1.23 % YTW SCENARIO
Maturity Type : Limit Maturity
Maturity Date : 2039-02-04
Maturity Price : 19.21
Evaluated at bid price : 19.21
Bid-YTW : 7.06 %
NA.PR.L Perpetual-Discount -1.19 % YTW SCENARIO
Maturity Type : Limit Maturity
Maturity Date : 2039-02-04
Maturity Price : 17.45
Evaluated at bid price : 17.45
Bid-YTW : 7.00 %
POW.PR.A Perpetual-Discount -1.18 % YTW SCENARIO
Maturity Type : Limit Maturity
Maturity Date : 2039-02-04
Maturity Price : 20.85
Evaluated at bid price : 20.85
Bid-YTW : 6.80 %
WFS.PR.A SplitShare -1.15 % Asset coverage of 1.1+:1 as of January 31 according to Mulvihill.
YTW SCENARIO
Maturity Type : Hard Maturity
Maturity Date : 2011-06-30
Maturity Price : 10.00
Evaluated at bid price : 8.56
Bid-YTW : 12.74 %
CM.PR.K FixedReset -1.14 % YTW SCENARIO
Maturity Type : Limit Maturity
Maturity Date : 2039-02-04
Maturity Price : 21.44
Evaluated at bid price : 21.75
Bid-YTW : 5.32 %
PWF.PR.A Floater 1.11 % YTW SCENARIO
Maturity Type : Limit Maturity
Maturity Date : 2039-02-04
Maturity Price : 11.86
Evaluated at bid price : 11.86
Bid-YTW : 4.43 %
SLF.PR.C Perpetual-Discount 1.45 % YTW SCENARIO
Maturity Type : Limit Maturity
Maturity Date : 2039-02-04
Maturity Price : 15.38
Evaluated at bid price : 15.38
Bid-YTW : 7.36 %
CU.PR.B Perpetual-Discount 1.65 % YTW SCENARIO
Maturity Type : Limit Maturity
Maturity Date : 2039-02-04
Maturity Price : 22.56
Evaluated at bid price : 22.76
Bid-YTW : 6.60 %
CIU.PR.A Perpetual-Discount 1.74 % YTW SCENARIO
Maturity Type : Limit Maturity
Maturity Date : 2039-02-04
Maturity Price : 16.50
Evaluated at bid price : 16.50
Bid-YTW : 6.99 %
DF.PR.A SplitShare 1.89 % Asset coverage of 1.4-:1 as of January 30 according to the company.
YTW SCENARIO
Maturity Type : Hard Maturity
Maturity Date : 2014-12-01
Maturity Price : 10.00
Evaluated at bid price : 9.18
Bid-YTW : 7.06 %
BNA.PR.C SplitShare 1.90 % Asset coverage of 1.8+:1 as of December 31 according to the company.
YTW SCENARIO
Maturity Type : Hard Maturity
Maturity Date : 2019-01-10
Maturity Price : 25.00
Evaluated at bid price : 11.82
Bid-YTW : 14.91 %
TD.PR.A FixedReset 2.06 % YTW SCENARIO
Maturity Type : Limit Maturity
Maturity Date : 2039-02-04
Maturity Price : 22.21
Evaluated at bid price : 22.25
Bid-YTW : 4.86 %
IAG.PR.A Perpetual-Discount 2.40 % YTW SCENARIO
Maturity Type : Limit Maturity
Maturity Date : 2039-02-04
Maturity Price : 16.66
Evaluated at bid price : 16.66
Bid-YTW : 7.02 %
NA.PR.N FixedReset 2.60 % YTW SCENARIO
Maturity Type : Limit Maturity
Maturity Date : 2039-02-04
Maturity Price : 22.80
Evaluated at bid price : 22.86
Bid-YTW : 4.87 %
BAM.PR.O OpRet 2.77 % YTW SCENARIO
Maturity Type : Option Certainty
Maturity Date : 2013-06-30
Maturity Price : 25.00
Evaluated at bid price : 19.69
Bid-YTW : 11.50 %
BCE.PR.R FixedFloater 2.82 % YTW SCENARIO
Maturity Type : Limit Maturity
Maturity Date : 2039-02-04
Maturity Price : 25.00
Evaluated at bid price : 15.70
Bid-YTW : 6.82 %
Volume Highlights
Issue Index Shares
Traded
Notes
CM.PR.L FixedReset 432,749 New issue settled today.
YTW SCENARIO
Maturity Type : Call
Maturity Date : 2014-05-30
Maturity Price : 25.00
Evaluated at bid price : 24.90
Bid-YTW : 6.65 %
TD.PR.G FixedReset 153,349 Recent new issue.
YTW SCENARIO
Maturity Type : Limit Maturity
Maturity Date : 2039-02-04
Maturity Price : 24.76
Evaluated at bid price : 24.81
Bid-YTW : 6.50 %
RY.PR.R FixedReset 151,650 Recent new issue.
YTW SCENARIO
Maturity Type : Call
Maturity Date : 2014-03-26
Maturity Price : 25.00
Evaluated at bid price : 24.90
Bid-YTW : 6.42 %
BNS.PR.X FixedReset 78,157 Recent new issue.
YTW SCENARIO
Maturity Type : Call
Maturity Date : 2014-05-25
Maturity Price : 25.00
Evaluated at bid price : 24.84
Bid-YTW : 6.48 %
RY.PR.H Perpetual-Discount 60,183 RBC crossed 52,300 at 21.25.
YTW SCENARIO
Maturity Type : Limit Maturity
Maturity Date : 2039-02-04
Maturity Price : 21.02
Evaluated at bid price : 21.02
Bid-YTW : 6.75 %
GWO.PR.X OpRet 59,850 Nesbitt crossed 50,000 at 25.05.
YTW SCENARIO
Maturity Type : Soft Maturity
Maturity Date : 2013-09-29
Maturity Price : 25.00
Evaluated at bid price : 25.00
Bid-YTW : 4.94 %
There were 32 other index-included issues trading in excess of 10,000 shares.

CM.PR.L Closes – A Little Wobbly but Fine

Wednesday, February 4th, 2009

CIBC has announced:

that it completed the offering of 13 million non-cumulative Rate Reset Class A Preferred Shares Series 35 (the “Series 35 Shares”) priced at $25.00 per share to raise gross proceeds of $325 million.

The offering was made through a syndicate of underwriters led by CIBC World Markets Inc. Following the successful sale of the previously announced 10 million Series 35 Shares, the underwriters exercised an option to purchase an additional 3 million shares. The Series 35 Shares commence trading on the Toronto Stock Exchange today under the ticker symbol CM.PR.L.

The Fixed-Reset 6.50%+447 was announced last week with an original size of 8-million shares plus a 3-million greenshoe, quickly bumped up to 10+3.

Today it traded 432,749 shares in a range of 24.60-94 before settling at 24.90-93, 20×21. The issue has been added to the HIMIPref™ Fixed-Reset subindex.

MAPF Portfolio Composition: January 2009

Wednesday, February 4th, 2009

Trading was relatively heavy in January, with portfolio turnover of about 120%, as the late-December rally continued for the first half of the month and then settled in for a more traditional grind. The market was also affected by heavy issuance of Fixed-Resets, many of which had their issue sizes bumped upwards to meet investor demand. These Fixed-Reset issues seem to have found a new level for the initial fixed rate: 6.25% which is much more interesting than the 5.00% of last year. While still rather expensive as a class, the newer issues are at the point where they are becoming competitive with straight perpetuals.

Trades were, as ever, triggered by a desire to exploit transient mispricing in the preferred share market (which may the thought of as “selling liquidity”), rather than any particular view being taken on market direction, sectoral performance or credit anticipation.

MAPF Sectoral Analysis 2009-1-30
HIMI Indices Sector Weighting YTW ModDur
Ratchet 0% N/A N/A
FixFloat 9.9% (+0.7) 6.95% 13.87
Floater 0% N/A N/A
OpRet 0% N/A N/A
SplitShare 12.2% (-20.8) 14.89% 6.32
Interest Rearing 0% N/A N/A
PerpetualPremium 0.0% (0) N/A N/A
PerpetualDiscount 71.5% (+12.9) 7.28% 12.27
Fixed-Reset 7.2%% (+7.2) 6.34% 13.45
Cash -0.8% (0) 0.00% 0.00
Total 100% 8.17% 11.82
Totals and changes will not add precisely due to rounding. Bracketted figures represent change from December month-end. Cash is included in totals with duration and yield both equal to zero.

The “total” reflects the un-leveraged total portfolio (i.e., cash is included in the portfolio calculations and is deemed to have a duration and yield of 0.00.). MAPF will often have relatively large cash balances, both credit and debit, to facilitate trading. Figures presented in the table have been rounded to the indicated precision.

Positions held in the split-share corporations WFS.PR.A and FTN.PR.A were tendered for their monthly retraction in mid-December and retraction proceeds were received in mid-January. The retraction was highly profitable.

The fund’s closing position in the Fixed-Reset BNS.PR.X arrived by a circuitous route:

Post-Mortem on BNS.PR.X Purchase
Date BNS.PR.X TD.PR.E NA.PR.O BMO.PR.L BMO.PR.K
Dec. 31 N/A N/A N/A 19.62 18.51
Jan. 14     Bought
24.85
Sold
21.75
Sold
19.76
Jan. 21   Bought
25.07
Sold
25.00
   
Jan. 30 Bought
24.91
Sold
25.04
     
Closing Bid
Jan. 30
24.90 25.02 24.90 21.35 19.60
Dividend
Effects
None None None None None

Perhaps not the most profitable sequence of trades ever presented on this website, but they did a reasonable job of protecting the capital gains earned at mid-month! It should be noted that HIMIPref™ works by comparing like securities to like and is very cautious when swapping between classes … the impetus of initial trade was only partially direct analysis that NA.PR.O was more attractive than BMO.PR.K & BMO.PR.L; a major driving force of the trade was that the NA issue when taken relative to other fixed-resets was more attractive than the BMO issues relative to other PerpetualDiscounts.

Credit distribution is:

MAPF Credit Analysis 2009-1-30
DBRS Rating Weighting
Pfd-1 60.4% (+4.3)
Pfd-1(low) 6.1% (+3.0)
Pfd-2(high) 9.3% (+9.3)
Pfd-2
(held)
0.4 (-10.9)
Pfd-2(low)
(held)
24.6 (-5.8)
Cash -0.8% (0)
Totals will not add precisely due to rounding. Bracketted figures represent change from December month-end.

The fund does not set any targets for overall credit quality; trades are executed one by one. Variances in overall credit will be constant as opportunistic trades are executed. The overall credit quality of the portfolio is now superior to the credit quality of CPD at August month-end.

The lowest rated issues in the portfolio are BCE.PR.I and BNA.PR.C. The latter issue is an entirely reasonable credit; a split share secured by shares of BAM.A with asset coverage that continues to be about 1.8:1.

Liquidity Distribution is:

MAPF Liquidity Analysis 2009-1-30
Average Daily Trading Weighting
<$50,000 0.5% (-0.1)
$50,000 – $100,000 13.5% (+3.0)
$100,000 – $200,000
(held)
39.9% (-2.7)
$200,000 – $300,000 20.4% (+10.1)
>$300,000 26.5% (+9.6)
Cash -0.8% (0)
Totals will not add precisely due to rounding. Bracketted figures represent change from December month-end.

MAPF is, of course, Malachite Aggressive Preferred Fund, a “unit trust” managed by Hymas Investment Management Inc. Further information and links to performance, audited financials and subscription information are available the fund’s web page. A “unit trust” is like a regular mutual fund, but is sold by offering memorandum rather than prospectus. This is cheaper, but means subscription is restricted to “accredited investors” (as defined by the Ontario Securities Commission) and those who subscribe for $150,000+. Fund past performances are not a guarantee of future performance. You can lose money investing in MAPF or any other fund.

A similar portfolio composition analysis has been performed on The Claymore Preferred Share ETF (symbol CPD) as of August 29. When comparing CPD and MAPF:

  • MAPF credit quality is better
  • MAPF liquidity is higher
  • MAPF Yield is higher
  • Weightings in
    • PerpetualDiscounts is similar
    • MAPF is much less exposed to Operating Retractibles
    • MAPF is more exposed to SplitShares
    • FixFloat / Floater / Ratchet is similar
    • MAPF is slightly less exposed to Fixed-Resets

HIMIPref™ Preferred Indices: January 2009

Tuesday, February 3rd, 2009
HIMI Index Values 2009-1-30
These values reflect the December 2008 Revision
Index Closing Value (Total Return) Issues Mean Credit Quality Median YTW Median DTW Median Daily Trading Mean Current Yield
Ratchet 851.6 2 2.00 3.93% 17.5 26M 5.43%
FixedFloater 1,384.7 7 2.00 6.96% 13.9 159M 7.25%
Floater 943.7 4 1.71 4.75% 16.0 33M 5.57%
OpRet 2,023.7 15 1.36 4.92% 4.0 164M 5.31%
SplitShare 1,789.8 15 2.00 9.05% 4.10 76M 6.23%
Interest-Bearing 2,004.7 2 2.00 8.21% 0.9 36M 7.06%
Perpetual-Premium 1,562.2 0 N/A N/A N/A N/A N/A
Perpetual-Discount 1,438.7 71 1.24 6.85% 12.7 223M 6.87%
FixedReset 1,797.9 26 1.04 5.44% 14.3 761M 6.10%

For Index Revisions during January 2009, see the post HIMIPref™ Index Rebalancing: January 2009.

Publication of index details is embargoed for six months following index date.

Index Performance: January 2009

Tuesday, February 3rd, 2009

Performance of the HIMIPref™ Indices for January, 2009, was:

Total Return
Index Performance
January 2009
Three Months
to
January 30, 209
Ratchet +7.03% -34.62%
FixFloat +10.59% -23.58%
Floater -4.35% -14.04%
OpRet +2.83% +2.63%
SplitShare +1.75% +0.46%
Interest +9.18% -3.88%
PerpetualPremium +6.45%* +1.18%*
PerpetualDiscount +6.45% +1.18%%
FixedReset +0.26% -7.32%
* The last member of the PerpetualPremium index was transferred to PerpetualDiscount at the October rebalancing; subsequent performance figures are set equal to the PerpetualDiscount index
Funds (see below for calculations)
CPD +3.26% -1.52%
DPS.UN +5.71% -2.78%
Index
BMO-CM 50 +3.98% -1.21%

That, by the way, is the best monthly return for the IndexBearing sub-index on record.

Claymore has published NAV and distribution data for its exchange traded fund (CPD) and I have derived the following table:

CPD Return, 1- & 3-month, to January 30, 2009
Date NAV Distribution Return for Sub-Period Monthly Return
October 31 15.04      
November 28, 2008 13.37 0.00   -11.10%
Dec 24 12.92 0.2135 -1.77% +7.28%
Dec 31, 2008 14.11   +9.21%
January 30, 2009 14.57 0.00   +3.26%
Quarterly Return -1.52%

The DPS.UN NAV for January 28 has been published so we may calculate the January returns (approximately!) for this closed end fund.

DPS.UN NAV Return, January-ish 2009
Date NAV Distribution Return for period
December 31, 2008 15.64    
January 28, 2009 16.51   +5.56%
Estimated January Ending Stub +0.14%
Estimated January Return +5.71%
* CPD had a NAV of $14.55 on January 28 and $14.57 on January 30. Return for this period for CPD was therefore +0.14%.
The January return for DPS.UN’s NAV is therefore the product of two period returns, +5.56% and +0.14%, to arrive at an estimate for the calendar month of +5.71%

Now, to see the DPS.UN quarterly NAV approximate return, we refer to the calculations for November and December

DPS.UN NAV Returns, three-month-ish to end-January-ish, 2009
November-ish -12.95%
December-ish +5.65%
January-ish +5.71%
Three-months-ish -2.78%

February 3, 2009

Tuesday, February 3rd, 2009

The Fed has announced that the alphabet soup of liquidity support will be with us for some time yet:

The Board of Governors approved the extension through October 30 of the Asset-Backed Commercial Paper Money Market Mutual Fund Liquidity Facility (AMLF), the Commercial Paper Funding Facility (CPFF), the Money Market Investor Funding Facility (MMIFF), the Primary Dealer Credit Facility (PDCF), and the Term Securities Lending Facility (TSLF). The FOMC also took action to extend the TSLF, which is established under the joint authority of the Board and the FOMC.

These are tough times for Tier 1 Capital at the banks in the eye of the storm:

The market for securities with characteristics of both debt and equity that Citigroup Inc., Bank of America Corp. and other financial companies used to bolster their capital is in freefall on concern governments will stop banks that took public cash from paying interest. The hybrids, which typically count as regulatory capital to cushion against losses, fell 11 percent last month in the U.S., more than they did in all of 2008, according to Merrill Lynch & Co. index data. Citigroup and Bank of America bonds lost as much as 34 percent of their value.

Only $694 million of preferred securities were sold in the U.S. since September, when the government closed the market by seizing Fannie Mae and Freddie Mac. That compares with about $44 billion in the first three quarters of last year, according to data compiled by Bloomberg.

$694-million preferreds [and in the States, remember, this figure will include what we call Innovative Tier 1 Capital] in 4Q08? Hell, up here in Canada we do that in a week!

It’s not often Canadians have the opportunity to lord it over the global titans, so let’s enjoy it while we can!

Econbrowser‘s Menzie Chinn writes a piece on multipliers that I can only hope Pussycat and What-Debt? will read:

For some people, the answer to every question is…a tax cut!

I think the “wrong” kind of interventions include a slavish devotion to tax cuts — especially when the [Marginal Propensity to Consume] [3] could be argued to be low in the aggregate (although I still believe it would be relative high for liquidity constrained households).

Accrued Interest likes the “Bad Bank” idea but I continue to believe:

  • All previous efforts to entice banks into selling “toxic assets” have failed
  • Caballero’s idea of ‘tail-insurance’ is the best way forward.

Donato Masciantdaro and Marc Quintyn write a piece on VoxEU introducing their formal paper on bank supervision:

Our CEPR Policy Insight No. 30, released today, summarises the answers provided so far. One of the interesting features of the current supervisory landscape is the emerging dichotomy between the role of the central bank in supervision and the trend toward supervisory unification. In a majority of countries that have opted for a unified supervisor, the central bank has been given no role in supervision. On the other side of the spectrum, in those countries that stayed close to the “silo” approach to supervision, the central bank is the main (or sole) bank supervisor in a majority of cases. This phenomenon – that the degree of supervision unification seems to be inversely correlated with central bank involvement – has been labelled the “central bank fragmentation effect”

Similarly, Patrick Bajari, Chenguan Sean Chu and Minjung Park introduce their NBER Paper An Empirical Model of Subprime Mortgage Default from 2000 to 2007 in a VoxEU piece Quantifying the triggers of subprime mortgage defaults:

A decomposition using our estimation results indicates that the nationwide decrease in home prices accounts for roughly half the increase in default propensity of loans originated in 2006 compared to 2004-vintage loans. With home prices down by more than 20% from their peaks in many US cities, borrowers whose outstanding mortgage liabilities now exceed their home values can in effect increase their wealth by walking away from their loans. Our estimates indicate that, for a borrower who purchased a home one year earlier with a 30-year fixed-rate mortgage and no down payment, a 20% decline in home price makes the borrower 15.4% more likely to default than an otherwise identical borrower whose home price remained stable.

However, we also find that household illiquidity is an equally important factor behind the increasing propensity of borrowers to default. Our parameter estimates indicate that roughly half the increase in default probability for 2006-vintage loans relative to 2004-vintage loans can be attributed to deterioration over time in observed characteristics of the borrower pool. In particular, later borrowers tend to have lower credit scores and a higher probability of having undocumented loans or additional liens on their properties—indicators of a greater risk of illiquidity due to insufficient income or lack of access to other forms of credit. We also see an increase over time in the proportion of adjustable-rate mortgages among new originations. Adjustable-rate mortgages are generally chosen by more liquidity-constrained borrowers, and often come with large, periodic increases to monthly payments, forcing liquidity-constrained borrowers to default.

Because we find empirical importance for both illiquidity and net equity as drivers of default, this suggests that effectively mitigating foreclosures would require either some combination of policies targeting each cause, or a single instrument that targets both. For example, loan modifications that merely increase payment affordability by extending loan lengths would not be very effective as a standalone measure, as they would leave borrowers’ equity positions unchanged. On the other hand, write-downs on loan principal amounts would address both causes simultaneously, with the reduction in loan size serving both to increase the borrower’s net equity as well as reduce monthly payments.

But today’s prize-winning essay – give that man a kewpie doll! – is from Thomas Philippon, who eschews slogan-shouting while asking the question Are bankers paid too much?:

Evidence from a new century-long dataset suggests that the key factors driving relative wages in the financial sector have been regulation and corporate finance activity, followed by financial innovation. Over the past decade, however, “rents” account for 30% to 50% of the sector’s wage differential. In this sense, financiers are overpaid.

Our investigation reveals a very tight link between deregulation and human capital in the financial sector. Highly skilled labour left the financial sector in the wake of Depression era regulations, and started flowing back precisely when these regulations were removed. This link holds both for finance as a whole, as well as for subsectors within finance. Along with our relative complexity indices, this suggests that regulation inhibits the ability to exploit the creativity and innovation of educated and skilled workers. Deregulation unleashes creativity and innovation and increases demand for skilled workers.

The second set of forces that appear to have a large influence on the demand for skills in finance are non-financial corporate activities: in particular, IPOs and credit risk. New firms are difficult to value because they are often associated with new technologies or new business models, and also for the obvious reason that they do not have a track record. Similarly, pricing and hedging risky debt is an order of magnitude harder than pricing and hedging government debt. Indeed, we find that increases in aggregate IPO activities and credit risk predict increases in human capital intensity in the financial industry. Computers and information technology also play a role, albeit a more limited one. Contrary to common wisdom, computers cannot account for the evolution of the financial industry. The financial industry of the 1920s appears remarkably similar to the financial industry of the 1990s despite the lack of computers in the early part of the sample.

Not a great day for prefs.

HIMIPref™ Preferred Indices
These values reflect the December 2008 revision of the HIMIPref™ Indices

Values are provisional and are finalized monthly
Index Mean
Current
Yield
(at bid)
Median
YTW
Median
Average
Trading
Value
Median
Mod Dur
(YTW)
Issues Day’s Perf. Index Value
Ratchet 5.36 % 3.86 % 25,795 17.62 2 0.9269 % 859.5
FixedFloater 7.30 % 7.04 % 64,798 13.86 7 -0.3582 % 1,375.5
Floater 5.40 % 4.48 % 31,194 16.45 4 0.1546 % 972.2
OpRet 5.30 % 4.69 % 161,658 4.02 15 0.1505 % 2,026.0
SplitShare 6.22 % 9.39 % 73,235 4.09 15 0.3496 % 1,791.3
Interest-Bearing 7.07 % 8.31 % 35,860 0.87 2 0.1155 % 2,001.3
Perpetual-Premium 0.00 % 0.00 % 0 0.00 0 -0.2587 % 1,557.8
Perpetual-Discount 6.89 % 6.93 % 217,265 12.63 71 -0.2587 % 1,434.7
FixedReset 6.12 % 5.62 % 724,727 14.13 26 -0.4391 % 1,792.3
Performance Highlights
Issue Index Change Notes
BCE.PR.F FixedFloater -3.16 % YTW SCENARIO
Maturity Type : Limit Maturity
Maturity Date : 2039-02-03
Maturity Price : 25.00
Evaluated at bid price : 15.01
Bid-YTW : 7.13 %
CIU.PR.A Perpetual-Discount -2.42 % YTW SCENARIO
Maturity Type : Limit Maturity
Maturity Date : 2039-02-03
Maturity Price : 16.50
Evaluated at bid price : 16.50
Bid-YTW : 7.13 %
RY.PR.G Perpetual-Discount -2.42 % YTW SCENARIO
Maturity Type : Limit Maturity
Maturity Date : 2039-02-03
Maturity Price : 17.32
Evaluated at bid price : 17.32
Bid-YTW : 6.53 %
GWO.PR.H Perpetual-Discount -2.26 % YTW SCENARIO
Maturity Type : Limit Maturity
Maturity Date : 2039-02-03
Maturity Price : 16.86
Evaluated at bid price : 16.86
Bid-YTW : 7.31 %
BNS.PR.R FixedReset -2.23 % YTW SCENARIO
Maturity Type : Limit Maturity
Maturity Date : 2039-02-03
Maturity Price : 21.51
Evaluated at bid price : 21.51
Bid-YTW : 4.97 %
ALB.PR.A SplitShare -2.01 % Asset coverage of 1.1+:1 as of January 29 according to Scotia.
YTW SCENARIO
Maturity Type : Hard Maturity
Maturity Date : 2011-02-28
Maturity Price : 25.00
Evaluated at bid price : 19.50
Bid-YTW : 18.00 %
PWF.PR.H Perpetual-Discount -1.92 % YTW SCENARIO
Maturity Type : Limit Maturity
Maturity Date : 2039-02-03
Maturity Price : 20.40
Evaluated at bid price : 20.40
Bid-YTW : 7.12 %
SLF.PR.C Perpetual-Discount -1.88 % YTW SCENARIO
Maturity Type : Limit Maturity
Maturity Date : 2039-02-03
Maturity Price : 15.16
Evaluated at bid price : 15.16
Bid-YTW : 7.47 %
PWF.PR.I Perpetual-Discount -1.76 % YTW SCENARIO
Maturity Type : Limit Maturity
Maturity Date : 2039-02-03
Maturity Price : 21.76
Evaluated at bid price : 21.76
Bid-YTW : 6.96 %
NA.PR.K Perpetual-Discount -1.64 % YTW SCENARIO
Maturity Type : Limit Maturity
Maturity Date : 2039-02-03
Maturity Price : 20.40
Evaluated at bid price : 20.40
Bid-YTW : 7.22 %
RY.PR.B Perpetual-Discount -1.50 % YTW SCENARIO
Maturity Type : Limit Maturity
Maturity Date : 2039-02-03
Maturity Price : 17.74
Evaluated at bid price : 17.74
Bid-YTW : 6.65 %
BAM.PR.K Floater -1.44 % YTW SCENARIO
Maturity Type : Limit Maturity
Maturity Date : 2039-02-03
Maturity Price : 7.54
Evaluated at bid price : 7.54
Bid-YTW : 7.07 %
SLF.PR.E Perpetual-Discount -1.40 % YTW SCENARIO
Maturity Type : Limit Maturity
Maturity Date : 2039-02-03
Maturity Price : 15.48
Evaluated at bid price : 15.48
Bid-YTW : 7.39 %
BNS.PR.K Perpetual-Discount -1.40 % YTW SCENARIO
Maturity Type : Limit Maturity
Maturity Date : 2039-02-03
Maturity Price : 18.35
Evaluated at bid price : 18.35
Bid-YTW : 6.60 %
CM.PR.K FixedReset -1.35 % YTW SCENARIO
Maturity Type : Limit Maturity
Maturity Date : 2039-02-03
Maturity Price : 21.62
Evaluated at bid price : 22.00
Bid-YTW : 5.25 %
TD.PR.Q Perpetual-Discount -1.34 % YTW SCENARIO
Maturity Type : Limit Maturity
Maturity Date : 2039-02-03
Maturity Price : 20.62
Evaluated at bid price : 20.62
Bid-YTW : 6.85 %
TD.PR.R Perpetual-Discount -1.34 % YTW SCENARIO
Maturity Type : Limit Maturity
Maturity Date : 2039-02-03
Maturity Price : 20.62
Evaluated at bid price : 20.62
Bid-YTW : 6.85 %
MFC.PR.C Perpetual-Discount -1.34 % YTW SCENARIO
Maturity Type : Limit Maturity
Maturity Date : 2039-02-03
Maturity Price : 16.94
Evaluated at bid price : 16.94
Bid-YTW : 6.76 %
IAG.PR.C FixedReset -1.30 % YTW SCENARIO
Maturity Type : Limit Maturity
Maturity Date : 2039-02-03
Maturity Price : 22.02
Evaluated at bid price : 22.06
Bid-YTW : 6.60 %
FTN.PR.A SplitShare -1.16 % Asset coverage of 1.3+:1 as of January 15 according to the company.
YTW SCENARIO
Maturity Type : Hard Maturity
Maturity Date : 2015-12-01
Maturity Price : 10.00
Evaluated at bid price : 7.68
Bid-YTW : 10.14 %
POW.PR.A Perpetual-Discount -1.12 % YTW SCENARIO
Maturity Type : Limit Maturity
Maturity Date : 2039-02-03
Maturity Price : 21.10
Evaluated at bid price : 21.10
Bid-YTW : 6.72 %
NA.PR.L Perpetual-Discount -1.12 % YTW SCENARIO
Maturity Type : Limit Maturity
Maturity Date : 2039-02-03
Maturity Price : 17.66
Evaluated at bid price : 17.66
Bid-YTW : 6.91 %
TD.PR.Y FixedReset -1.09 % YTW SCENARIO
Maturity Type : Limit Maturity
Maturity Date : 2039-02-03
Maturity Price : 21.73
Evaluated at bid price : 21.77
Bid-YTW : 4.73 %
BMO.PR.M FixedReset -1.08 % YTW SCENARIO
Maturity Type : Limit Maturity
Maturity Date : 2039-02-03
Maturity Price : 21.86
Evaluated at bid price : 21.91
Bid-YTW : 4.70 %
PWF.PR.A Floater -1.01 % YTW SCENARIO
Maturity Type : Limit Maturity
Maturity Date : 2039-02-03
Maturity Price : 11.73
Evaluated at bid price : 11.73
Bid-YTW : 4.48 %
BAM.PR.H OpRet 1.04 % YTW SCENARIO
Maturity Type : Soft Maturity
Maturity Date : 2012-03-30
Maturity Price : 25.00
Evaluated at bid price : 22.33
Bid-YTW : 10.06 %
BNA.PR.A SplitShare 1.22 % Asset coverage of 1.8+:1 as of December 31 according to the company.
YTW SCENARIO
Maturity Type : Hard Maturity
Maturity Date : 2010-09-30
Maturity Price : 25.00
Evaluated at bid price : 24.10
Bid-YTW : 9.39 %
BCE.PR.Y Ratchet 1.36 % YTW SCENARIO
Maturity Type : Limit Maturity
Maturity Date : 2039-02-03
Maturity Price : 25.00
Evaluated at bid price : 14.20
Bid-YTW : 7.49 %
HSB.PR.D Perpetual-Discount 1.50 % YTW SCENARIO
Maturity Type : Limit Maturity
Maturity Date : 2039-02-03
Maturity Price : 17.56
Evaluated at bid price : 17.56
Bid-YTW : 7.24 %
ACO.PR.A OpRet 1.56 % YTW SCENARIO
Maturity Type : Call
Maturity Date : 2009-12-31
Maturity Price : 25.50
Evaluated at bid price : 26.00
Bid-YTW : 4.57 %
LFE.PR.A SplitShare 1.74 % Asset coverage of 1.5-:1 as of January 15 according to the company.
YTW SCENARIO
Maturity Type : Hard Maturity
Maturity Date : 2012-12-01
Maturity Price : 10.00
Evaluated at bid price : 9.34
Bid-YTW : 7.31 %
ELF.PR.G Perpetual-Discount 1.75 % YTW SCENARIO
Maturity Type : Limit Maturity
Maturity Date : 2039-02-03
Maturity Price : 14.50
Evaluated at bid price : 14.50
Bid-YTW : 8.31 %
WFS.PR.A SplitShare 1.88 % Asset coverage of 1.1+:1 as of January 22 according to Mulvihill.
YTW SCENARIO
Maturity Type : Hard Maturity
Maturity Date : 2011-06-30
Maturity Price : 10.00
Evaluated at bid price : 8.66
Bid-YTW : 12.18 %
PWF.PR.E Perpetual-Discount 2.10 % YTW SCENARIO
Maturity Type : Limit Maturity
Maturity Date : 2039-02-03
Maturity Price : 19.91
Evaluated at bid price : 19.91
Bid-YTW : 6.97 %
GWO.PR.G Perpetual-Discount 2.31 % YTW SCENARIO
Maturity Type : Limit Maturity
Maturity Date : 2039-02-03
Maturity Price : 18.15
Evaluated at bid price : 18.15
Bid-YTW : 7.28 %
BAM.PR.B Floater 2.51 % YTW SCENARIO
Maturity Type : Limit Maturity
Maturity Date : 2039-02-03
Maturity Price : 7.75
Evaluated at bid price : 7.75
Bid-YTW : 6.88 %
BNA.PR.C SplitShare 3.20 % Asset coverage of 1.8+:1 as of December 31 according to the company.
YTW SCENARIO
Maturity Type : Hard Maturity
Maturity Date : 2019-01-10
Maturity Price : 25.00
Evaluated at bid price : 11.60
Bid-YTW : 15.20 %
Volume Highlights
Issue Index Shares
Traded
Notes
BNS.PR.X FixedReset 125,407 Recent new issue.
YTW SCENARIO
Maturity Type : Call
Maturity Date : 2014-05-25
Maturity Price : 25.00
Evaluated at bid price : 24.90
Bid-YTW : 6.42 %
RY.PR.R FixedReset 95,476 Recent new issue.
YTW SCENARIO
Maturity Type : Call
Maturity Date : 2014-03-26
Maturity Price : 25.00
Evaluated at bid price : 24.95
Bid-YTW : 6.37 %
TD.PR.G FixedReset 77,994 Recent new issue.
YTW SCENARIO
Maturity Type : Call
Maturity Date : 2014-05-30
Maturity Price : 25.00
Evaluated at bid price : 24.85
Bid-YTW : 6.46 %
TD.PR.E FixedReset 73,337 Recent new issue.
YTW SCENARIO
Maturity Type : Call
Maturity Date : 2014-05-30
Maturity Price : 25.00
Evaluated at bid price : 25.05
Bid-YTW : 6.34 %
SLF.PR.E Perpetual-Discount 59,400 RBC crossed 47,500 at 15.45.
YTW SCENARIO
Maturity Type : Limit Maturity
Maturity Date : 2039-02-03
Maturity Price : 15.48
Evaluated at bid price : 15.48
Bid-YTW : 7.39 %
SLF.PR.B Perpetual-Discount 45,051 Nesbitt crossed 37,100 at 16.88.
YTW SCENARIO
Maturity Type : Limit Maturity
Maturity Date : 2039-02-03
Maturity Price : 16.78
Evaluated at bid price : 16.78
Bid-YTW : 7.27 %
There were 37 other index-included issues trading in excess of 10,000 shares.