Archive for May, 2009

MAPF Performance: April 2009

Tuesday, May 5th, 2009

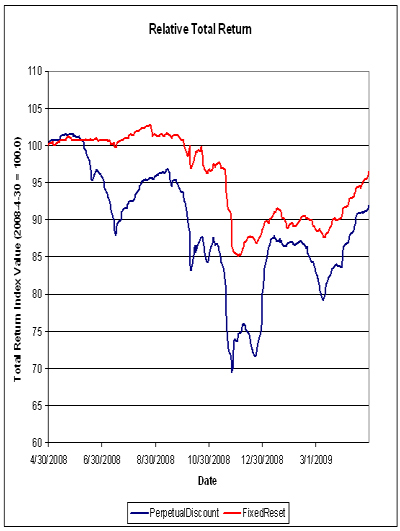
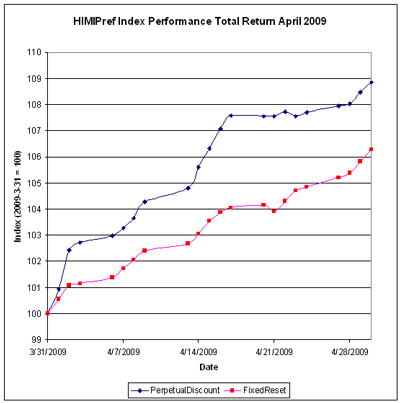
The fund performed well in a month that was as remarkable for its consistency as it was for the strong performance of the preferred share market. As noted in the report of Index Performance, April 2009, the PerpetualDiscount index experienced only three down-days in the month, compared to eighteen gainers:

The fund’s Net Asset Value per Unit as of the close April 30 was $9.8406.

Returns to April 30, 2009
Period MAPF Index CPD
according to
Claymore
One Month +11.42% +6.37% +6.97%
Three Months +13.12% +5.08% +6.36%
One Year +19.08% -8.46% -8.33%
Two Years (annualized) +9.35% -7.05%  
Three Years (annualized) +8.44% -3.44%  
Four Years (annualized) +7.93% -1.77%  
Five Years (annualized) +8.29% -0.31%  
Six Years (annualized) +10.96% +0.76%  
Seven Years (annualized) +9.61% +1.49%  
Eight Years (annualized) +10.41% +1.42%  
The Index is the BMO-CM “50”
CPD Returns are for the NAV and are after all fees and expenses.
Figures for Omega Preferred Equity (which are after all fees and expenses) for 1-, 3- and 12-months are +6.3%, +5.1% and -8.6%, respectively, according to Morningstar after all fees & expenses
Figures for Jov Leon Frazer Preferred Equity Fund (which are after all fees and expenses) for 1-, 3- and 12-months are N/A, N/A & N/A, respectively, according to Morningstar
Figures for AIC Preferred Income Fund (which are after all fees and expenses) for 1-, 3- and 12-months are N/A, N/A & N/A, respectively

Returns assume reinvestment of dividends, and are shown after expenses but before fees. Past performance is not a guarantee of future performance. You can lose money investing in Malachite Aggressive Preferred Fund or any other fund. For more information, see the fund’s main page.

The yields available on high quality preferred shares remain elevated, which is reflected in the current estimate of sustainable income.

Calculation of MAPF Sustainable Income Per Unit
Month NAVPU Portfolio
Average
YTW
Leverage
Divisor
Securities
Average
YTW
Sustainable
Income
June, 2007 9.3114 5.16% 1.03 5.01% 0.4665
September 9.1489 5.35% 0.98 5.46% 0.4995
December, 2007 9.0070 5.53% 0.942 5.87% 0.5288
March, 2008 8.8512 6.17% 1.047 5.89% 0.5216
June 8.3419 6.034% 0.952 6.338% $0.5287
September 8.1886 7.108% 0.969 7.335% $0.6006
December, 2008 8.0464 9.24% 1.008 9.166% $0.7375
March 2009 $8.8317 8.60% 0.995 8.802% $0.7633
April 2009 9.8406 7.82% 0.994 7.867% $0.7742
NAVPU is shown after quarterly distributions.
“Portfolio YTW” includes cash (or margin borrowing), with an assumed interest rate of 0.00%
“Securities YTW” divides “Portfolio YTW” by the “Leverage Divisor” to show the average YTW on the securities held; this assumes that the cash is invested in (or raised from) all securities held, in proportion to their holdings.
“Sustainable Income” is the resultant estimate of the fund’s dividend income per unit, before fees and expenses.

As discussed in the post MAPF Portfolio Composition: April 2009, the fund has positions in splitShares (almost all BNA.PR.C) and an operating retractible (YPG.PR.B), both of which skew the calculation. Since the yield on thes positions is higher than that of the perpetuals despite the fact that the term is limited, the sustainability of the calculated “sustainable yield” is suspect, as discussed in August, 2008.

Significant positions were also held in Fixed-Reset issues on April 30 (HSB.PR.E, BMO.PR.O & CM.PR.M); all of which currently have their yields calculated with the presumption that they will be called by the issuers at par at the first possible opportunity.

However, if the entire portfolio except for the PerpetualDiscounts were to be sold and reinvested in these issues, the yield of the portfolio would be the 7.13% shown in the April 30 Portfolio Composition analysis (which is in excess of the 6.80% index yield on April 30). Given such reinvestment, the sustainable yield would be 9.8406 * 0.0713 = $0.7016, an increase from the $0.6712 derived by a similar calculation last month; which I consider rather good considering the increased allocation in April to the lower-yielding Fixed-Reset issues.

Different assumptions lead to different calculations, but the overall positive trend is apparent. I’m very pleased with the results! It will be noted that if there was no trading in the portfolio, one would expect the sustainable yield to be constant (before fees and expenses). The success of the fund’s trading is showing up in

  • the very good performance against the index
  • the long term increases in sustainable income per unit

As has been noted, the fund has maintained a credit quality equal to or better than the index; outperformance is due to constant exploitation of trading anomalies.

Again, there are no predictions for the future! The fund will continue to trade between issues in an attempt to exploit market gaps in liquidity, in an effort to outperform the index and keep the sustainable income per unit – however calculated! – growing.

Seminar, May 28: FixedReset Issues

Monday, May 4th, 2009

Update, 2009-8-25: To gain access to the on-line video of this seminar and the ancillary written material, please visit PrefLetter.com

I am pleased to announce the next seminar in the series on the theory and practice of preferred share investing.

These seminars will be aimed at active and potential preferred share investors who wish to review relative valuation techniques in preferred share analysis.

All seminars will be presented by James Hymas, who has written extensively on the subject of preferred share investment and has been referred to as a "top expert" on the subject.

Questions are encouraged throughout the seminars, as well as in informal discussion at the end of the session.

Each seminar is two hours in length; coffee and tea will be served. The cost of attendance is $100, but a discount of $50 will be given to participants who have an annual subscription to PrefLetter with at least one issue remaining at the time of the seminar.

All seminars will be video-recorded for future distribution. Please note the slight change of venue: same hotel, different conference room.

Advance registration and payment may be performed on-line.

Thursday, May 28

Preferred Share – Fixed-Reset Issues:
Theory & Practice

"FixedReset Issues" are popular with investors who:

  • wish to obtain tax-advantaged income
  • want protection against future inflation

These issues are characterized by:

  • Mostly issued by financial institutions
  • Exchange Dates occur every five years
  • Dividends are fixed until the first Exchange Date
  • On every Exchange Date:
    • Company may redeem the issue at par
    • Rate until next exchange date is reset to 5-Year Canada bonds plus a spread
    • Issue may be exchanged to Floating Rate issues, paying 3-month Treasury Bills plus a spread, reset quarterly
  • Issues are perpetual

This seminar will review the theory of FixedReset Preferred evaluation, including:

  • Credit Quality
  • Embedded calls
  • Exchange Options
  • The importance of ex-Dividend dates
  • Investment characteristics relative to Straight Perpetuals

Examples of relative valuation in current markets will be supplied and discussed.

Attendence is limited; a reservation will avoid disappointment.

Location: Days Hotel & Conference Center, (at Carlton & College, downtown Toronto) College Room (see map).

Time: May 28, 2009, 6pm-8pm.

Reservations: Please visit the PrefLetter Seminar Page.

Update, 2009-8-24: The seminar and its ancillary material have been accredited for four hours of IDA Professional Development Continuing Education.

Update, 2009-8-24: ◦This program is eligible for four CE credit hours, as granted by CFA Institute. If you are a CFA Institute member, CE credit for your participation in this program will be automatically recorded in your CE Diary.


MAPF Portfolio Composition: April 2009

Monday, May 4th, 2009

Trading remained steady in April, with portfolio turnover of about 80%, as the market strongly advanced in a very consistent fashion: PerpetualDiscounts had only three down-days, against 18 gainers.

Trades were, as ever, triggered by a desire to exploit transient mispricing in the preferred share market (which may the thought of as “selling liquidity”), rather than any particular view being taken on market direction, sectoral performance or credit anticipation.

MAPF Sectoral Analysis 2009-4-30
HIMI Indices Sector Weighting YTW ModDur
Ratchet 0% N/A N/A
FixFloat 0% N/A N/A
Floater 0% N/A N/A
OpRet 0% N/A N/A
SplitShare 11.1% (+1.4) 12.74% 6.75
Interest Rearing 0% N/A N/A
PerpetualPremium 0.0% N/A N/A
PerpetualDiscount 63.3% (-10.5) 7.13% 12.39
Fixed-Reset 19.2% (+9.2) 5.45% 4.42
Scraps (FixFloat) 0% (-1.6) N/A N/A
Scraps (OpRet) 5.7% (+2.0) 14.69% 5.87
Scraps (SplitShare) 0.0% (-0.5) N/A N/A
Cash +0.6% (+0.1) 0.00% 0.00
Total 100% 7.82% 9.78
Totals and changes will not add precisely due to rounding. Bracketted figures represent change from March month-end. Cash is included in totals with duration and yield both equal to zero.

The “total” reflects the un-leveraged total portfolio (i.e., cash is included in the portfolio calculations and is deemed to have a duration and yield of 0.00.). MAPF will often have relatively large cash balances, both credit and debit, to facilitate trading. Figures presented in the table have been rounded to the indicated precision.

The important change was the shift of just under 10% of portfolio weight from PerpetualDiscounts into FixedResets. At month-end, the fund had positions in HSB.PR.E, CM.PR.M and BMO.PR.O. The position in HSB.PR.E was accumulated approximately as follows:

April 2009 Accumulation of HSB.PR.E
Date HSB.PR.E CM.PR.H SLF.PR.A CU.PR.B TD.PR.K
4/8 Bot
25.17
Sold
17.00
     
4/9 Bot
25.23
  Sold
16.51
Sold
22.90
 
4/14 Bot
25.24
      Sold
25.45
4/30
Closing
Bid
26.20 17.63 16.90 24.08 26.20
Trade reconstruction is approximate and represents a best-efforts attempt to show the flow of funds. Full trade details will be released with the MAPF Semi-Annual report

As may be seen, this accumulation has turned out very well so far – only the trade out of CU.PR.B has worked against the fund, which is a good ratio.

Credit distribution is:

MAPF Credit Analysis 2009-4-30
DBRS Rating Weighting
Pfd-1 54.0% (+4.1)
Pfd-1(low) 19.1% (+2.6)
Pfd-2(high) 0.9% (-8.0)
Pfd-2 0% (0)
Pfd-2(low) 19.6% (+0.9)
Pfd-3(high) 5.7% (+0.4)
Cash +0.6% (+0.1)
Totals will not add precisely due to rounding. Bracketted figures represent change from March month-end.

The reduction in weighting of Pfd-2(high) reflects the sale of CU.PR.B, related to the shift in sectors shown above.

The fund does not set any targets for overall credit quality; trades are executed one by one. Variances in overall credit will be constant as opportunistic trades are executed. The overall credit quality of the portfolio is now superior to the credit quality of CPD at August month-end (when adjusted for the downgrade of BCE).

Claymore provides the following ratings breakdown:

Ratings Breakdown
as of 12/31/08
Pfd-1 61.15%
Pfd-2 23.26%
Pfd-3 15.60%

Two events have occurred since the Dec. 31 calculation date of CPD’s credit quality:

Liquidity Distribution is:

MAPF Liquidity Analysis 2009-4-30
Average Daily Trading Weighting
<$50,000 0.4% (-0.1)
$50,000 – $100,000 20.7% (-16.9)
$100,000 – $200,000 53.3% (+38.5)
$200,000 – $300,000 5.7% (-18.1)
>$300,000 19.2% (-3.4)
Cash +0.6% (+0.1)
Totals will not add precisely due to rounding. Bracketted figures represent change from March month-end.

MAPF is, of course, Malachite Aggressive Preferred Fund, a “unit trust” managed by Hymas Investment Management Inc. Further information and links to performance, audited financials and subscription information are available the fund’s web page. A “unit trust” is like a regular mutual fund, but is sold by offering memorandum rather than prospectus. This is cheaper, but means subscription is restricted to “accredited investors” (as defined by the Ontario Securities Commission) and those who subscribe for $150,000+. Fund past performances are not a guarantee of future performance. You can lose money investing in MAPF or any other fund.

A similar portfolio composition analysis has been performed on The Claymore Preferred Share ETF (symbol CPD) as of August 29. When comparing CPD and MAPF:

  • MAPF credit quality is better
  • MAPF liquidity is similar
  • MAPF Yield is higher
  • Weightings in
    • MAPF weighting in PerpetualDiscounts is similar
    • MAPF is much less exposed to Operating Retractibles
    • MAPF is more exposed to SplitShares
    • MAPF is less exposed to FixFloat / Floater / Ratchet
    • MAPF is more exposed to Fixed-Resets

May 4, 2009

Monday, May 4th, 2009

Some public sector funds in the US have banned placement agents:

The move by some U.S. public pension funds to ban middlemen who market the services of private equity and hedge fund investments is misguided, according to Michael Travaglini, Massachusetts system executive director.

The funds would be better served installing more checks and balances to prevent undue political influence, Travaglini said. New York, for instance, should broaden control of its pension so the state comptroller is no longer sole trustee, Travaglini said in a telephone interview.

New York State Comptroller Thomas DiNapoli, who runs the $121.9 billion fund, banned the use of placement agents, lobbyists or other paid intermediaries last month amid a widening pay-to-play investigation. New York City similarly told money managers they could no longer use middlemen get pension fund business.

“There’s a legitimate place for placement agents,” said Travaglini, who’s helped run the $34.2 billion retirement fund for public employees in Massachusetts since 2004. “I’m amazed that a political corruption case has led people to question the legitimacy of a long established part of the asset management business.”

The ban is craziness, but there will be many more babies thrown out with the bathwater as political posturing takes centre stage.

DBRS is forecasting a preponderance of downgrades in 2009:

In a commentary released today, DBRS notes that it has seen a significant increase in credit deterioration in Q1 2009. According to the report, corporate credits finished the quarter on a negative tone, with approximately 16% of the DBRS universe facing negative rating action over the next 12 months. In contrast, only 2% of credits reviewed by DBRS were facing positive rating action.

The preferred share market continued its rally today, with PerpetualDiscounts roaring ahead as – perhaps – the market has realized why embedded calls at par in five years are valuable for issuers of FixedResets.

HIMIPref™ Preferred Indices
These values reflect the December 2008 revision of the HIMIPref™ Indices

Values are provisional and are finalized monthly
Index Mean
Current
Yield
(at bid)
Median
YTW
Median
Average
Trading
Value
Median
Mod Dur
(YTW)
Issues Day’s Perf. Index Value
Ratchet 0.00 % 0.00 % 0 0.00 0 1.2414 % 989.1
FixedFloater 0.00 % 0.00 % 0 0.00 0 1.2414 % 1,599.6
Floater 3.81 % 4.36 % 70,147 16.67 3 1.2414 % 1,235.7
OpRet 5.09 % 4.31 % 138,646 3.18 15 -0.0480 % 2,138.6
SplitShare 6.03 % 7.20 % 46,756 4.28 3 0.7325 % 1,783.1
Interest-Bearing 6.01 % 6.69 % 28,146 0.64 1 0.8073 % 1,985.2
Perpetual-Premium 0.00 % 0.00 % 0 0.00 0 0.6174 % 1,669.0
Perpetual-Discount 6.55 % 6.67 % 149,504 12.99 71 0.6174 % 1,537.1
FixedReset 5.79 % 4.88 % 569,488 4.53 36 0.1126 % 1,955.0
Performance Highlights
Issue Index Change Notes
BAM.PR.O OpRet -2.56 % YTW SCENARIO
Maturity Type : Option Certainty
Maturity Date : 2013-06-30
Maturity Price : 25.00
Evaluated at bid price : 22.81
Bid-YTW : 7.68 %
CM.PR.M FixedReset -1.41 % YTW SCENARIO
Maturity Type : Call
Maturity Date : 2014-08-30
Maturity Price : 25.00
Evaluated at bid price : 26.52
Bid-YTW : 5.42 %
TRI.PR.B Floater -1.39 % YTW SCENARIO
Maturity Type : Limit Maturity
Maturity Date : 2039-05-04
Maturity Price : 12.81
Evaluated at bid price : 12.81
Bid-YTW : 3.09 %
NA.PR.O FixedReset -1.05 % YTW SCENARIO
Maturity Type : Call
Maturity Date : 2014-03-17
Maturity Price : 25.00
Evaluated at bid price : 26.42
Bid-YTW : 5.24 %
SLF.PR.D Perpetual-Discount 1.00 % YTW SCENARIO
Maturity Type : Limit Maturity
Maturity Date : 2039-05-04
Maturity Price : 16.14
Evaluated at bid price : 16.14
Bid-YTW : 7.00 %
BNS.PR.P FixedReset 1.04 % YTW SCENARIO
Maturity Type : Limit Maturity
Maturity Date : 2039-05-04
Maturity Price : 24.11
Evaluated at bid price : 24.20
Bid-YTW : 4.24 %
CM.PR.J Perpetual-Discount 1.07 % YTW SCENARIO
Maturity Type : Limit Maturity
Maturity Date : 2039-05-04
Maturity Price : 17.03
Evaluated at bid price : 17.03
Bid-YTW : 6.67 %
PWF.PR.K Perpetual-Discount 1.10 % YTW SCENARIO
Maturity Type : Limit Maturity
Maturity Date : 2039-05-04
Maturity Price : 18.36
Evaluated at bid price : 18.36
Bid-YTW : 6.80 %
NA.PR.P FixedReset 1.12 % YTW SCENARIO
Maturity Type : Call
Maturity Date : 2014-03-17
Maturity Price : 25.00
Evaluated at bid price : 27.00
Bid-YTW : 4.73 %
GWO.PR.J FixedReset 1.14 % YTW SCENARIO
Maturity Type : Limit Maturity
Maturity Date : 2039-05-04
Maturity Price : 25.65
Evaluated at bid price : 25.70
Bid-YTW : 5.08 %
TD.PR.A FixedReset 1.22 % YTW SCENARIO
Maturity Type : Limit Maturity
Maturity Date : 2039-05-04
Maturity Price : 23.96
Evaluated at bid price : 24.00
Bid-YTW : 4.27 %
BAM.PR.J OpRet 1.25 % YTW SCENARIO
Maturity Type : Soft Maturity
Maturity Date : 2018-03-30
Maturity Price : 25.00
Evaluated at bid price : 21.07
Bid-YTW : 8.04 %
SLF.PR.E Perpetual-Discount 1.28 % YTW SCENARIO
Maturity Type : Limit Maturity
Maturity Date : 2039-05-04
Maturity Price : 16.66
Evaluated at bid price : 16.66
Bid-YTW : 6.86 %
PWF.PR.E Perpetual-Discount 1.28 % YTW SCENARIO
Maturity Type : Limit Maturity
Maturity Date : 2039-05-04
Maturity Price : 20.56
Evaluated at bid price : 20.56
Bid-YTW : 6.75 %
BAM.PR.M Perpetual-Discount 1.38 % YTW SCENARIO
Maturity Type : Limit Maturity
Maturity Date : 2039-05-04
Maturity Price : 14.70
Evaluated at bid price : 14.70
Bid-YTW : 8.23 %
BMO.PR.H Perpetual-Discount 1.50 % YTW SCENARIO
Maturity Type : Limit Maturity
Maturity Date : 2039-05-04
Maturity Price : 21.03
Evaluated at bid price : 21.03
Bid-YTW : 6.32 %
SLF.PR.A Perpetual-Discount 1.59 % YTW SCENARIO
Maturity Type : Limit Maturity
Maturity Date : 2039-05-04
Maturity Price : 17.25
Evaluated at bid price : 17.25
Bid-YTW : 6.99 %
CM.PR.K FixedReset 1.64 % YTW SCENARIO
Maturity Type : Limit Maturity
Maturity Date : 2039-05-04
Maturity Price : 24.11
Evaluated at bid price : 24.15
Bid-YTW : 4.55 %
PWF.PR.G Perpetual-Discount 1.67 % YTW SCENARIO
Maturity Type : Limit Maturity
Maturity Date : 2039-05-04
Maturity Price : 21.90
Evaluated at bid price : 21.90
Bid-YTW : 6.80 %
BNS.PR.M Perpetual-Discount 1.67 % YTW SCENARIO
Maturity Type : Limit Maturity
Maturity Date : 2039-05-04
Maturity Price : 18.24
Evaluated at bid price : 18.24
Bid-YTW : 6.22 %
TD.PR.O Perpetual-Discount 1.86 % YTW SCENARIO
Maturity Type : Limit Maturity
Maturity Date : 2039-05-04
Maturity Price : 19.71
Evaluated at bid price : 19.71
Bid-YTW : 6.20 %
HSB.PR.C Perpetual-Discount 1.89 % YTW SCENARIO
Maturity Type : Limit Maturity
Maturity Date : 2039-05-04
Maturity Price : 18.83
Evaluated at bid price : 18.83
Bid-YTW : 6.88 %
BNS.PR.L Perpetual-Discount 1.90 % YTW SCENARIO
Maturity Type : Limit Maturity
Maturity Date : 2039-05-04
Maturity Price : 18.28
Evaluated at bid price : 18.28
Bid-YTW : 6.21 %
CM.PR.P Perpetual-Discount 1.94 % YTW SCENARIO
Maturity Type : Limit Maturity
Maturity Date : 2039-05-04
Maturity Price : 20.50
Evaluated at bid price : 20.50
Bid-YTW : 6.77 %
CM.PR.H Perpetual-Discount 2.02 % YTW SCENARIO
Maturity Type : Limit Maturity
Maturity Date : 2039-05-04
Maturity Price : 18.16
Evaluated at bid price : 18.16
Bid-YTW : 6.67 %
CIU.PR.A Perpetual-Discount 2.04 % YTW SCENARIO
Maturity Type : Limit Maturity
Maturity Date : 2039-05-04
Maturity Price : 18.52
Evaluated at bid price : 18.52
Bid-YTW : 6.34 %
BNA.PR.C SplitShare 2.13 % Asset coverage of 1.7+:1 as of March 31 according to the company.
YTW SCENARIO
Maturity Type : Hard Maturity
Maturity Date : 2019-01-10
Maturity Price : 25.00
Evaluated at bid price : 13.91
Bid-YTW : 12.60 %
BAM.PR.K Floater 2.94 % YTW SCENARIO
Maturity Type : Limit Maturity
Maturity Date : 2039-05-04
Maturity Price : 9.11
Evaluated at bid price : 9.11
Bid-YTW : 4.36 %
BAM.PR.B Floater 3.42 % YTW SCENARIO
Maturity Type : Limit Maturity
Maturity Date : 2039-05-04
Maturity Price : 9.07
Evaluated at bid price : 9.07
Bid-YTW : 4.38 %
Volume Highlights
Issue Index Shares
Traded
Notes
RY.PR.Y FixedReset 77,055 Recent new issue.
YTW SCENARIO
Maturity Type : Call
Maturity Date : 2014-12-24
Maturity Price : 25.00
Evaluated at bid price : 25.96
Bid-YTW : 5.35 %
BNS.PR.R FixedReset 42,858 YTW SCENARIO
Maturity Type : Limit Maturity
Maturity Date : 2039-05-04
Maturity Price : 23.87
Evaluated at bid price : 23.91
Bid-YTW : 4.20 %
RY.PR.L FixedReset 41,965 YTW SCENARIO
Maturity Type : Limit Maturity
Maturity Date : 2039-05-04
Maturity Price : 25.15
Evaluated at bid price : 25.20
Bid-YTW : 4.74 %
RY.PR.X FixedReset 38,349 YTW SCENARIO
Maturity Type : Call
Maturity Date : 2014-09-23
Maturity Price : 25.00
Evaluated at bid price : 26.53
Bid-YTW : 5.10 %
RY.PR.W Perpetual-Discount 36,880 YTW SCENARIO
Maturity Type : Limit Maturity
Maturity Date : 2039-05-04
Maturity Price : 19.64
Evaluated at bid price : 19.64
Bid-YTW : 6.26 %
RY.PR.B Perpetual-Discount 32,261 YTW SCENARIO
Maturity Type : Limit Maturity
Maturity Date : 2039-05-04
Maturity Price : 19.01
Evaluated at bid price : 19.01
Bid-YTW : 6.21 %
There were 35 other index-included issues trading in excess of 10,000 shares.

Index Performance: April 2009

Monday, May 4th, 2009

Performance of the HIMIPref™ Indices for April, 2009, was:

Total Return
Index Performance
April 2009
Three Months
to
April 30, 2009
Ratchet +11.53% * +13.98% *
FixFloat +11.53% ** +13.36% **
Floater +11.53% +28.50%
OpRet +3.12% +5.65%
SplitShare +7.40% -1.35%
Interest +2.68% -1.27%
PerpetualPremium +8.84%*** +5.65%***
PerpetualDiscount +8.84% +5.65%%
FixedReset +6.27% +7.87%
* The last member of the RatchetRate index was transferred to Scraps at the February, 2009, rebalancing; subsequent performance figures are set equal to the Floater index
** The last member of the FixedFloater index was transferred to Scraps at the February, 2009, rebalancing; subsequent performance figures are set equal to the PerpetualDiscount index
*** The last member of the PerpetualPremium index was transferred to PerpetualDiscount at the October, 2008, rebalancing; subsequent performance figures are set equal to the PerpetualDiscount index
Funds (see below for calculations)
CPD +6.93% +6.34%
DPS.UN +7.72% +5.55%
Index
BMO-CM 50 +6.37% +5.08%

The recent rally has been most welcome, but we’re still a long way from where we were:

Claymore has published NAV and distribution data for its exchange traded fund (CPD) and I have derived the following table:

CPD Return, 1- & 3-month, to April 30, 2009
Date NAV Distribution Return for Sub-Period Monthly Return
January 30, 2009 14.57 0.00    
February 27, 2009 14.40 0.00   -1.17%
March 26 14.19 0.2100 0.00% +0.63%
March 31, 2009 14.28   +0.63%
April 30, 2009 15.27 0.00   +6.93%
Quarterly Return +6.34%

The DPS.UN NAV for April 29 has been published so we may calculate the March returns (approximately!) for this closed end fund.

DPS.UN NAV Return, April-ish 2009
Date NAV Distribution Return for period
April 1, 2009 16.02 0.00 &nbsp
April 29, 2009 17.07 0.00 +6.55%
Estimated April Beginning Stub +0.77%
Estimated April Ending Stub +0.33%
Estimated April Return +7.72%
** CPD had a NAV of $14.39 on April 1 and a NAV of $14.28 on March 31. The return for the day was therefore 0.77%. This figure is added to the DPS.UN period return to arrive at an estimate for the calendar month.
** CPD had a NAV of $15.22 on April 29 and a NAV of $15.27 on April 30. The return for the day was therefore +0.33%. This figure is added to the DPS.UN period return to arrive at an estimate for the calendar month.
The April return for DPS.UN’s NAV is therefore the product of four period returns, +0.77%, +6.55% and +0.33 to arrive at an estimate for the calendar month of +7.72%

Now, to see the DPS.UN quarterly NAV approximate return, we refer to the calculations for February and March:

DPS.UN NAV Returns, three-month-ish to end-April-ish, 2009
February-ish -1.79%
March-ish -0.23%
April-ish +7.72%
Three-months-ish +5.55%

Bank Sub-Debt Redemptions

Saturday, May 2nd, 2009

On an unrelated thread, Assiduous Reader GAndreone asked:

As the official guardian of the pref share patrimony what is your opinion on the recent redemption of sub-debt by both RBC and CIBC. RBC redeemed $1.0G @ 4.18% and CIBC redeem $0.75G @ 4.25%. In the case of RBC just this year alone they issued Net $1.576G of prefs @ 6.22%
These actions are not clear to me but they certainly maybe clear to you!

So, let’s review:

RY has recently redeemed some sub-debt:

Royal Bank of Canada (RY on TSX and NYSE) today announced its intention to redeem all outstanding 4.18 per cent subordinated debentures due June 1, 2014 (the “4.18 per cent debentures”) for 100 per cent of their principal amount plus accrued interest to the redemption date. The redemption will occur on June 1, 2009. There is currently $1,000,000,000 principal amount of 4.18 per cent debentures outstanding.

The redemption of the debentures will be financed out of the general corporate funds of Royal Bank of Canada.

According to their 2008 Annual Report (page 162 of the PDF), these bonds mature June 1, 2014; first par call June 1, 2009; and:

Interest at stated interest rate until earliest par value redemption date, and thereafter at a rate of 1.00% above the 90-day Bankers’ Acceptance rate.

Which leaves us with another puzzle, since Three-months BAs are now at 0.29% (!) and they had the opportunity to cut their interest rate costs by almost 70%; from $41.8-million annually to $12.9-million annually (assuming BAs are constant).

Similarly with CM:

CIBC (CM: TSX; NYSE) today announced its intention to redeem all $750,000,000 of its 4.25% Debentures (subordinated indebtedness) due June 1, 2014 (the “Debentures”). In accordance with their terms, the Debentures will be redeemed at 100% of their principal amount on June 1, 2009. The interest accrued on the Debentures to the redemption date will be paid through CIBC Mellon Trust Company in the usual manner. The redemption will be financed out of the general corporate funds of CIBC.

The 2008 CM Annual Report (page 131 of the PDF) shows the first par call being June 1, 2009, maturity 2014-6-1 … but they make us go to SEDAR to get the May 3, 2004, prospectus supplement, which says:

… until June 1, 2009. Thereafter, interest on the Debentures will be payable at a rate per annum equal to the 3-month Bankers’ Acceptance Rate (as herein defined) plus 1.00%,

Which leaves us with the same conundrum.

This behaviour was also discussed in the post National Bank Honours Sub-Debt Pretend Maturity.

It all stems back to the way the bond market really works. There are not many actual bond analysts in Canada – or the world, for that matter. Bonds are not bought – typically – after rigourous analysis of their terms and comparison with other opportunities. Bonds are bought because Joe at the brokerage has some to sell and says they’re pretty good. In the case of sub-debt, it is understood that the banks will call these issues on their pretend-maturity date, which is just before they go floating, or step-up to the penalty rate, or whatever. When brokerages calculate yields and spreads on these issues, they perform these calculations based on the pretend-maturity date.

This occurs because the value of sub-debt to the issuing bank changes (in Canada, anyway. Most other places, I think, have the same rules, but I haven’t done a survey) five years prior to maturity. On May 31, the issuers can count 100% of this sub-debt towards their Tier 2 capital. On June 1, they can only count 80%, and the rate declines by another 20% every year until formal maturity. Thus, four years and three hundred and sixty four days prior to maturity, the banks are (theoretically) paying full sub-debt prices for their debt, but only getting 80% of sub-debt value. Therefore, the theory goes, they will call, come hell or high water.

Deutsche Bank did the business-like thing and didn’t call their sub-debt on the pretend-maturity. The market ripped their faces off. Why? Because Joe at the brokerage had sold all that paper to his customers while telling them that the pretend-maturity would be honoured, and then it wasn’t. Deutsche made poor old Joe look silly – and worse, uninformed. It is preferable to go bankrupt than to break the comfortable rules of the bond-traders’ boys’ club.

It is clear that the current rules are not working; the rules for sub-debt need to be revised somehow. The most obvious first step is to change the rules so that fixed-floating sub-debt, or paper with a step-up, is simply not allowed (this would also, I hope, affect fixed-resets!). The absence of a clearly defined break in the investment terms might go a little way towards eliminating this type of expectation.

Because this type of expectation is dangerous! It seems pretty clear that BAs+100 is a wonderful rate for banks to borrow five-year money, even with no Tier 2 allowance at all; but they are pseudo-honour bound to conduct business in a non-business-like fashion. I consider any unbusinesslike behaviour to be a destabilizing force on the financial system; and how come the banks are getting 100% sub-debt credit for the paper on May 31, when it is clear that if they don’t cough up the cash PDQ the market will squash them like a bug?

The trouble is, nod-and-wink behaviour is awfully hard to stamp out. If the regulators are truly interested in financial stability, I think they’ll have to come up with other ideas … up to and including elimination of the concept of maturity dates on Tier 2 capital completely (as well as, in Canada, the idiotic redefinition of Tier 1).

Best & Worst Performers: April 2009

Saturday, May 2nd, 2009

These are total returns, with dividends presumed to have been reinvested at the bid price on the ex-date. The list has been restricted to issues in the HIMIPref™ indices.

April 2009
Issue Index DBRS Rating Monthly Performance Notes (“Now” means “April 30”)
ACO.PR.A OpRet Pfd-2(low) -1.87% Now with a pre-tax bid-YTW of 2.58% based on a bid of 26.25 and a call 2009-12-31 at 25.50.
GWO.PR.X OpRet Pfd-1(low) +0.40% Now with a pre-tax bid-YTW of 4.77% based on a bid of 25.15 and a softMaturity 2013-9-29 at 25.00.
MFC.PR.A OpRet Pfd-1(low) +0.73% Now with a pre-tax bid-YTW of 4.29% based on a bid of 24.87 and a softMaturity 2015-12-18 at 25.00.
CM.PR.A OpRet Pfd-1 +0.98% Now with a pre-tax bid-YTW of -9.75% based on a bid of 25.82 and a call 2009-5-30 at 25.00.
TCA.PR.Y PerpetualDiscount Pfd-2(low) +1.06% Now with a pre-tax bid-YTW of 5.99% based on a bid of 46.72 and a limitMaturity.
MFC.PR.C PerpetualDiscount Pfd-1(low) +15.59% The second-worst performer in March. Now with a pre-tax bid-YTW of 6.59% based on a bid of 17.35 and a limitMaturity.
ELF.PR.G PerpetualDiscount Pfd-2(low) +16.23% Now with a pre-tax bid-YTW of 7.81% based on a bid of 15.40 and a limitMaturity.
PWF.PR.L PerpetualDiscount Pfd-1(low) +16.60% Now with a pre-tax bid-YTW of 6.84% based on a bid of 18.80 and a limitMaturity.
IAG.PR.A PerpetualDiscount Pfd-2(high) +18.00% Was the worst performer in March – this issue is notoriously volatile. Now with a pre-tax bid-YTW of 6.90% based on a bid of 16.91 and a limitMaturity.
BNA.PR.C SplitShare Pfd-2(low) +21.60% Now with a pre-tax bid-YTW of 13.01% based on a bid of 13.51 and a hardMaturity 2019-1-10 at 25.00

Pegged Orders

Saturday, May 2nd, 2009

While searching for the Financial Post report of today’s block trades – couldn’t find it, by the way, I can only hope they’re still publishing it – I serendipituously came across an essay by Jeffrey MacIntosh, the Toronto Stock Exchange Professor of Capital Markets at the Faculty of Law, University of Toronto on Pegged Orders.

It really is excellent. As Dr. MacIntosh explains, fragmentation of the marketplace into many exchanges has resulted in order books that may not necessarily be showing the same bid and ask. Regulators require that orders be routed to the exchange that will give best execution, which in turn requires that all exchanges post their Best Bid and Offer to the National Best Bid and Offer book (NBBO).

A downside of having multiple marketplaces, however, is that only price, rather than price-time priority can effectively be enforced given existing technology. Herein lies the problem. Exploiting the absence of inter-market price-time priority, some trading venues have created order types that pose a danger to the virtual single market.

Some marketplaces, for example, have allowed their customers to enter “pegged” orders that adjust automatically to match the NBBO. These marketplaces then allow these orders to be executed ahead of identically priced orders that were previously posted on another marketplace

Dr. MacIntosh believes that Pegged Orders should be banned:

Allowing pegged orders to scoop the NBBO does more than create the impression of an unfair market. It allows traders using pegged orders to effectively remove their orders from the price discovery process. It also imprisons liquidity within a single marketplace, reducing the extent to which orders on different marketplaces interact. If my bid on Market A is the NBBO, for example, I would normally expect that a matching offer on Market B will be forwarded to Market A for execution. However, if Market B permits pegged orders, an inferior bid in Market B’s order book will jump the queue, leaving my order unexecuted. If this happens often, I will clearly think twice before lining Market A’s books — or any other market’s books — with orders.

This is simply because pegged orders reduce the returns to posting limit orders. This constitutes a direct assault on what makes stock exchanges tick. Those who post limit orders are liquidity makers, since they offer other traders the opportunity to trade at the posted price. Those who hit these orders are liquidity “takers.” Since liquidity is a valuable commodity, a limit order thus has an “option” value to all potential traders. It is for this reason that most modern stock trading venues actually pay traders to post limit orders, charging only the “active” side on any trade that results.

Liquidity makers and liquidity takers exist because traders and trading strategies are heterogeneous. One cannot exist without the other. Harming the interests of one harms the interests of both.

I’m of two minds about this. Assiduous Readers will know already what my instincts are: NO MORE BLOODY RULES! Let better traders make lots of money at the expense of those who aren’t so good. However, his point that retail might take their money and go home if they perceive that the market is unfair is certainly a valid concern.

However, is banning really the answer? Pegged Orders represent a simple-minded trading strategy – and there is nothing a trader (particularly a bond trader) likes better than exploiting the inefficiency of a simple-minded trading strategy.

Say, for instance, I’m attempting to sell some XYZ, a thinly traded stock with a wide bid-offer spread, and I see that there are a boatload of Pegged Orders on the bid. I should then be able to cackle with glee and put in a bid very close to the offer on some off-beat exchange for, say, 100 shares. All the pegged orders will move up to match my price within microseconds, I’ll hit them within microseconds and cancel my bid within microseconds. Total time to set up algorithmic trading routine: five minutes. Execution time: Less than 1 second. Profits: enormous.

I am not an expert on the intricacies of order regulation and I suspect I could get into a lot of trouble for doing this, with regulators whining that my one-second bid wasn’t honest enough. That, however, is part of my point. In their attempts to change the shark tank into a wading pool, regulators are forced to create more and more intricate layers of rules, which ultimately serve no purpose other than reducing the penalties for incompetent trading, getting honest traders into trouble if they forget subparagraph 14(a)(ii)(7)(z)(b) and, of course, providing steady employment for regulators.

Update: Pegged Orders have been allowed on NASDAQ since 2003, but the question of inter-market time priority is not addressed in the linked document. Dr. McIntosh’s full article was republished on the UofT Faculty of Law Blog.

May 1, 2009

Friday, May 1st, 2009

I understand that Scotia has done an Innovative Tier 1 Capital deal, described as “650 million deal June 30, 2019-2108 … at 7.804%”, but have no further details, no press release, nothing on SEDAR.

One of my favourite words has been banned in the UK:

Liquidity, equity and stabilization are “grandiose or ambiguous” words that shouldn’t be used in investment brochures, Britain’s financial regulator said.

Short, punchy sentences with sub-headings and colored graphs should replace swathes of text, the Financial Services Authority said in a paper yesterday. Too much data is as bad as no information as it deters customers from properly reading documents, the London-based agency said.

If financial companies bamboozle customers with technical language, they won’t be treating them fairly — one of the principles by which they must abide — the FSA said. The regulator may not be following its own advice: FSA Chairman Adair Turner used the word “liquidity” 187 times in a 126-page report in March on financial regulation.

The actual paper is something of a hoot. The intent of the FSA is laudable, but … when you explain complex investment instruments to retail, you can have precision or comprehension. Pick One.

The Chrysler bankruptcy is becoming a political circus:

President Barack Obama said Chrysler LLC lenders who turned down his buyout offers are a “small group of speculators” who forced the automaker into bankruptcy.

“A group of investment firms and hedge funds decided to hold out for the prospect of an unjustified taxpayer-funded bailout,” Obama said today in Washington before Chrysler filed for bankruptcy protection.

While lenders representing 70 percent of the Chrysler loans agreed to Obama’s offer of $2.25 billion in cash, the dissidents ignored a deadline of 6 p.m. yesterday, according to one of the investors who declined to be named.

Chrysler’s dissident lenders have on their side the “absolute priority” bankruptcy rule, which holds that value must be distributed according to the legal priorities of the stakeholders. What riled the group that put out the statement today was the fact that junior creditors, consisting of a workers healthcare trust, would get equity in a new Chrysler entity while they would not.

In the deal Chrysler was trying to conclude out of court, Fiat would have become a 20 percent owner of Chrysler, and a union retiree health-care trust fund would hold 55 percent, with the rest of the company staying in the government’s hands initially, according to people familiar with the matter. The government intends to replicate this, using bankruptcy to set up a new company, people familiar with the plan said.

“The U.S. bankruptcy code foresees the possibility that it may be necessary to vary from ‘absolute priority,’ in particular when a two-thirds majority is convinced it makes legal or business sense,” said Richard Hahn, co-chairman of the bankruptcy practice at Debevoise & Plimpton LLP, a New York law firm that isn’t involved in the Chrysler negotiations. “If the government has consents from 70 percent, that’s more than enough” to give equity to junior creditors.

The dissidents “may be calculating that they can get more money by waiting a bit longer,” Hahn said. “Presumably they will file objections in court. The issue is less whether they’ll win than whether they can cause a meaningful delay that may cause Chrysler or the government to come to an accommodation.”

The objections from the group of lenders also drew criticism from Michigan lawmakers, including Democratic Representatives John Dingell and Sander Levin.

“The rogue hedge funds that refused to agree to a fair offer to exchange debt for cash from the U.S. Treasury — firms I label as the ‘vultures’ — will now be dealt with accordingly in court,” Dingell said.

Histrionics, flat declarations and squabbling over the carcass is nothing new in bankruptcy proceedings. The fact that one of the squabblers in the President of the United States of America is worrisome.

A paper on VoxEU titled Private pensions and policy responses to the crisis drew my attention to the OECD Pension Outlook 2008 that had many interesting things to say, for instance:

and (from the related documentation on Pension Plan fees, emphasis added):

While competition is normally expected to bring down costs, individual account pension markets behave in a counterintuitive manner. Marketing and sales agents have been used in the past to encourage members to switch providers, leading to an increase in operational expenses and fees. As members are not very responsive to higher fees, systems that a priori seemed to be highly competitive, with many players, have actually turned out to do rather poorly in terms of fees.

and

The paper argues that the particularly low fees observed in Bolivia and Sweden at the inception of their respective systems stem largely from a decision to force cost competition among providers via a central agency or ‗clearing house‘.

One possible explanation for the low costs in countries like Bolivia and Uruguay may be the conservative asset allocation of pension funds in these countries (Bolivian pension funds invest more than 90% in domestic treasury bonds).

There’s also ancilliary documentation on performance which shows Canada doing well, although data is limited.

Volumes came down a little today, but remain very healthy – and the market continued to rise, with some very high prices being seen for recent fixed-resets.

HIMIPref™ Preferred Indices
These values reflect the December 2008 revision of the HIMIPref™ Indices

Values are provisional and are finalized monthly
Index Mean
Current
Yield
(at bid)
Median
YTW
Median
Average
Trading
Value
Median
Mod Dur
(YTW)
Issues Day’s Perf. Index Value
Ratchet 0.00 % 0.00 % 0 0.00 0 0.6577 % 977.0
FixedFloater 0.00 % 0.00 % 0 0.00 0 0.6577 % 1,580.0
Floater 3.86 % 4.49 % 70,841 16.42 3 0.6577 % 1,220.6
OpRet 5.09 % 4.30 % 140,049 3.19 15 0.0801 % 2,139.6
SplitShare 6.07 % 7.52 % 46,729 4.29 3 0.2554 % 1,770.2
Interest-Bearing 6.05 % 7.87 % 28,495 0.65 1 -0.5020 % 1,969.3
Perpetual-Premium 0.00 % 0.00 % 0 0.00 0 0.5016 % 1,658.7
Perpetual-Discount 6.59 % 6.73 % 144,512 12.92 71 0.5016 % 1,527.7
FixedReset 5.80 % 4.90 % 587,704 4.54 36 0.6848 % 1,952.8
Performance Highlights
Issue Index Change Notes
RY.PR.H Perpetual-Discount 1.00 % YTW SCENARIO
Maturity Type : Limit Maturity
Maturity Date : 2039-05-01
Maturity Price : 23.00
Evaluated at bid price : 23.15
Bid-YTW : 6.11 %
BNS.PR.N Perpetual-Discount 1.04 % YTW SCENARIO
Maturity Type : Limit Maturity
Maturity Date : 2039-05-01
Maturity Price : 21.47
Evaluated at bid price : 21.47
Bid-YTW : 6.16 %
CIU.PR.B FixedReset 1.04 % YTW SCENARIO
Maturity Type : Call
Maturity Date : 2014-07-01
Maturity Price : 25.00
Evaluated at bid price : 27.08
Bid-YTW : 5.03 %
BMO.PR.K Perpetual-Discount 1.05 % YTW SCENARIO
Maturity Type : Limit Maturity
Maturity Date : 2039-05-01
Maturity Price : 20.13
Evaluated at bid price : 20.13
Bid-YTW : 6.54 %
CM.PR.J Perpetual-Discount 1.08 % YTW SCENARIO
Maturity Type : Limit Maturity
Maturity Date : 2039-05-01
Maturity Price : 16.85
Evaluated at bid price : 16.85
Bid-YTW : 6.73 %
RY.PR.N FixedReset 1.11 % YTW SCENARIO
Maturity Type : Call
Maturity Date : 2014-03-26
Maturity Price : 25.00
Evaluated at bid price : 26.40
Bid-YTW : 4.90 %
RY.PR.T FixedReset 1.11 % YTW SCENARIO
Maturity Type : Call
Maturity Date : 2014-09-23
Maturity Price : 25.00
Evaluated at bid price : 26.35
Bid-YTW : 5.30 %
POW.PR.A Perpetual-Discount 1.12 % YTW SCENARIO
Maturity Type : Limit Maturity
Maturity Date : 2039-05-01
Maturity Price : 20.75
Evaluated at bid price : 20.75
Bid-YTW : 6.83 %
TD.PR.E FixedReset 1.13 % YTW SCENARIO
Maturity Type : Call
Maturity Date : 2014-05-30
Maturity Price : 25.00
Evaluated at bid price : 26.75
Bid-YTW : 4.72 %
BNS.PR.K Perpetual-Discount 1.16 % YTW SCENARIO
Maturity Type : Limit Maturity
Maturity Date : 2039-05-01
Maturity Price : 19.17
Evaluated at bid price : 19.17
Bid-YTW : 6.31 %
RY.PR.I FixedReset 1.22 % YTW SCENARIO
Maturity Type : Limit Maturity
Maturity Date : 2039-05-01
Maturity Price : 24.05
Evaluated at bid price : 24.09
Bid-YTW : 4.15 %
BNS.PR.J Perpetual-Discount 1.29 % YTW SCENARIO
Maturity Type : Limit Maturity
Maturity Date : 2039-05-01
Maturity Price : 21.20
Evaluated at bid price : 21.20
Bid-YTW : 6.24 %
CU.PR.A Perpetual-Discount 1.31 % YTW SCENARIO
Maturity Type : Limit Maturity
Maturity Date : 2039-05-01
Maturity Price : 23.76
Evaluated at bid price : 24.06
Bid-YTW : 6.13 %
BNS.PR.X FixedReset 1.36 % YTW SCENARIO
Maturity Type : Call
Maturity Date : 2014-05-25
Maturity Price : 25.00
Evaluated at bid price : 26.86
Bid-YTW : 4.63 %
CM.PR.M FixedReset 1.51 % YTW SCENARIO
Maturity Type : Call
Maturity Date : 2014-08-30
Maturity Price : 25.00
Evaluated at bid price : 26.90
Bid-YTW : 5.09 %
BMO.PR.H Perpetual-Discount 1.57 % YTW SCENARIO
Maturity Type : Limit Maturity
Maturity Date : 2039-05-01
Maturity Price : 20.72
Evaluated at bid price : 20.72
Bid-YTW : 6.41 %
CM.PR.L FixedReset 1.58 % YTW SCENARIO
Maturity Type : Call
Maturity Date : 2014-05-30
Maturity Price : 25.00
Evaluated at bid price : 26.92
Bid-YTW : 4.81 %
HSB.PR.C Perpetual-Discount 1.65 % YTW SCENARIO
Maturity Type : Limit Maturity
Maturity Date : 2039-05-01
Maturity Price : 18.48
Evaluated at bid price : 18.48
Bid-YTW : 7.00 %
BNS.PR.R FixedReset 1.70 % YTW SCENARIO
Maturity Type : Limit Maturity
Maturity Date : 2039-05-01
Maturity Price : 23.87
Evaluated at bid price : 23.91
Bid-YTW : 4.14 %
BAM.PR.K Floater 1.72 % YTW SCENARIO
Maturity Type : Limit Maturity
Maturity Date : 2039-05-01
Maturity Price : 8.85
Evaluated at bid price : 8.85
Bid-YTW : 4.49 %
HSB.PR.D Perpetual-Discount 1.85 % YTW SCENARIO
Maturity Type : Limit Maturity
Maturity Date : 2039-05-01
Maturity Price : 18.14
Evaluated at bid price : 18.14
Bid-YTW : 7.00 %
TD.PR.Y FixedReset 1.91 % YTW SCENARIO
Maturity Type : Limit Maturity
Maturity Date : 2039-05-01
Maturity Price : 23.94
Evaluated at bid price : 24.00
Bid-YTW : 3.98 %
SLF.PR.B Perpetual-Discount 1.98 % YTW SCENARIO
Maturity Type : Limit Maturity
Maturity Date : 2039-05-01
Maturity Price : 17.51
Evaluated at bid price : 17.51
Bid-YTW : 6.96 %
BNS.PR.O Perpetual-Discount 1.99 % YTW SCENARIO
Maturity Type : Limit Maturity
Maturity Date : 2039-05-01
Maturity Price : 22.43
Evaluated at bid price : 22.55
Bid-YTW : 6.25 %
CL.PR.B Perpetual-Discount 1.99 % YTW SCENARIO
Maturity Type : Limit Maturity
Maturity Date : 2039-05-01
Maturity Price : 22.77
Evaluated at bid price : 23.05
Bid-YTW : 6.87 %
TD.PR.S FixedReset 2.11 % YTW SCENARIO
Maturity Type : Limit Maturity
Maturity Date : 2039-05-01
Maturity Price : 23.66
Evaluated at bid price : 23.74
Bid-YTW : 3.91 %
BMO.PR.L Perpetual-Discount 2.60 % YTW SCENARIO
Maturity Type : Limit Maturity
Maturity Date : 2039-05-01
Maturity Price : 22.40
Evaluated at bid price : 22.52
Bid-YTW : 6.45 %
Volume Highlights
Issue Index Shares
Traded
Notes
MFC.PR.D FixedReset 122,476 YTW SCENARIO
Maturity Type : Call
Maturity Date : 2014-07-19
Maturity Price : 25.00
Evaluated at bid price : 26.11
Bid-YTW : 5.87 %
RY.PR.Y FixedReset 112,090 Recent new issue.
YTW SCENARIO
Maturity Type : Call
Maturity Date : 2014-12-24
Maturity Price : 25.00
Evaluated at bid price : 25.85
Bid-YTW : 5.43 %
SLF.PR.A Perpetual-Discount 59,015 YTW SCENARIO
Maturity Type : Limit Maturity
Maturity Date : 2039-05-01
Maturity Price : 16.98
Evaluated at bid price : 16.98
Bid-YTW : 7.10 %
TD.PR.S FixedReset 42,535 YTW SCENARIO
Maturity Type : Limit Maturity
Maturity Date : 2039-05-01
Maturity Price : 23.66
Evaluated at bid price : 23.74
Bid-YTW : 3.91 %
TD.PR.R Perpetual-Discount 42,400 YTW SCENARIO
Maturity Type : Limit Maturity
Maturity Date : 2039-05-01
Maturity Price : 22.22
Evaluated at bid price : 22.33
Bid-YTW : 6.31 %
IAG.PR.C FixedReset 34,828 YTW SCENARIO
Maturity Type : Limit Maturity
Maturity Date : 2039-05-01
Maturity Price : 24.35
Evaluated at bid price : 24.40
Bid-YTW : 5.61 %
There were 28 other index-included issues trading in excess of 10,000 shares.

HIMIPref™ Index Rebalancing: April 2009

Friday, May 1st, 2009
HIMI Index Changes, April 30, 2009
Issue From To Because
BNA.PR.B SplitShare Scraps Volume
CGI.PR.B Scraps SplitShare Volume
TRI.PR.B Scraps Floater Volume

To my chagrin, there are now only two issues left in the SplitShare index, all from BAM Split Corp.: BNA.PR.A and BNA.PR.C.

There were the following intra-month changes:

HIMI Index Changes during April 2009
Issue Action Index Because
RY.PR.X Add FixedReset New issue
NSI.PR.C Delete Scraps Redeemed
WN.PR.B Delete Scraps Redeemed
HSB.PR.E Add FixedReset New Issue
RY.PR.Y Add FixedReset New Issue

HSB.PR.E is one of those issues which are sent to try us. It was announced on March 23 with an anticipated closing date of March 31. I assumed it had settled – albeit without trading – and added it to the index for March 31. However, the issue had not settled; there were problems due to the downgrade by S&P. A new term sheet was released and the issue settled on April 8.

Update: The SplitShares index is now comprised of BNA.PR.A, BNA.PR.C & CGI.PR.B.