Archive for January, 2010

BoC Working Paper on Liquidity & Volatility

Tuesday, January 5th, 2010

The Bank of Canada has released Working Paper 2010-1 by B. Ravikumar and Enchuan Shao titled Search Frictions and Asset Price Volatility:

We examine the quantitative effect of search frictions in product markets on asset price volatility. We combine several features from Shi (1997) and Lagos and Wright (2002) in a model without money. Households prefer special goods and general goods. Special goods can be obtained only via a search in decentralized markets. General goods can be obtained via trade in centralized competitive markets and via ownership of an asset. There is only one asset in our model that yields general goods. The asset is also used as a medium of exchange in the decentralized market to obtain the special goods. The value of the asset in facilitating transactions in the decentralized market is determined endogenously. This transaction role makes the asset pricing implications of our model different from those in the standard asset pricing model. Our model not only delivers the observed average rate of return on equity and the volatility of the equity price, but also accounts for most of the spectral characteristics of the equity price.

This is a good paper; unfortunately the prosaic explanations of the model are rather heavily larded with the math; and I am not sufficiently comfortable with the math to provide my own textual explanation. But I’ll do what I can.

The authors were most interested in attacking the excess volatility puzzle:

LeRoy and Porter (1981) and Shiller (1981) calculated the time series for asset prices using the simple present value formula – the current price of an asset is equal to the expected discounted present value of its future dividends. Using a constant interest rate to discount the future, they showed that the variance of the observed prices for U.S. equity exceeds the variance implied by the present value formula (see figure 1). This is the excess volatility puzzle.

After the rather precious definition of the General Good as a “tree” and the Special Goods as “fruits”, they explain:

Random matching during the day will typically result in non-degenerate distributions of asset holdings. In order to maintain tractability, we use the device of large households along the lines of Shi (1997). Each household consists of a continuum of worker-shopper (or, seller-buyer) pairs. Buyers cannot produce the special good, only sellers are capable of production. We assume the fraction of buyers = fraction of sellers = 1 / 2 . Then, the probability of single coincidence meetings during the day is 1/4 α. Each household sends its buyers to the decentralized day market with take-it-or-leave-it instructions (q; s) – accept q units of special goods in exchange for s trees. Each household also sends its sellers with “accept” or “reject” instructions. There is no communication between buyers and sellers of the same household during the day. After the buyers and sellers finish trading in the day, the household pools the trees and shares the special goods across its members each period. By the law of large numbers, the distributions of trees and special goods are degenerate across house-holds. This allows us to focus on the representative household. The representative household’s consumption of the special good is [q α/4].

…. and the interesting part is …

To compute the “liquidity value” of the asset, we set β and δ set at their benchmark values (Table 1) and calculate the price sequence for a standard asset pricing model such as Lucas (1978). This is easily done by setting u'(qt α / 4) = 1 for all t in equation (10). Since the standard asset pricing model does not assign any medium of exchange role to the asset, the difference between the prices implied by the standard model and ours would be the liquidity value of the asset. We compute the liquidity value as a fractionof the price implied by the standard model i.e., liquidity value = (Pmodel – PLucas) / PLucas. The mean liquidity value implied by our model is 17.5%.

This is a fascinating result, illustrating the value of liquidity in a segmented market. It is the function of dealers – and their capital – to reduce friction for all players, but to keep a piece for themselves . I will be fascinated to follow the progress of this model as, perhaps, it gets extended to include “households” that function in such a manner.

It is also apparent that when friction increases, the “flight to quality” into government bonds may be characterized to a great extent as a “flight to liquidity”.

New Issue: BAM FixedReset 5.40%+230

Tuesday, January 5th, 2010

Brookfield Asset Management has announced:

that it has agreed to issue to a syndicate of underwriters led by Scotia Capital Inc., CIBC World Markets, RBC Capital Markets, and TD Securities Inc. for distribution to the public 6,000,000 Preferred Shares, Series 24. The Preferred Shares, Series 24 will be issued at a price of $25.00 per share, for aggregate gross proceeds of CDN$150,000,000. Holders of the Preferred Shares, Series 24 will be entitled to receive a cumulative quarterly fixed dividend yielding 5.40% annually for the initial period ending June 30, 2016. Thereafter, the dividend rate will be reset every five years at a rate equal to the 5-year Government of Canada bond yield plus 2.30%.

Holders of Preferred Shares, Series 24 will have the right, at their option, to convert their shares into cumulative Preferred Shares, Series 25, subject to certain conditions, on June 30, 2016 and on June 30 every five years thereafter. Holders of the Preferred Shares, Series 25 will be entitled to receive cumulative quarterly floating dividends at a rate equal to the three-month Government of Canada Treasury Bill yield plus 2.30%.

Brookfield Asset Management Inc. has granted the underwriters an option, exercisable in whole or in part prior to closing, to purchase an additional 2,000,000 Preferred Shares, Series 24 at the same offering price. The Preferred Shares will be offered by way of prospectus supplement under the short form base shelf prospectus of Brookfield Asset Management Inc. dated January 12, 2009. The prospectus supplement will be filed with securities regulatory authorities in all provinces of Canada.

Note the relatively long term until the first Exchange Date: 6.5 years!

The first dividend will be for $0.2811, payable 2010-3-31, assuming a closing date of 2010-1-14.

BAM.PR.P, the 7.00%+445 FixedReset issued last June, closed last night at 27.30-42 to yield 4.90-79% until its presumed call 2014-9-30.

The BAM PerpetualDiscounts, BAM.PR.M & BAM.PR.N, closed last night yielding around 6.80%, therefore the Break-Even Rate Shock for the issue, according to the BERS Calculator is a very high 249bp.

Update: Brookfield has announced:

that as a result of strong investor demand for its previously announced public offering of Preferred Shares, Series 24, it has agreed to increase the size of the offering from CDN$150,000,000 to CDN$275,000,000 or from 6,000,000 Preferred Shares to 11,000,000 Preferred Shares. There will not be an underwriters’ option, as was previously granted.

Update: DBRS confirms a rating of Pfd-2(low) with a Stable trend.

January 4, 2010

Monday, January 4th, 2010

An unsigned article in the Globe had some interesting quotes from Dr. Robert Schiller:

In early 2000, the Yale University economics professor’s soon-to-become hugely influential book, Irrational Exuberance, was about to hit bookshelves – illuminating the world on how market bubbles form and how they burst. The book essentially foretold the popping of the dot-com bubble only a few months later.

Now, in the aftermath of the second major stock market collapse in less than a decade, Mr. Shiller is again being asked to help explain why stocks have become so volatile.

Mr. Shiller’s less-than-comforting answer: We’re mostly doing it to ourselves.

“I think it has to do with a different world view that we have adopted. We’re much more of an investing culture, all over the world, really, than we were in the past. There’s much more of an expectation of volatility.”

Mr. Shiller says our mass psychology is much more one of speculation and risk-taking than it was a generation or two ago. We’ve come to rely on rising markets to create our wealth and well-being, at the expense of savings.

With all respect to Dr. Schiller, I can’t help but feel that his judgement is somewhat harsh – or, at least, that part of the judgement that the Globe saw fit to publish.

We are living in an age of profound disruptive technologies. Computers … before 1980 they didn’t have much impact. Sure, mainframes made many things possible that hadn’t been possible in 1960; but they had nowhere near the impact on everyday business that they do now. Telecom … just having cheap telecom is in itself disruptive, and it only started getting cheap in the early 1990’s. Who had a cell-phone in 2000? The Internet … you can say what you like about the excesses of the Tech Bubble, but if you claim that the Internet is not a profoundly disruptive technology I won’t listen any more.

I claim that dayto-day business has been more disrupted in the past thirty years than at any other time in human history. And it seems to me that this will inevitably lead to market volatility. I’ll also note that it probably directly and indirectly allows charlatans to achieve influence in financial markets, but maybe that’s just my personal hobby-horse.

The politicization of corporate finance is picking up steam:

Bondholders with 70 percent of YRC’s $150 million of 8.5 percent notes due in April offered to tender, meeting the required threshold, the company said yesterday in a statement. That’s an increase over the 59 percent that participated by Dec. 29. Holders of 88 percent of all of the company’s outstanding bonds, with a face value of $470 million, participated in the exchange, the company said.

YRC’s $150 million of 8.5 percent notes rose 4.8 cents to 65.1 cents on the dollar yesterday, according to Trace, the bond-price reporting system of the Financial Industry Regulatory Authority.

“The most difficult bondholders to deal with were investors with credit-default swaps that paid off if the company went bankrupt,” Zollars, 62, said in a telephone interview. “It doesn’t seem right that individual investors would make money against companies surviving, particularly in this economy.”

The “risk of public rebuke,” along with “even more legislative threats” to the market for credit-default swaps resulting from the bankruptcy of a large employer of organized labor, helped the exchange pass, CreditSights Inc. analyst Sam Goodyear in New York wrote in a report yesterday.

Hoffa said the YRC debt exchange marked “our first time doing a campaign like this where we really had to get into high finance.”

“It’s a new breakthrough for labor unions working on Wall Street to make something happen,” Hoffa said yesterday. “It’s very positive for a major company.”

There’s not enough detail in the story to take a view: maybe the exchange offer was simply a good deal; maybe CDS prices and physicals were aligned so that the CDS writers had incentive to do asset swaps with holders of physicals and then tender; maybe – as I think happened with CIT – prices aligned so that writing protection was hugely profitable for the banks, who then had extra incentive to work on the tender; it could be a lot of things.

More interesting, though, is the role of organized labour, particularly in view of GM’s sweetheart deal. Extrapolate these trends long enough and maybe you’ll eventually have mid-size companies courting the unions in order to have more political clout when things get dangerous!

In highly surprising news, artificial government inspired demand has caused prices of senior sub-prime tranches to jump:

Only months after it was started, the U.S. program designed to purge debts of no immediate discernable value from the balance sheets of troubled banks has helped transform the frozen debt into a money-maker as the bonds have rallied. Bank of America Corp. and Citigroup Inc., who received 22 percent of the $418.7 billion American taxpayers loaned to troubled financial institutions, boosted holdings on their trading books of home- loan bonds that lack government guarantees while investors were raising cash for the program, according to Federal Reserve data.

Charlotte, North Carolina-based Bank of America along with Citigroup, Morgan Stanley and Goldman Sachs Group Inc., all based in New York, added a combined $2.74 billion of the debt, for which there were few buyers as recently as March, to their short-term trading assets during the third quarter, up 13 percent from the second quarter, the most-recent data show.

Prices for some of the securities that the funds were supposed to buy have almost doubled since March. The rally was fueled in part by traders jumping in before PPIP funds could get off the ground, said Steve Kuhn, who helps oversee about $440 million of mortgage-bond investments for Pine River Capital Management LLC in Minnetonka, Minnesota.

“Anytime people know there’s a buyer coming, they position for that, and that’s clearly what happened here,” said Kuhn, who is co-manager of the Nisswa Fixed Income Fund.

In between a motivated buyer and a motivated seller … how’s that for a trader’s dream?

The new year got off to a roaring start, with PerpetualDiscounts up 33bp and FixedResets gaining 10bp, taking the yield of the latter down to 3.57%. Volume was moderate.

HIMIPref™ Preferred Indices
These values reflect the December 2008 revision of the HIMIPref™ Indices

Values are provisional and are finalized monthly
Index Mean
Current
Yield
(at bid)
Median
YTW
Median
Average
Trading
Value
Median
Mod Dur
(YTW)
Issues Day’s Perf. Index Value
Ratchet 0.00 % 0.00 % 0 0.00 0 0.5922 % 1,636.0
FixedFloater 5.66 % 3.82 % 37,202 19.00 1 0.5236 % 2,750.7
Floater 2.40 % 2.77 % 103,411 20.34 3 0.5922 % 2,043.8
OpRet 4.80 % -6.42 % 110,202 0.09 13 0.0304 % 2,334.5
SplitShare 6.39 % -7.35 % 186,948 0.08 2 0.1766 % 2,102.3
Interest-Bearing 0.00 % 0.00 % 0 0.00 0 0.0304 % 2,134.6
Perpetual-Premium 5.75 % 5.67 % 144,130 5.94 12 0.1712 % 1,894.4
Perpetual-Discount 5.79 % 5.85 % 179,977 14.15 63 0.3300 % 1,811.1
FixedReset 5.38 % 3.57 % 319,262 3.84 41 0.1038 % 2,179.7
Performance Highlights
Issue Index Change Notes
ELF.PR.G Perpetual-Discount -2.34 % YTW SCENARIO
Maturity Type : Limit Maturity
Maturity Date : 2040-01-04
Maturity Price : 17.51
Evaluated at bid price : 17.51
Bid-YTW : 6.82 %
PWF.PR.K Perpetual-Discount 1.03 % YTW SCENARIO
Maturity Type : Limit Maturity
Maturity Date : 2040-01-04
Maturity Price : 21.63
Evaluated at bid price : 21.63
Bid-YTW : 5.83 %
POW.PR.B Perpetual-Discount 1.04 % YTW SCENARIO
Maturity Type : Limit Maturity
Maturity Date : 2040-01-04
Maturity Price : 22.01
Evaluated at bid price : 22.35
Bid-YTW : 6.00 %
SLF.PR.A Perpetual-Discount 1.27 % YTW SCENARIO
Maturity Type : Limit Maturity
Maturity Date : 2040-01-04
Maturity Price : 20.70
Evaluated at bid price : 20.70
Bid-YTW : 5.78 %
NA.PR.N FixedReset 1.48 % YTW SCENARIO
Maturity Type : Call
Maturity Date : 2013-09-14
Maturity Price : 25.00
Evaluated at bid price : 27.40
Bid-YTW : 2.81 %
BMO.PR.J Perpetual-Discount 1.54 % YTW SCENARIO
Maturity Type : Limit Maturity
Maturity Date : 2040-01-04
Maturity Price : 21.12
Evaluated at bid price : 21.12
Bid-YTW : 5.40 %
POW.PR.D Perpetual-Discount 1.64 % YTW SCENARIO
Maturity Type : Limit Maturity
Maturity Date : 2040-01-04
Maturity Price : 21.12
Evaluated at bid price : 21.12
Bid-YTW : 5.95 %
NA.PR.L Perpetual-Discount 1.65 % YTW SCENARIO
Maturity Type : Limit Maturity
Maturity Date : 2040-01-04
Maturity Price : 22.06
Evaluated at bid price : 22.20
Bid-YTW : 5.54 %
TD.PR.O Perpetual-Discount 1.69 % YTW SCENARIO
Maturity Type : Limit Maturity
Maturity Date : 2040-01-04
Maturity Price : 23.19
Evaluated at bid price : 23.40
Bid-YTW : 5.26 %
HSB.PR.D Perpetual-Discount 2.04 % YTW SCENARIO
Maturity Type : Limit Maturity
Maturity Date : 2040-01-04
Maturity Price : 21.88
Evaluated at bid price : 22.00
Bid-YTW : 5.72 %
BAM.PR.B Floater 2.37 % YTW SCENARIO
Maturity Type : Limit Maturity
Maturity Date : 2040-01-04
Maturity Price : 14.25
Evaluated at bid price : 14.25
Bid-YTW : 2.77 %
HSB.PR.C Perpetual-Discount 3.01 % YTW SCENARIO
Maturity Type : Limit Maturity
Maturity Date : 2040-01-04
Maturity Price : 22.73
Evaluated at bid price : 22.92
Bid-YTW : 5.60 %
Volume Highlights
Issue Index Shares
Traded
Notes
CM.PR.R OpRet 135,210 RBC crossed blocks of 116,700 and 16,000 shares, both at 26.30.
YTW SCENARIO
Maturity Type : Call
Maturity Date : 2010-02-03
Maturity Price : 25.60
Evaluated at bid price : 26.15
Bid-YTW : -23.99 %
CM.PR.D Perpetual-Discount 78,000 RBC crossed 64,800 at 24.55.
YTW SCENARIO
Maturity Type : Limit Maturity
Maturity Date : 2040-01-04
Maturity Price : 24.22
Evaluated at bid price : 24.56
Bid-YTW : 5.85 %
TD.PR.E FixedReset 50,070 TD crossed 34,000 at 28.05.
YTW SCENARIO
Maturity Type : Call
Maturity Date : 2014-05-30
Maturity Price : 25.00
Evaluated at bid price : 28.01
Bid-YTW : 3.61 %
TRP.PR.A FixedReset 48,296 YTW SCENARIO
Maturity Type : Call
Maturity Date : 2015-01-30
Maturity Price : 25.00
Evaluated at bid price : 25.86
Bid-YTW : 3.88 %
TD.PR.N OpRet 40,600 RBC crossed 33,900 at 26.40.
YTW SCENARIO
Maturity Type : Call
Maturity Date : 2010-02-03
Maturity Price : 26.00
Evaluated at bid price : 26.38
Bid-YTW : -3.95 %
CM.PR.L FixedReset 27,105 TD crossed 19,500 at 28.00.
YTW SCENARIO
Maturity Type : Call
Maturity Date : 2014-05-30
Maturity Price : 25.00
Evaluated at bid price : 27.97
Bid-YTW : 3.51 %
There were 25 other index-included issues trading in excess of 10,000 shares.

Update: Assiduous Reader prefhound writes in and says:

I am quite fond of Prof Shiller (no “c”) and irrational exuberance. It was he and his database that taught me the basics of long run rational stock market return expectations as the sum of Dividends + Inflation + Real EPS Growth + Changes in P/E. The reason we can’t expect the 10% returns of the 20th century from stocks are than Dividends are now 2% not 4+% and we can’t reasonably continue to expect the P/E to grow by 1% per year.

Thus, the forward outlook for gross stock returns BEFORE fees is 2% yield + 2% inflation + 1.6% + 0 = 5.6%. That is a big problem for pension plans and the CPP (which assumes more like 7+%). AND it is a great opportunity for taxable pref share investors and prefblog! Who needs stock volatility when you can get the same return with lower volatility from discount prefs and augment it with sensible switching trades?

Anyway, I mention rational expectations as a forward to another reason why I respect Shiller: the long run Real EPS growth rate does not fluctuate very much and did not fluctuate hugely around innovations like computers etc that you mention. Indeed, early innovative companies were not that profitable until recently. Competition ensures that ROE on a national scale does not vary due to innovation in the medium to long run. P/E might (and did — skyrocketing from 7.5 for the S&P-500 in 1979 to 35 in 2000).

With respect to volatility, Shiller may be right about the short-term casino-like behaviour being more common today, but I don’t see any effect on volatility. The recent credit crunch saw VIX (S&P-500 index volatility) rise to similar levels as in the 1987 crash and ease off. Volatility itself fluctuates over time (which is why there are derivatives on VIX): long run Vix data for 24 years doesn’t show a gradual decline or increase — it shows periods of spikes, mounds and retreats — and it is mean reverting. [It is hard to check out CBOE data which currently goes back only to 1990, but the old VXO precursor started in 1986 — I have an older CBOE spreadsheet with it. Even since 1990 you can see the same picture — but the VXO levels went as high as 150 on Oct 19, 1987].

Secondly on the volatility side, I’m not sure about the strength of the seemingly attractive argument about more casino-like behaviour being the “cause” of “extra volatility” not even observed.

My sense is there is more trading volume than their used to be (turnover), but that many buys are broadly matched by sells (by funds and other institutional investors, for example). As John Bogle, founder of Vanguard, often notes — weve gone from individual stock owners to mutual fund owners over 40 years. Mutual fund owners don’t change their asset mix that rapidly to affect market volatility. When they switch from Fund A to Fund B so their “advisor” can continue to receive a trailer fee there is no net buying or selling to affect market volatility.

My guess is that the “herd instinct” is as alive and as operative in amateur and professional investors alike as it ever was, and that explains why volatility is more or less the same as it has been for (at least) 25 years of the VIX.

Indeed, using Shiller’s database of 140 years of S&P monthly average data, one can show that the average annual volatility has no discernible trend over a much longer period – other than frequent spikes (see figure). Let’s not lose the forest for studying one tree in detail!

[Note: To get volatility of a magnitude comparable to VIX (which uses daily data), multiply the standard deviation in this figure by about 2.5]

I’m not sure if you and Prof. Shiller and I are all talking about the same “volatility”. VIX is a measure calculated daily using option data; I think Shiller’s comments relate more to boom-bust cycles and their frequency and severity.

Update 2010-1-6: prefhound points out that I didn’t reproduce his chart:


Click for big

… but I must say that I am not a big fan of standard deviation as a measure of volatility. Not for this kind of stuff, anyway.

S&P Downgrades MFC

Monday, January 4th, 2010

Standard and Poor’s has announced:

Manulife Financial Corp. (MFC) completed its planned subsidiary reorganization on Dec. 31, 2009. Following the close of this transaction, we have lowered the ratings on MFC and John Hancock Financial Services Inc. to ‘A+’ from ‘AA-‘ in order to restore standard notching upon completion of the subsidiary reorganization, because the reorganization reduces MFC’s cash flow diversification. At the same time, we have removed MFC from its CreditWatch listing where it was placed on Nov. 5, 2009.We are also both withdrawing and assigning new ratings on certain subsidiaries and issues to reflect the new group structure and the new rating action on MFC.The outlook on all of these ratings is negative, paralleling the negative outlook on MFC’s higher-rated insurance operating subsidiaries.

This executes the warning discussed in the PrefBlog post MFC: S&P Places Ratings on Watch-Negative, for the reasons discussed there (basically, all of the holdco’s income now comes from a single source and must be approved by a single regulator. Before, it was two sources and two regulators acting independently).

The preferreds remain at P-1(low), presumably because the mapping of the new “A-” global scale for them is still within the P-1(low) bounds of the courser national scale.

Manulife has five issues of preferred shares outstanding: MFC.PR.A (OpRet), MFC.PR.B & MFC.PR.C (PerpetualDiscount) and MFC.PR.D & MFC.PR.E (FixedReset).

G&M Interviews Julia Dickson of OSFI

Monday, January 4th, 2010

The Globe and Mail interviewed Julia Dickson for today’s paper:

That is good – to focus on too big to fail and market discipline – but some of the suggestions for dealing with that are not appropriate, such as determining which institutions are systemic [too big to allow to fail] and trying to assess some sort of capital charge on them.

There are various reasons for that, but I think that designating institutions as systemic will lead them to take more risk, and I think that coming up with the capital charge would be hugely challenging.

Ms. Dickson’s opposition to Treasury’s proposal to designate systemically important institutions is well known, but the fact that “coming up with the capital charge would be hugely challenging” is hardly a reason to ignore the issue.

OSFI has already specified Operation Risk Requirements, which are included in risk weighted assets. One formulation considered acceptable is:

Operational risk is defined as the risk of loss resulting from inadequate or failed internal processes, people and systems or from external events. This definition includes legal risk,66 but excludes strategic and reputational risk.

Banks using the Basic Indicator Approach must hold capital for operational risk equal to the average over the previous three years of a fixed percentage (denoted alpha) of positive annual gross income. Figures for any year in which annual gross income is negative or zero should be excluded from both the numerator and denominator when calculating the average.68 The charge may be expressed as follows:
KBIA = [Σ(GI1…n x α)]/n
Where
KBIA = the capital charge under the Basic Indicator Approach
GI = annual gross income, where positive, over the previous three years
n = number of the previous three years for which gross income is positive
α = 15%, which is set by the Committee, relating the industry wide level of required capital to the industry wide level of the indicator.

Gross Income is a better-than-random proxy for systemic importance and I thing many people will agree that a major part of the Credit Crunch was “inadequate or failed internal processes” related to risk control. If setting α to 15% has proved to be inadequate, try doubling it and see how the back-tests work out. That’s one way. I still prefer a progressive surcharge on Risk-Weighted Assets starting at, say, $250-billion.

We would be more in favour of promoting the idea of contingent capital internationally. So that’s where you have a big chunk of subordinated debt that converts into common equity if the government feels that it has to step in to protect an institution or inject money into the institution. So that’s the kind of position we’re taking internationally, and it’s a huge issue.

I guess if you quantify your proposal simply as a “big chunk of subordinated debt”, the challenge becomes less huge.

Of more interest is the proposed trigger: “if the government feel it has to step in”. The Squam Lake double trigger has attracted some support, but as noted in my commentary on the BoE Financial Stability Report, I feel that such a determination will amount to a death sentence for the affected bank and will therefore come too late to be of use … as well as putting a ridiculous amount of power in the hands of regulators. Let the trigger be the market price of the common; the market understands that, can hedge it and, most importantly, will have some certainty in time of stress.

Bernanke: Monetary Policy and the Housing Bubble

Sunday, January 3rd, 2010

Bernanke has given a speech titled Monetary Policy and the Housing Bubble to the Annual Meeting of the American Economic Association:

As with regulatory policy, we must discern the lessons of the crisis for monetary policy. However, the nature of those lessons is controversial. Some observers have assigned monetary policy a central role in the crisis. Specifically, they claim that excessively easy monetary policy by the Federal Reserve in the first half of the decade helped cause a bubble in house prices in the United States, a bubble whose inevitable collapse proved a major source of the financial and economic stresses of the past two years.

These assertions have been discussed on PrefBlog, for example Taylor Rules and the Credit Crunch Cause; the seminal paper was discussed on Econbrowser, The Taylor Rule and the Housing Boom. But Bernanke has One Big Problem with blind use of the Taylor Rule:

For my purposes today, however, the most significant concern regarding the use of the standard Taylor rule as a policy benchmark is its implication that monetary policyshould depend on currently observed values of inflation and output.

However, because monetary policy works with a lag, effective monetary policy must take into account the forecast values of the goal variables, rather than the current values. Indeed, in that spirit, the FOMC issues regular economic projections, and these projections have been shown to have an important influence on policy decisions (Orphanides and Wieland, 2008).

when one takes into account that policymakers should and do respond differently to temporary and longer-lasting changes in inflation, monetary policy following the 2001 recession appears to have been reasonably appropriate, at least in relation to a simple policy rule.

Central to Bernanke’s argument is:

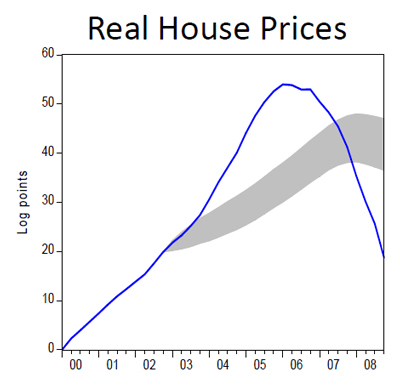
To demonstrate this finding in a simple way, I will use a statistical model developed by Federal Reserve Board researchers that summarizes the historical relationships among key macroeconomic indicators, house prices, and monetary policy (Dokko and others, 2009).

The model incorporates seven variables, including measures of economic growth, inflation, unemployment, residential investment, house prices, and the federal funds rate, and it is estimated using data from 1977 to 2002.

The right panel of the figure shows the forecast behavior of house prices during the recent period, taking as given macroeconomic conditions and the actual path of the federal funds rate. As you can see, the rise in house prices falls well outside the predictions of the model. Thus, when historical relationships are taken into account, it is difficult to ascribe the house price bubble either to monetary policy or to the broader macroeconomic environment.

One reason he suggests for the decoupling of historical relationships is ARMs and other exotic mortgages:

Clearly, for lenders and borrowers focused on minimizing the initial payment, the choice of mortgage type was far more important than the level of short-term interest rates.

The availability of these alternative mortgage products proved to be quite important and, as many have recognized, is likely a key explanation of the housing bubble.

Slide 8 is evidence of a protracted deterioration in mortgage underwriting standards, which was further exacerbated by practices such as the use of no-documentation loans. The picture that emerges is consistent with many accounts of the period: At some point, both lenders and borrowers became convinced that house prices would only go up. Borrowers chose, and were extended, mortgages that they could not be expected to service in the longer term. They were provided these loans on the expectation that accumulating home equity would soon allow refinancing into more sustainable mortgages. For a time, rising house prices became a self-fulfilling prophecy, but ultimately, further appreciation could not be sustained and house prices collapsed. This description suggests that regulatory and supervisory policies, rather than monetary policies, would have been more effective means of addressing the run-up in house prices.

He concludes:

I noted earlier that the most important source of lower initial monthly payments, which allowed more people to enter the housing market and bid for properties, was not the general level of short-term interest rates, but the increasing use of more exotic types of mortgages and the associated decline of underwriting standards. That conclusion suggests that the best response to the housing bubble would have been regulatory, not monetary. Stronger regulation and supervision aimed at problems with underwriting practices and lenders’ risk management would have been a more effective and surgical approach to constraining the housing bubble than a general increase in interest rates. Moreover, regulators, supervisors, and the private sector could have more effectively addressed building risk concentrations and inadequate risk-management practices without necessarily having had to make a judgment about the sustainability of house price increases.

For my own part, I can’t really do much but repeat my views expressed in the post Is Crony Capitalism Really Returning to America:

Americans should also be taking a hard look at the ultimate consumer friendliness of their financial expectations. They take as a matter of course mortgages that are:

  • 30 years in term
  • refinancable at little or no charge (usually; this may apply only to GSE mortgages; I don’t know all the rules)
  • non-recourse to borrower (there may be exceptions in some states)
  • guaranteed by institutions that simply could not operate as a private enterprise without considerably more financing
  • Added 2008-3-8: How could I forget? Tax Deductible

And I will add: following the Crash of 1929, margin rules on stock purchases were tightened:

The great stock market crash of 1929 was blamed on rampant speculation, excessive leverage, and inadequate regulatory oversight. The debacle caused a wave of bank and brokerage failures that devastated the US financial system. Investors were left reeling. In order to restore confidence in the securities markets, the Federal government took several steps, including creating the Securities and Exchange Act of 1934, separating the banking and securities industry, and giving the Federal Reserve Board the authority to set margin requirements, which it subsequently did through Regulation T [Reg T].

Margin rules have occasionally come under attack, as reported in 1985:

Federal Reserve Chairman Paul Volcker contended last week in a cover letter accompanying a 189-page report that such federal regulations are no longer needed. If they exist at all, he wrote, they should be set by the securities industry. Buying stocks on credit, his study concluded, “has become much less important . . . than it was in the early 1930s.” In 1928 nearly 10% of all stocks were bought on margin; last year only 1.4% were bought that way.

I think most will agree that in order to protect financial stability, the core banking/brokerage system must make a clear distinction between owner and lender by requiring the owner to put up significant capital to take the first loss in the event of adverse moves. So one regulatory change that would be worth seeing is a requirement that every mortgage have – for example – an ultimate loan-to-value ratio of less than 80%.

Thus, on a $500,000 house, the buyer should put up $100,000. I say “should” rather than “must” because I would not support overly-intrusive regulation: if a bank wants to fund the entire $500,000 and call it a loan – they’re quite welcome to. But – and it’s a big but, as the Bishop said to the actress – that $100,000 has to come from somewhere, so making such a loan will require a dollar-for-dollar adjustment to Tier 1 Capital.

Currently, the $500,000 loan would be risk-weighted at 35% to 175,000; maintaining a 10% Tier 1 Capital ratio then requires $17,500 in capital.

With the change as suggested, $400,000 would be treated as a 35% risk-weighted loan, equating to $140,000, requiring $14,000 in capital; but the $100,000 capital would also be required, bringing the total Tier 1 Capital required for the loan to $114,000 – a rather major difference!

In Canada, mortgages extended by a chartered bank with a loan-to-value of greater than 75% 80% must be CMHC insured; this accomplishes the same purpose (since the capital is, effectively, provided by the bottomless pockets of the taxpayer). And we’ll just have to hope that the CMHC gets their calculations right when setting premia!

Update: Last paragraph edited to reflect comment. See also the CMHC premium schedule and a Globe article on Spend-every-Penny’s musings on tightening the rules.

Update: Musing over the part of Slide 6 that I have reproduced can lead to interesting conclusions … primary among them being that, according to the Fed, US real-estate is a screaming buy right now.

Update, 2010-01-04: Don’t count on CMHC getting the premia calculations right! The Canada Small Business Financing Program, which supports the vitally important food and beverage sector by writing Credit Default Swaps, isn’t doing very well:

The program has so far guaranteed about $10 billion in small-business loans issued by banks, credit unions and others since 1999, and collects fees based on the size of the loan.

The revenue paid to Industry Canada was supposed to cover the default claims paid out, but the math has never worked in Ottawa’s favour.

Claims paid out have risen steadily over the decade, and now top $100 million annually, while revenues have consistently lagged, costing taxpayers a net $335 million so far.

Put another way, cost recovery is currently at only about 60 per cent rather than the 100 per cent that was planned, and is in steady decline.

“The gap between claims and fee revenues will continue to exist and most likely expand,” predicts the KPMG report, dated Oct. 30 and obtained by The Canadian Press under the Access to Information Act.

Update, 2010-01-05: Not surprisingly, Taylor doesn’t buy it:

John Taylor, creator of the so-called Taylor rule for guiding monetary policy, disputed Federal Reserve Chairman Ben S. Bernanke’s argument that low interest rates didn’t cause the U.S. housing bubble.

“The evidence is overwhelming that those low interest rates were not only unusually low but they logically were a factor in the housing boom and therefore ultimately the bust,” Taylor, a Stanford University economist, said in an interview today in Atlanta.

Update, 2010-01-08: James Hamilton of Econbrowser joins the consensus – it’s not a matter of either-or:

Fed Chair Ben Bernanke’s observations on monetary policy and the housing bubble have received a lot of attention. Like many other commentators (e.g., Arnold Kling, Paul Krugman, and Free Exchange), I agree with Bernanke’s conclusions, but only up to a point.

At least with the benefit of hindsight, I would have thought we could agree that the low interest rate targets of 2003-2005 were a mistake, because more stimulus to housing was the last thing the economy needed. This is not to deny that higher resource utilization rates were a possibility at the time. But I see this as one more illustration, to add to a long string of earlier historical examples, that it is possible to ask too much of monetary policy. Even if the unemployment rate is above where you want it to be and above where you expect it eventually to go, trying to bring it down faster by keeping the monetary gas pedal all the way to the floor can sometimes create bigger problems down the road.

The tone of the three references cited in Dr. Hamilton’s first paragraph is similar: ‘Well, sure, there were regulatory mistakes … but there will always be regulatory mistakes.’ While addressing these errors is a Good Thing, one should not forget to address the monetary policy that exacerbated these errors. Let’s not be too much like die-hard communists, claiming that every failure of that paradigm is due to errors of application, rather than fundamental errors of theory.

MAPF Performance: December 2009

Saturday, January 2nd, 2010

The fund performed well in December, but probably underperformed CPD which has a much higher weighting the Floating Rate issues which performed very well this month. MAPF’s performance increment over the PerpetualDiscount and FixedReset sectors (in which it is it is 85%+ weighted) was satisfactory.

The fund’s Net Asset Value per Unit as of the close December 31 was $10.5662 after giving effect to a Capital Gains Distribution of $1.989262 and a Dividend Distribution of $0.154071.

Returns to December 31, 2009
Period MAPF Index CPD
according to
Claymore
One Month +1.55% +1.97% +%
Three Months +2.94% +2.46% +%
One Year +66.29% +29.41% +%
Two Years (annualized) +26.45% +4.00% +% *
Three Years (annualized) +16.30% +0.49%  
Four Years (annualized) +13.87% +1.42%  
Five Years (annualized) +12.23% +1.90%  
Six Years (annualized) +12.43% +2.58%  
Seven Years (annualized) +15.23% +3.24%  
Eight Years (annualized) +13.37% +3.39%  
The Index is the BMO-CM “50”
MAPF returns assume reinvestment of dividends, and are shown after expenses but before fees.
CPD Returns are for the NAV and are after all fees and expenses.
* CPD does not directly report its two-year returns. The figure shown is the product of the current one-year return and the similar figure reported for December 2008
Figures for Omega Preferred Equity (which are after all fees and expenses) for 1-, 3- and 12-months are +1.5%, +2.3% and +26.6%, respectively, according to Morningstar after all fees & expenses
Figures for Jov Leon Frazer Preferred Equity Fund (which are after all fees and expenses) for 1-, 3- and 12-months are N/A, N/A & N/A, respectively, according to Morningstar and the Globe and Mail
Figures for AIC Preferred Income Fund (which are after all fees and expenses) for 1-, 3- and 12-months are +1.5%, +2.1% & N/A, respectively

MAPF returns assume reinvestment of dividends, and are shown after expenses but before fees. Past performance is not a guarantee of future performance. You can lose money investing in Malachite Aggressive Preferred Fund or any other fund. For more information, see the fund’s main page.

I am very pleased with the returns over the past year, but implore Assiduous Readers not to project this level of outperformance for the indefinite future. The year in the preferred share market was filled with episodes of panic and euphoria, together with many new entrants who do not appear to know what they are doing; perfect conditions for a disciplined quantitative approach.

Sometimes everything works … sometimes the trading works, but sectoral shifts overwhelm the increment … sometimes nothing works. The fund seeks to earn incremental return by selling liquidity (that is, taking the other side of trades that other market participants are strongly motivated to execute), which can also be referred to as ‘trading noise’. There have been a lot of strongly motivated market participants in the past year, generating a lot of noise! The conditions of the past year may never be repeated in my lifetime … but the fund will simply attempt to make trades when swaps seem profitable, whether that implies monthly turnover of 10% or 100%.

There’s plenty of room for new money left in the fund. Just don’t expect the current level of outperformance every year, OK? While I will continue to exert utmost efforts to outperform, it should be borne in mind that beating the index by 500bp represents a good year, and there will almost inevitably be periods of underperformance in the future.

On the one hand, I’m a bit relieved that the fourth quarter of 2009 was so normal – in terms of trading volume, index performance and performance increment. The problem with beating the index by thousands of beeps is that many people will simply assume the fund is taking enormous risks in low-quality issues – which is not the case – and not look any further to determine the truth. On the other hand … well, that’s a nice kind of problem to have!

The yields available on high quality preferred shares remain elevated, which is reflected in the current estimate of sustainable income.

Calculation of MAPF Sustainable Income Per Unit
Month NAVPU Portfolio
Average
YTW
Leverage
Divisor
Securities
Average
YTW
Capital
Gains
Multiplier
Sustainable
Income
per
current
Unit
June, 2007 9.3114 5.16% 1.03 5.01% 1.1883 0.3926
September 9.1489 5.35% 0.98 5.46% 1.1883 0.4203
December, 2007 9.0070 5.53% 0.942 5.87% 1.1883 0.4448
March, 2008 8.8512 6.17% 1.047 5.89% 1.1883 0.4389
June 8.3419 6.034% 0.952 6.338% 1.1883 $0.4449
September 8.1886 7.108% 0.969 7.335% 1.1883 $0.5054
December, 2008 8.0464 9.24% 1.008 9.166% 1.1883 $0.6206
March 2009 $8.8317 8.60% 0.995 8.802% 1.1883 $0.6423
June 10.9846 7.05% 0.999 7.057% 1.1883 $0.6524
September 12.3462 6.03% 0.998 6.042% 1.1883 $0.6278
December 2009 10.5662 5.74% 0.981 5.851% 1.0000 $0.6182
NAVPU is shown after quarterly distributions of dividend income and annual distribution of capital gains.
Portfolio YTW includes cash (or margin borrowing), with an assumed interest rate of 0.00%
The Leverage Divisor indicates the level of cash in the account: if the portfolio is 1% in cash, the Leverage Divisor will be 0.99
Securities YTW divides “Portfolio YTW” by the “Leverage Divisor” to show the average YTW on the securities held; this assumes that the cash is invested in (or raised from) all securities held, in proportion to their holdings.
The Capital Gains Multiplier adjusts for the effects of Capital Gains Dividends. On 2009-12-31, there was a capital gains distribution of $1.989262 which is assumed for this purpose to have been reinvested at the final price of $10.5662. Thus, a holder of one unit pre-distribution would have held 1.1883 units post-distribution; the CG Multiplier reflects this to make the time-series comparable. Note that Dividend Distributions are not assumed to be reinvested.
Sustainable Income is the resultant estimate of the fund’s dividend income per current unit, before fees and expenses. Note that a “current unit” includes reinvestment of prior capital gains; a unitholder would have had the calculated sustainable income with only, say, 0.9 units in the past which, with reinvestment of capital gains, would become 1.0 current units.

As discussed in the post MAPF Portfolio Composition: November 2009, the fund has a position in the high-yielding split-share BNA.PR.C, about half of which was sold in November in a swap for the slightly lower-yielding PerpetualDiscount BAM.PR.N. Additionally, the fund has a position in the high-yielding Operating Retractible YPG.PR.B. Both BNA.PR.C and YPG.PR.B are scheduled to mature (or to be retracted) in the future, hence the sustainability of sustainable yield calculated while incorporating their contribution is somewhat suspect, as discussed in August, 2008.

Significant positions were also held in Fixed-Reset issues on December 31; all of which currently have their yields calculated with the presumption that they will be called by the issuers at par at the first possible opportunity. This presents another complication in the calculation of sustainable yield.

However, if the entire portfolio except for the PerpetualDiscounts were to be sold and reinvested in these issues, the yield of the portfolio would be the 5.97% shown in the MAPF Portfolio Composition: December 2009 analysis(which is in excess of the 5.85% index yield on December 31). Given such reinvestment, the sustainable yield would be $10.5662 * 0.0597 = $0.6308 whereas a similar calculation for November results in 12.5153 * 0.0601 / 1.1883 = 0.6330. Note that the November figure has had to be adjusted to reflect the Capital Gains Multiplier. The slight decrease is partly due to the dividend distribution (in November the fund was earning income on the dividends earned but not yet distributed) and partly due to minor effects such as the improvement in credit quality over the month.

The equivalent calculation for December 2008 is $8.0464 [NAVPU] * 0.0749 [Yield on PerpetualDiscounts] / 1.1883 [Capital Gains Multiplier] = 0.5072, which shows that progress is indeed being made! The portfolio yield in the table is severely skewed by the presence of very high-yielding, short-term split shares in the December 2008 Portfolio.

Different assumptions lead to different results from the calculation, but the overall positive trend is apparent. I’m very pleased with the results! It will be noted that if there was no trading in the portfolio, one would expect the sustainable yield to be constant (before fees and expenses). The success of the fund’s trading is showing up in

  • the very good performance against the index
  • the long term increases in sustainable income per unit

As has been noted, the fund has maintained a credit quality equal to or better than the index; outperformance is due to constant exploitation of trading anomalies.

Again, there are no predictions for the future! The fund will continue to trade between issues in an attempt to exploit market gaps in liquidity, in an effort to outperform the index and keep the sustainable income per unit – however calculated! – growing.

Update 2010-1-3: Thanks to Assiduous Reader AS for pointing out a typo in the first paragraph. It has been corrected.

MAPF Portfolio Composition: December 2009

Saturday, January 2nd, 2010

Turnover declined somewhat in December to about 40%. This is yet another indication that things are slowly returning to normal – although I still think that spreads to bonds are elevated!

Trades were, as ever, triggered by a desire to exploit transient mispricing in the preferred share market (which may the thought of as “selling liquidity”), rather than any particular view being taken on market direction, sectoral performance or credit anticipation.

MAPF Sectoral Analysis 2009-12-31
HIMI Indices Sector Weighting YTW ModDur
Ratchet 0% N/A N/A
FixFloat 0% N/A N/A
Floater 0% N/A N/A
OpRet 0% N/A N/A
SplitShare 4.2% (-0.1) 8.34% 7.05
Interest Rearing 0% N/A N/A
PerpetualPremium 0.0% (-0.5) N/A N/A
PerpetualDiscount 72.7% (+0.1) 5.97% 13.98
Fixed-Reset 16.6% (-1.6) 3.62% 3.89
Scraps (OpRet) 4.6% (+0.1) 9.77% 5.92
Cash 1.9% (+2.1) 0.00% 0.00
Total 100% 5.74% 11.38
Totals and changes will not add precisely due to rounding. Bracketted figures represent change from November month-end. Cash is included in totals with duration and yield both equal to zero.

The “total” reflects the un-leveraged total portfolio (i.e., cash is included in the portfolio calculations and is deemed to have a duration and yield of 0.00.). MAPF will often have relatively large cash balances, both credit and debit, to facilitate trading. Figures presented in the table have been rounded to the indicated precision.

Credit distribution is:

MAPF Credit Analysis 2009-12-31
DBRS Rating Weighting
Pfd-1 0 (0)
Pfd-1(low) 82.5% (+4.2)
Pfd-2(high) 0.1% (-4.8)
Pfd-2 1.1% (-1.3)
Pfd-2(low) 9.7% (-0.4)
Pfd-3(high) 4.6% (-0.1)
Cash +1.9% (+2.1)
Totals will not add precisely due to rounding. Bracketted figures represent change from November month-end.

The decline in holdings of issues rated Pfd-2(high) was due largely to the sale of HSB.PR.E:

MAPF & HSB.PR.E
Date HSB.PR.E NA.PR.P RY.PR.X RY.PR.R CM.PR.L
11/30
Bid
Bid YTW
28.06
4.02%
27.80
3.86%
27.70
3.85%
27.62
3.68%
27.86
3.88%
12/8 Bot More
28.12
Sold
27.99
     
12.23 Sold
28.05
  Bot
27.95
   
12/24 Sold
28.12
    Bot
27.98
 
12/29 Sold
28.15
      Bot
27.88
12/31
Bid
Bid YTW
28.10
3.71%
28.06
3.72%
28.06
3.63%
28.07
3.35%
27.92
3.55%
Dividends 12/11
Earned
0.4125
      12/23
Missed
0.40625
This table attempts to present fairly the larger elements of a series of trades. Full disclosure of the 2009 trades will be made at the time the audited 2009 Financials are published.

Liquidity Distribution is:

MAPF Liquidity Analysis 2009-12-31
Average Daily Trading Weighting
<$50,000 0.0% (0)
$50,000 – $100,000 0.0% (-5.0)
$100,000 – $200,000 18.9% (+12.0)
$200,000 – $300,000 45.1% (-12.8)
>$300,000 34.0% (+3.5)
Cash +1.9% (+2.1)
Totals will not add precisely due to rounding. Bracketted figures represent change from November month-end.

MAPF is, of course, Malachite Aggressive Preferred Fund, a “unit trust” managed by Hymas Investment Management Inc. Further information and links to performance, audited financials and subscription information are available the fund’s web page. A “unit trust” is like a regular mutual fund, but is sold by offering memorandum rather than prospectus. This is cheaper, but means subscription is restricted to “accredited investors” (as defined by the Ontario Securities Commission) and those who subscribe for $150,000+. Fund past performances are not a guarantee of future performance. You can lose money investing in MAPF or any other fund.

A similar portfolio composition analysis has been performed on the Claymore Preferred Share ETF (symbol CPD) as of August 17 and published in the September PrefLetter. When comparing CPD and MAPF:

  • MAPF credit quality is better
  • MAPF liquidity is a little better
  • MAPF Yield is higher
  • Weightings in
    • MAPF is much more exposed to PerpetualDiscounts
    • MAPF is much less exposed to Operating Retractibles
    • MAPF is more exposed to SplitShares
    • MAPF is less exposed to FixFloat / Floater / Ratchet
    • MAPF weighting in FixedResets is much lower

Index Performance: December 2009

Saturday, January 2nd, 2010

Performance of the HIMIPref™ Indices for December, 2009, was:

Total Return
Index Performance
December 2009
Three Months
to
December 31, 2009
Ratchet +7.87%* +6.68%*
FixFloat +8.35% +2.96%
Floater +7.87% +6.68%
OpRet +1.07% +2.13%
SplitShare -0.83% +1.43%
Interest +1.07%**** +2.13%****
PerpetualPremium +0.56% +0.96%
PerpetualDiscount +1.14% +0.81%
FixedReset +1.37% +3.26%
* The last member of the RatchetRate index was transferred to Scraps at the February, 2009, rebalancing; subsequent performance figures are set equal to the Floater index
**** The last member of the InterestBearing index was transferred to Scraps at the June, 2009, rebalancing; subsequent performance figures are set equal to the OperatingRetractible index
Passive Funds (see below for calculations)
CPD +1.98% +2.90%
DPS.UN +1.78% +2.34%
Index
BMO-CM 50 +1.97% +2.46%

The charts have a calmer look to them this month, now that the apocalyptic months of October and November 2008 have been removed from the trailing 12-months, together with the enormous rally of December 2008.

The pre-tax interest equivalent spread of PerpetualDiscounts over Long Corporates (which I also refer to as the Seniority Spread) closed the year at 220bp, a slight tightening from the 225bp at November month-end.

Meanwhile, Floaters continued their wild ride.


Click for big


Click for big


Click for big

Volume may be under-reported due to the influence of Alternative Trading Systems (as discussed in the November PrefLetter), but I am biding my time before incorporating ATS volumes into the calculations, to see if the effect is transient or not. The average volume of FixedResets continues to decline, which may be due to a number of factors:

  • The calculation is an exponential moving average with dampening applied to spikes. While this procedure has worked very well in the past (it is used to estimate the maximum size of potential trades when performing simulations) there are no guarantees that it works well this particular time
  • There hasn’t been much issuance of investment-grade FixedResets recently, which will decrease the liquidity of the whole group, both for technical and real reasons
  • The issues are becoming seasoned, as the shares gradually find their way into the accounts of buy-and-hold investors

As usual, I will make no predictions of how long the calculated current trend will continue or what liquidity might be like next year!

Perhaps more interesting is the question of total returns on FixedResets. It will not have escaped notice that they outperformed PerpetualDiscounts for the month and quarter, but how long can that last? The median weighted average yield to worst for the asset class is a mere 3.59% … and that works out to an expected total return of about 30bp per month.

Thirty beeps per month depends on their being called at the proper time – the median weighted average duration to worst is 3.85 years, or call it four years’ term. Calls look like a virtual certainty at this time; if these issues aren’t called en masse it will almost certainly be because we’ve had another financial disaster and holders will wish they had been called. There will be many, of course, who think they might be reset rather than called while trading at a huge premium, but these guys also wear tin-foil hats and sell new issues to their clients, so those opinions can be discounted.

Thirty beeps per month for four years! There’s nothing intrinsically wrong with that yield, given that Claymore’s short-term corporate bond product, CBO, has a yield of 2.52% gross of MER 0.25% (and note that this product has positions in bank sub-debt and Innovative Tier 1 Capital in addition to, you know, short term corporate bonds), so the pre-tax interest equivalent spread after fees for FixedResets over CBO of 276bp. One can quite easily make a case that FixedResets are still cheap by those standards.

But what I’m saying is that fixed income mathematics are cruel and inexorable. Every beep of monthly return in excess of the 30bp average will be paid for by underperformance relative to that yardstick sometime before the (presumed) call – so the current levels of monthly and quarterly returns will not last forever. It is interesting to speculate just how returns will normalize … will it be a gradual process, with some months making 40bp and others making 20bp? Or will the correction occur in one big fat lump when the first one gets called? Stay tuned!

Compositions of the passive funds were discussed in the September edition of PrefLetter.

Alas and alack! Claymore cannot be bothered to publish NAVs on New Year’s Eve, so I’ll have to update this post with passive fund returns when the information is available.

Update, 2010-01-11: Claymore has published NAV and distribution data (problems with the page in IE8 can be kludged by using compatibility view) for its exchange traded fund (CPD) and I have derived the following table:

CPD Return, 1- & 3-month, to October 30, 2009
Date NAV Distribution Return for Sub-Period Monthly Return
September 30 16.62      
October 30 16.41     -1.26%
November 30, 2009 16.77     +2.19%
December 24 16.76 0.21 +1.19% +1.98%
December 31 16.89 0.00 +0.78%
Quarterly Return +2.90%

Claymore currently holds $373,729,364 (advisor & common combined) in CPD assets, up $23-million on the month and a stunning increase from the $84,005,161 reported in the Dec 31/08 Annual Report

The DPS.UN NAV for December 30 has been published so we may calculate the approximate December returns.

DPS.UN NAV Return, December-ish 2009
Date NAV Distribution Return for sub-period Return for period
December 2, 2009 19.94      
December 29, 2009 19.84**** 0.30 +1.00% 1.35%
December 30, 2009 19.91   +0.35%
Estimated December Beginning Stub +0.06% **
Estimated December Ending Stub +0.36% *
Estimated December Return +1.78% ***
*CPD had a NAVPU of 16.89 on December 31 and 16.83 on December 30, hence the total return for the period for CPD was +0.36%. The return for DPS.UN in this period is presumed to be equal.
**CPD had a NAVPU of 16.77 on November 30 and 16.78 on December 2, hence the total return for the period for CPD was +0.06%. The return for DPS.UN in this period is presumed to be equal.
*** The estimated December return for DPS.UN’s NAV is therefore the product of three period returns, +0.06%, +1.35% and +0.36% to arrive at an estimate for the calendar month of +1.78%
**** CPD was had a NAV of 16.83 on 12/30 and NAV 16.77 on 12.29. Therefore, the return for the day was +0.36%. Since the NAV of DPS.UN was 19.91 on 12/30, we may estimate the NAV of DPS.UN as 19.84 on 12/29.

Now, to see the DPS.UN quarterly NAV approximate return, we refer to the calculations for November and October:

DPS.UN NAV Returns, three-month-ish to end-December-ish, 2009
October-ish -2.46%
November-ish +3.09%
December-ish +1.78%
Three-months-ish +2.34%

Best & Worst Performers: December 2009

Friday, January 1st, 2010

These are total returns, with dividends presumed to have been reinvested at the bid price on the ex-date. The list has been restricted to issues in the HIMIPref™ indices.

December 2009
Issue Index DBRS Rating Monthly Performance Notes (“Now” means “December 30”)
GWO.PR.I PerpetualDiscount Pfd-1(low) -2.75% The second-best performer in November, so this is just a bounce-back. Now with a pre-tax bid-YTW of 5.98% based on a bid of 18.96 and a limitMaturity.
BNA.PR.C SplitShare Pfd-2(low) -2.38% Now with a pre-tax bid-YTW of 8.34% based on a bid of 18.90 and a hardMaturity 2019-1-10 at 25.00.
CIU.PR.A PerpetualDiscount Pfd-2(high) -2.33% Now with a pre-tax bid-YTW of 5.92% based on a bid of 19.69 and a limitMaturity.
CU.PR.B PerpetualPremium Pfd-2(high) -1.44% Now with a pre-tax bid-YTW of 5.74% based on a bid of 17.69 and a call 2012-7-1 at 25.00.
ELF.PR.F PerpetualDiscount Pfd-2(low) -1.44% Now with a pre-tax bid-YTW of 6.78% based on a bid of 19.63 and a limitMaturity.
TD.PR.O PerpetualDiscount Pfd-1(low) +5.50% Now with a pre-tax bid-YTW of 5.35% based on a bid of 23.01 and a limitMaturity.
BAM.PR.K Floater Pfd-2(low) +6.30%  
BAM.PR.G FixFloat Pfd-2(low) +6.35% Also the third-best performer in November, so it’s really on a tear!
BAM.PR.B Floater Pfd-2(low) +7.06%  
TRI.PR.B Floater Pfd-2(low) +9.46%