Performance of the HIMIPref™ Indices for December, 2009, was:
| Total Return | ||
| Index | Performance December 2009 |
Three Months to December 31, 2009 |
| Ratchet | +7.87%* | +6.68%* |
| FixFloat | +8.35% | +2.96% |
| Floater | +7.87% | +6.68% |
| OpRet | +1.07% | +2.13% |
| SplitShare | -0.83% | +1.43% |
| Interest | +1.07%**** | +2.13%**** |
| PerpetualPremium | +0.56% | +0.96% |
| PerpetualDiscount | +1.14% | +0.81% |
| FixedReset | +1.37% | +3.26% |
| * The last member of the RatchetRate index was transferred to Scraps at the February, 2009, rebalancing; subsequent performance figures are set equal to the Floater index | ||
| **** The last member of the InterestBearing index was transferred to Scraps at the June, 2009, rebalancing; subsequent performance figures are set equal to the OperatingRetractible index | ||
| Passive Funds (see below for calculations) | ||
| CPD | +1.98% | +2.90% |
| DPS.UN | +1.78% | +2.34% |
| Index | ||
| BMO-CM 50 | +1.97% | +2.46% |
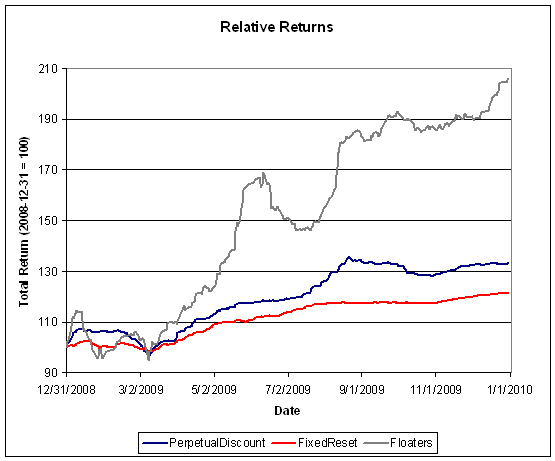
The charts have a calmer look to them this month, now that the apocalyptic months of October and November 2008 have been removed from the trailing 12-months, together with the enormous rally of December 2008.
The pre-tax interest equivalent spread of PerpetualDiscounts over Long Corporates (which I also refer to as the Seniority Spread) closed the year at 220bp, a slight tightening from the 225bp at November month-end.
Meanwhile, Floaters continued their wild ride.
Click for big
Click for big
Click for big
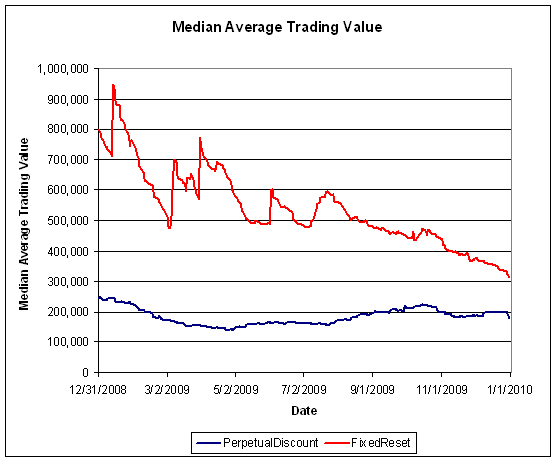
Volume may be under-reported due to the influence of Alternative Trading Systems (as discussed in the November PrefLetter), but I am biding my time before incorporating ATS volumes into the calculations, to see if the effect is transient or not. The average volume of FixedResets continues to decline, which may be due to a number of factors:
- The calculation is an exponential moving average with dampening applied to spikes. While this procedure has worked very well in the past (it is used to estimate the maximum size of potential trades when performing simulations) there are no guarantees that it works well this particular time
- There hasn’t been much issuance of investment-grade FixedResets recently, which will decrease the liquidity of the whole group, both for technical and real reasons
- The issues are becoming seasoned, as the shares gradually find their way into the accounts of buy-and-hold investors
As usual, I will make no predictions of how long the calculated current trend will continue or what liquidity might be like next year!
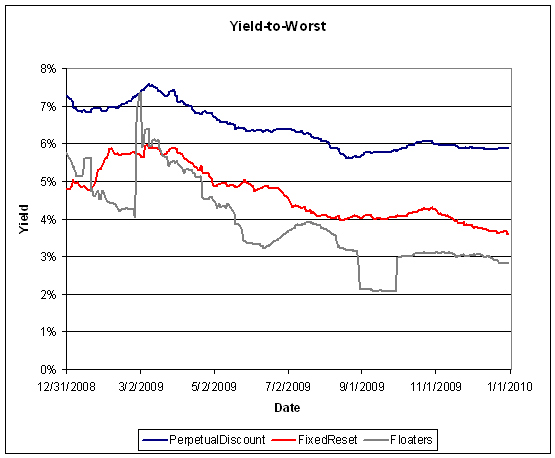
Perhaps more interesting is the question of total returns on FixedResets. It will not have escaped notice that they outperformed PerpetualDiscounts for the month and quarter, but how long can that last? The median weighted average yield to worst for the asset class is a mere 3.59% … and that works out to an expected total return of about 30bp per month.
Thirty beeps per month depends on their being called at the proper time – the median weighted average duration to worst is 3.85 years, or call it four years’ term. Calls look like a virtual certainty at this time; if these issues aren’t called en masse it will almost certainly be because we’ve had another financial disaster and holders will wish they had been called. There will be many, of course, who think they might be reset rather than called while trading at a huge premium, but these guys also wear tin-foil hats and sell new issues to their clients, so those opinions can be discounted.
Thirty beeps per month for four years! There’s nothing intrinsically wrong with that yield, given that Claymore’s short-term corporate bond product, CBO, has a yield of 2.52% gross of MER 0.25% (and note that this product has positions in bank sub-debt and Innovative Tier 1 Capital in addition to, you know, short term corporate bonds), so the pre-tax interest equivalent spread after fees for FixedResets over CBO of 276bp. One can quite easily make a case that FixedResets are still cheap by those standards.
But what I’m saying is that fixed income mathematics are cruel and inexorable. Every beep of monthly return in excess of the 30bp average will be paid for by underperformance relative to that yardstick sometime before the (presumed) call – so the current levels of monthly and quarterly returns will not last forever. It is interesting to speculate just how returns will normalize … will it be a gradual process, with some months making 40bp and others making 20bp? Or will the correction occur in one big fat lump when the first one gets called? Stay tuned!
Compositions of the passive funds were discussed in the September edition of PrefLetter.
Alas and alack! Claymore cannot be bothered to publish NAVs on New Year’s Eve, so I’ll have to update this post with passive fund returns when the information is available.
Update, 2010-01-11: Claymore has published NAV and distribution data (problems with the page in IE8 can be kludged by using compatibility view) for its exchange traded fund (CPD) and I have derived the following table:
| CPD Return, 1- & 3-month, to October 30, 2009 | ||||
| Date | NAV | Distribution | Return for Sub-Period | Monthly Return |
| September 30 | 16.62 | |||
| October 30 | 16.41 | -1.26% | ||
| November 30, 2009 | 16.77 | +2.19% | ||
| December 24 | 16.76 | 0.21 | +1.19% | +1.98% |
| December 31 | 16.89 | 0.00 | +0.78% | |
| Quarterly Return | +2.90% | |||
Claymore currently holds $373,729,364 (advisor & common combined) in CPD assets, up $23-million on the month and a stunning increase from the $84,005,161 reported in the Dec 31/08 Annual Report
The DPS.UN NAV for December 30 has been published so we may calculate the approximate December returns.
| DPS.UN NAV Return, December-ish 2009 | ||||
| Date | NAV | Distribution | Return for sub-period | Return for period |
| December 2, 2009 | 19.94 | |||
| December 29, 2009 | 19.84**** | 0.30 | +1.00% | 1.35% |
| December 30, 2009 | 19.91 | +0.35% | ||
| Estimated December Beginning Stub | +0.06% ** | |||
| Estimated December Ending Stub | +0.36% * | |||
| Estimated December Return | +1.78% *** | |||
| *CPD had a NAVPU of 16.89 on December 31 and 16.83 on December 30, hence the total return for the period for CPD was +0.36%. The return for DPS.UN in this period is presumed to be equal. | ||||
| **CPD had a NAVPU of 16.77 on November 30 and 16.78 on December 2, hence the total return for the period for CPD was +0.06%. The return for DPS.UN in this period is presumed to be equal. | ||||
| *** The estimated December return for DPS.UN’s NAV is therefore the product of three period returns, +0.06%, +1.35% and +0.36% to arrive at an estimate for the calendar month of +1.78% | ||||
| **** CPD was had a NAV of 16.83 on 12/30 and NAV 16.77 on 12.29. Therefore, the return for the day was +0.36%. Since the NAV of DPS.UN was 19.91 on 12/30, we may estimate the NAV of DPS.UN as 19.84 on 12/29. | ||||
Now, to see the DPS.UN quarterly NAV approximate return, we refer to the calculations for November and October:
| DPS.UN NAV Returns, three-month-ish to end-December-ish, 2009 | |
| October-ish | -2.46% |
| November-ish | +3.09% |
| December-ish | +1.78% |
| Three-months-ish | +2.34% |
[…] but probably underperformed CPD which has a much higher weighting the Floating Rate issues which performed very well this month. MAPF’s performance increment over the PerpetualDiscount and FixedReset sectors (in which it […]
[…] discussed last month, the impressive returns of the past year cannot continue indefinately. The long term return on a […]
[…] discussed in January, the impressive returns of the past year cannot continue indefinately. The long term return on a […]