Archive for March, 2010

March 3, 2010

Wednesday, March 3rd, 2010

Faced with criticism of their conduct and market disdain for their chances going forward, European politicians are taking decisive action – prohibit criticism!

The European Commission said yesterday it will investigate trades in sovereign credit-default swaps in the wake of the Greek crisis, which has pushed the euro lower and prompted officials to warn hedge funds they shouldn’t try to profit from the woes of the region’s nations.

… with further details:

Banks and regulators across Europe were summoned by the European Commission to discuss regulation of the market for sovereign credit-default swaps in the wake of the Greek debt crisis.

The European Union’s executive agency will hold a meeting in Brussels “shortly,” Chantal Hughes, a commission spokeswoman, said in an e-mailed statement today. The talks, which will take place as soon as March 5, will cover CDS pricing and links to the sovereign bond market, according to three people familiar with the discussions.

Remember the little boy who shouted that the Emperor had no clothes? The soldiers slaughtered him, his family, and anybody who heard the treacherous remark. Later, the Emperor’s wardrobe expenses caused taxes to rise so high that a famine resulted and the Empire collapsed. But that’s show-biz.

There’s more jostling in the Brookfield / General Growth deal, with Ackman’s role being criticized:

General Growth Properties Inc’s unsecured creditors and suitor Simon Property Group on Tuesday criticized William Ackman’s role in the mall owner’s restructuring plan, alleging conflicts of interest given his position as a director and largest shareholder.

Ackman has backed a reorganization plan that calls for his Pershing Square Capital Management hedge fund to offer Brookfield Asset Management certain protections in return for the Canadian firm financing General Growth’s stand-alone exit from bankruptcy.

The official committee of General Growth’s unsecured creditors said in a court filing that the agreement between Pershing Square and Brookfield effectively restricts General Growth from considering alternative transactions because it puts the company into “an obvious conflict of interest situation.”

“The Debtors must choose between the best interests of the estates and the economic interests of one of their most active and vocal directors,” it added, referring to Ackman.

Simon, a General Growth creditor, also questioned the arrangement between Brookfield and Ackman’s Pershing Square in a separate filing Tuesday.

RBC CEO Gord Nixon spoke at the annual meeting:

“Political rhetoric is distorting the cause of this recent crisis and potentially distorting the cure,” he told shareholders at the bank’s annual meeting in Toronto Wednesday. “This crisis was not caused by Wall Street, executive compensation, nor proprietary trading, although they all played a part. The root cause of the crisis was the failure of the U.S. residential mortgage market,” he said, adding that “the basic requirement to qualify for a large mortgage in the United States was a pulse.”

I would say ‘triggered’ rather than ’caused’. The recession is bringing to light a lot of bad practices: General Motors, Chrysler, Greece …

“The bulk of the losses during the crisis arguably resulted from lending practices and excessive concentration related, primarily, to U.S. residential real estate and over-extended consumers, not those activities addressed by the proposed reforms,” he said.

Glad to hear someone talking about concentration. Bad investments can hurt you, but over-concentration can kill you … as, for instance, many Canadian ABCP players found out. He says Basel III is fraying ’round the edges:

“While a few months ago it appeared as if there was a high degree of co-operation among the Financial Stability Board countries, we are now experiencing a divide with different countries trying to initiate rules that best suit their jurisdictions,” he said. “The unified response that was necessary and commendable during the darkest days of the crisis now risks being replaced by regulatory and legislative one-upmanship, as various governments pursue local agendas.”

And, while he said he agrees that it’s important for banks to be conservatively capitalized, he said that “the current Basel III proposals, as they’re referred to, are so complex and onerous that we run the risk of no agreement being reached.”

I was quoted in the Advisor.ca budget wish-list:

James Hymas, president, Hymas Investment Management Inc.

• A clear-cut plan for a balanced budget through the cycle.
• I want to see statements of planned spending cuts and tax increases that will not just eliminate the deficit (a childish half-measure), but ensure – insofar as such things can be ensured – that surpluses built up in relatively good times will pay for this recession and put us in a good position to cope with the next one.

Volume dropped to more normal levels on a steady day in the Canadian preferred share market, with PerpetualDiscounts gaining 5bp and FixedResets gaining 9bp … taking the YTW on the latter class down to 3.52%.

PerpetualDiscounts now yield 5.89%, equivalent to 8.25% interest at the standard equivalency factor of 1.4x. Long Corporates are now yielding about 5.8%, so the pre-tax interest-equivalent spread (also called the Seniority Spread) now stands at 245bp, a sharp, bond-driven widening from the 235bp recorded at month-end.

HIMIPref™ Preferred Indices
These values reflect the December 2008 revision of the HIMIPref™ Indices

Values are provisional and are finalized monthly
Index Mean
Current
Yield
(at bid)
Median
YTW
Median
Average
Trading
Value
Median
Mod Dur
(YTW)
Issues Day’s Perf. Index Value
Ratchet 2.77 % 2.92 % 40,679 20.50 1 -0.4876 % 1,997.0
FixedFloater 5.34 % 3.45 % 40,599 19.64 1 -1.2136 % 2,958.5
Floater 1.92 % 1.65 % 49,074 23.45 4 0.6990 % 2,396.7
OpRet 4.88 % 1.59 % 102,078 0.24 13 -0.0089 % 2,310.8
SplitShare 6.39 % 6.53 % 129,500 3.72 2 0.3985 % 2,134.3
Interest-Bearing 0.00 % 0.00 % 0 0.00 0 -0.0089 % 2,113.0
Perpetual-Premium 5.87 % 5.81 % 132,078 6.90 7 -0.0791 % 1,895.9
Perpetual-Discount 5.86 % 5.89 % 180,302 14.05 70 0.0514 % 1,802.9
FixedReset 5.40 % 3.52 % 320,307 3.73 42 0.0898 % 2,193.4
Performance Highlights
Issue Index Change Notes
BAM.PR.G FixedFloater -1.21 % YTW SCENARIO
Maturity Type : Limit Maturity
Maturity Date : 2040-03-03
Maturity Price : 25.00
Evaluated at bid price : 20.35
Bid-YTW : 3.45 %
RY.PR.I FixedReset -1.14 % YTW SCENARIO
Maturity Type : Call
Maturity Date : 2014-03-26
Maturity Price : 25.00
Evaluated at bid price : 26.07
Bid-YTW : 3.86 %
BAM.PR.K Floater 1.10 % YTW SCENARIO
Maturity Type : Limit Maturity
Maturity Date : 2040-03-03
Maturity Price : 17.50
Evaluated at bid price : 17.50
Bid-YTW : 2.27 %
TRI.PR.B Floater 1.29 % YTW SCENARIO
Maturity Type : Limit Maturity
Maturity Date : 2040-03-03
Maturity Price : 23.25
Evaluated at bid price : 23.55
Bid-YTW : 1.65 %
BAM.PR.O OpRet 1.91 % YTW SCENARIO
Maturity Type : Option Certainty
Maturity Date : 2013-06-30
Maturity Price : 25.00
Evaluated at bid price : 26.15
Bid-YTW : 3.81 %
Volume Highlights
Issue Index Shares
Traded
Notes
SLF.PR.A Perpetual-Discount 76,680 Scotia crossed 48,700 at 19.75.
YTW SCENARIO
Maturity Type : Limit Maturity
Maturity Date : 2040-03-03
Maturity Price : 19.80
Evaluated at bid price : 19.80
Bid-YTW : 6.01 %
CM.PR.G Perpetual-Discount 67,265 RBC crossed 53,900 at 23.05.
YTW SCENARIO
Maturity Type : Limit Maturity
Maturity Date : 2040-03-03
Maturity Price : 22.94
Evaluated at bid price : 23.15
Bid-YTW : 5.90 %
BAM.PR.P FixedReset 63,090 Nesbitt crossed 50,000 at 27.20.
YTW SCENARIO
Maturity Type : Call
Maturity Date : 2014-10-30
Maturity Price : 25.00
Evaluated at bid price : 27.19
Bid-YTW : 5.19 %
BMO.PR.P FixedReset 59,828 Desjardins crossed 43,300 at 27.05.
YTW SCENARIO
Maturity Type : Call
Maturity Date : 2015-03-27
Maturity Price : 25.00
Evaluated at bid price : 27.02
Bid-YTW : 3.66 %
CM.PR.I Perpetual-Discount 50,068 YTW SCENARIO
Maturity Type : Limit Maturity
Maturity Date : 2040-03-03
Maturity Price : 20.23
Evaluated at bid price : 20.23
Bid-YTW : 5.89 %
GWO.PR.G Perpetual-Discount 34,133 YTW SCENARIO
Maturity Type : Limit Maturity
Maturity Date : 2040-03-03
Maturity Price : 21.46
Evaluated at bid price : 21.46
Bid-YTW : 6.07 %
There were 31 other index-included issues trading in excess of 10,000 shares.

MAPF Performance: February 2010

Wednesday, March 3rd, 2010

The fund underperformed in February, weighed down by its lack of holdings in the Floating Rate sector, in which performance continues to astonish.

The fund’s Net Asset Value per Unit as of the close February 26 was $10.6441.

Returns to February 26, 2010
Period MAPF Index CPD
according to
Claymore
One Month -1.09% +0.38% +%
Three Months +2.29% +2.98% +%
One Year +53.87% +27.64% +%
Two Years (annualized) +23.89% +3.21% +% *
Three Years (annualized) +16.70% +0.69%  
Four Years (annualized) +14.10% +1.63%  
Five Years (annualized) +12.37% +2.08%  
Six Years (annualized) +11.83% +2.35%  
Seven Years (annualized) +14.32% +3.39%  
Eight Years (annualized) +12.56% +3.24%  
The Index is the BMO-CM “50”
MAPF returns assume reinvestment of dividends, and are shown after expenses but before fees.
CPD Returns are for the NAV and are after all fees and expenses. CPD returns to February 26, 2010, are not yet available on the Claymore website.
* CPD does not directly report its two-year returns. The figure shown is the product of the current one-year return and the similar figure reported for February 2009.
Figures for Omega Preferred Equity (which are after all fees and expenses) for 1-, 3- and 12-months are +0.2%, +2.5% and +25.6%, respectively, according to Morningstar after all fees & expenses
Figures for Jov Leon Frazer Preferred Equity Fund Class I Units (which are after all fees and expenses) for 1-, 3- and 12-months are +0.5%, +1.3% & +18.4% respectively, according to Morningstar
Figures for AIC Preferred Income Fund (which are after all fees and expenses) for 1-, 3- and 12-months are +0.1%, +1.5% & N/A, respectively

MAPF returns assume reinvestment of dividends, and are shown after expenses but before fees. Past performance is not a guarantee of future performance. You can lose money investing in Malachite Aggressive Preferred Fund or any other fund. For more information, see the fund’s main page.

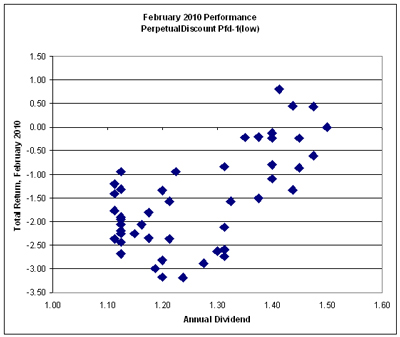
Another factor that hurt the fund’s performance in February was a decline in the implied volatility of PerpetualDiscounts. This had a large effect on performance of the different issues (though not as large as the Swoon in June), as shown in the following chart:


Click for Big

A regression calculation performed on the above data results in a slope of +5.096 +/- 0.92, with R2 = 0.39. Thus, a difference of $0.25 in annual dividend resulted in a difference of +1.27% in return for the month.

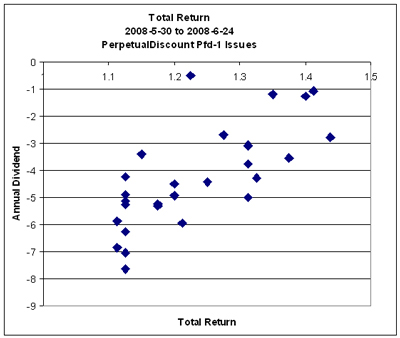
This may be compared with the Swoon in June:


Click for Big

which had a slope of +12.7 +/- 2.4 (only Pfd-1 issues, as they were defined at the time), R2 = 0.53. With such a slope, a difference in annual dividend of $0.25 resulted in a difference of 3.18% (absolute) in total return for the partial month.

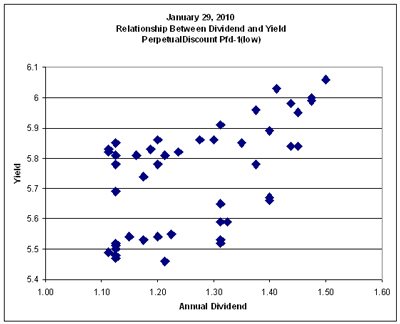
At the end of January, the relationship between annual dividend and yield was:


Click for Big

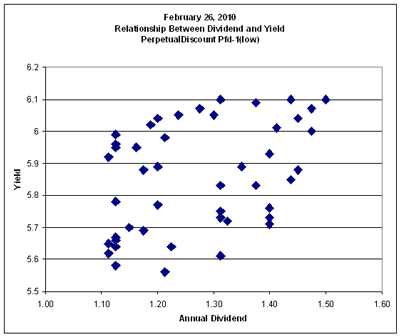
The regression line had a slope of 0.80 +/- 0.17, with R2 = 0.32. This changed during February to:


Click for Big

with a regression line slope of 0.54 +/- 0.18, R2 = 0.17.

Too bad, but it happens – and this shift in the market is one reason why trading volume was down in February. The fund is well positioned for a reversal in this relationship.

I am very pleased with the returns over the past year, but implore Assiduous Readers not to project this level of outperformance for the indefinite future. The year in the preferred share market was filled with episodes of panic and euphoria, together with many new entrants who do not appear to know what they are doing; perfect conditions for a disciplined quantitative approach.

Sometimes everything works … sometimes the trading works, but sectoral shifts overwhelm the increment … sometimes nothing works. The fund seeks to earn incremental return by selling liquidity (that is, taking the other side of trades that other market participants are strongly motivated to execute), which can also be referred to as ‘trading noise’. There have been a lot of strongly motivated market participants in the past year, generating a lot of noise! The conditions of the past year may never be repeated in my lifetime … but the fund will simply attempt to make trades when swaps seem profitable, whether that implies monthly turnover of 10% or 100%.

There’s plenty of room for new money left in the fund. Just don’t expect the current level of outperformance every year, OK? While I will continue to exert utmost efforts to outperform, it should be borne in mind that beating the index by 500bp represents a good year, and there will almost inevitably be periods of underperformance in the future.

The yields available on high quality preferred shares remain elevated, which is reflected in the current estimate of sustainable income.

Calculation of MAPF Sustainable Income Per Unit
Month NAVPU Portfolio
Average
YTW
Leverage
Divisor
Securities
Average
YTW
Capital
Gains
Multiplier
Sustainable
Income
per
current
Unit
June, 2007 9.3114 5.16% 1.03 5.01% 1.1883 0.3926
September 9.1489 5.35% 0.98 5.46% 1.1883 0.4203
December, 2007 9.0070 5.53% 0.942 5.87% 1.1883 0.4448
March, 2008 8.8512 6.17% 1.047 5.89% 1.1883 0.4389
June 8.3419 6.034% 0.952 6.338% 1.1883 $0.4449
September 8.1886 7.108% 0.969 7.335% 1.1883 $0.5054
December, 2008 8.0464 9.24% 1.008 9.166% 1.1883 $0.6206
March 2009 $8.8317 8.60% 0.995 8.802% 1.1883 $0.6423
June 10.9846 7.05% 0.999 7.057% 1.1883 $0.6524
September 12.3462 6.03% 0.998 6.042% 1.1883 $0.6278
December 2009 10.5662 5.74% 0.981 5.851% 1.0000 $0.6182
February 2010 10.6441 5.84% 1.000 5.840% 1.0000 $0.6216
NAVPU is shown after quarterly distributions of dividend income and annual distribution of capital gains.
Portfolio YTW includes cash (or margin borrowing), with an assumed interest rate of 0.00%
The Leverage Divisor indicates the level of cash in the account: if the portfolio is 1% in cash, the Leverage Divisor will be 0.99
Securities YTW divides “Portfolio YTW” by the “Leverage Divisor” to show the average YTW on the securities held; this assumes that the cash is invested in (or raised from) all securities held, in proportion to their holdings.
The Capital Gains Multiplier adjusts for the effects of Capital Gains Dividends. On 2009-12-31, there was a capital gains distribution of $1.989262 which is assumed for this purpose to have been reinvested at the final price of $10.5662. Thus, a holder of one unit pre-distribution would have held 1.1883 units post-distribution; the CG Multiplier reflects this to make the time-series comparable. Note that Dividend Distributions are not assumed to be reinvested.
Sustainable Income is the resultant estimate of the fund’s dividend income per current unit, before fees and expenses. Note that a “current unit” includes reinvestment of prior capital gains; a unitholder would have had the calculated sustainable income with only, say, 0.9 units in the past which, with reinvestment of capital gains, would become 1.0 current units.

As has been previously discussed, the fund has a position in the high-yielding split-share BNA.PR.C, about half of which was sold in November in a swap for the slightly lower-yielding PerpetualDiscount BAM.PR.N. . BNA.PR.C is scheduled to mature (or to be retracted) in the future, hence the sustainability of sustainable yield calculated while incorporating their contribution is somewhat suspect, as discussed in August, 2008.

Significant positions were also held in Fixed-Reset issues on February 26; all of which (with the exception of YPG.PR.D) currently have their yields calculated with the presumption that they will be called by the issuers at par at the first possible opportunity. This presents another complication in the calculation of sustainable yield.

However, if the entire portfolio except for the PerpetualDiscounts were to be sold and reinvested in these issues, the yield of the portfolio would be the 6.03% shown in the MAPF Portfolio Composition: February 2010 analysis(which is in excess of the 5.90% index yield on February 26). Given such reinvestment, the sustainable yield would be $10.6441 * 0.0603 = 0.6418 whereas similar calculations for January and December result in $0.6338 and $0.6308, respectively

Different assumptions lead to different results from the calculation, but the overall positive trend is apparent. I’m very pleased with the results! It will be noted that if there was no trading in the portfolio, one would expect the sustainable yield to be constant (before fees and expenses). The success of the fund’s trading is showing up in

  • the very good performance against the index
  • the long term increases in sustainable income per unit

As has been noted, the fund has maintained a credit quality equal to or better than the index; outperformance is due to constant exploitation of trading anomalies.

Again, there are no predictions for the future! The fund will continue to trade between issues in an attempt to exploit market gaps in liquidity, in an effort to outperform the index and keep the sustainable income per unit – however calculated! – growing.

Audited Financial Statements for 2009 and Transactions 2009 are now available and have been linked through the fund’s main page.

Index Performance: February 2010

Wednesday, March 3rd, 2010

Performance of the HIMIPref™ Indices for February, 2010, was:

Total Return
Index Performance
February 2010
Three Months
to
February 26, 2010
Ratchet +14.57%* +31.74%*
FixFloat +6.16% +15.89%
Floater +9.18% +25.54%
OpRet -0.45% -0.02%
SplitShare +0.72% +0.90%
Interest -0.45%**** -0.02%****
PerpetualPremium +0.44% +-0.02%
PerpetualDiscount -1.35% +0.84%
FixedReset +0.31% +0.96%
* The last member of the RatchetRate index was transferred to Scraps at the February, 2009, rebalancing; subsequent performance figures are set equal to the Floater index

Independent measurement was resumed when an issue qualified for inclusion (transferred from Scraps) at the February, 2010, rebalancing.

**** The last member of the InterestBearing index was transferred to Scraps at the June, 2009, rebalancing; subsequent performance figures are set equal to the OperatingRetractible index
Passive Funds (see below for calculations)
CPD +0.18% +1.90%
DPS.UN -1.61% +1.53%
Index
BMO-CM 50 +0.38% +2.99%
TXPR Total Return +0.20% +1.94%

The pre-tax interest equivalent spread of PerpetualDiscounts over Long Corporates (which I also refer to as the Seniority Spread) ended the month at +235bp, unchanged from January month-end. The decline in the PerpetualDiscount index was due to an increase in yields on long corporates from 5.8% to 5.9%, with the Seniority Spread remaining constant.

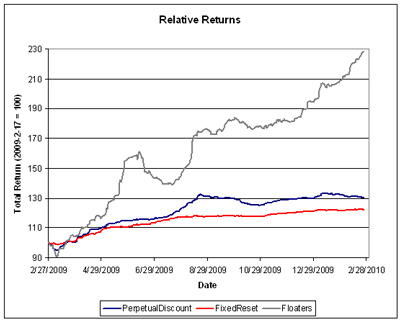
The relative returns on Floaters over the past year continues to impress:


Click for big

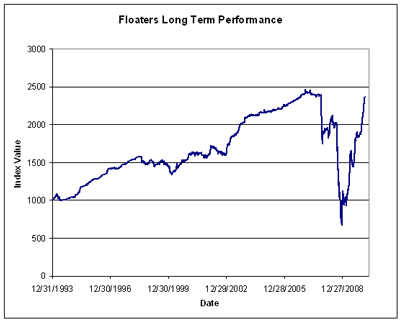
But one must remember how they got there:


Click for big

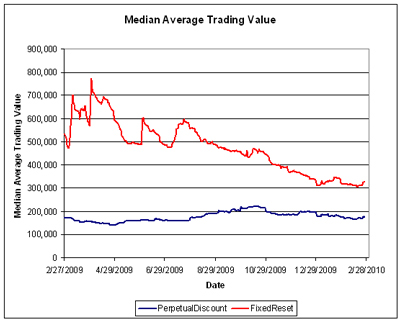
FixedReset volume seems to have found a level. Volume may be under-reported due to the influence of Alternative Trading Systems (as discussed in the November PrefLetter), but I am biding my time before incorporating ATS volumes into the calculations, to see if the effect is transient or not. The average volume of FixedResets continues to decline, which may be due to a number of factors:

  • The calculation is an exponential moving average with dampening applied to spikes. While this procedure has worked very well in the past (it is used to estimate the maximum size of potential trades when performing simulations) there are no guarantees that it works well this particular time
  • Other than a burst of issuance in January, there hasn’t been much issuance of investment-grade FixedResets recently, which will decrease the liquidity of the whole group, both for technical and real reasons
  • The issues are becoming seasoned, as the shares gradually find their way into the accounts of buy-and-hold investors

Click for big

As discussed in January, the impressive returns of the past year cannot continue indefinately. The long term return on a fixed income instrument is its yield – 5.9% for a PerpetualDiscount, and about 3.6% to the call date for a FixedReset.

Compositions of the passive funds were discussed in the September edition of PrefLetter.

Claymore has published NAV and distribution data (problems with the page in IE8 can be kludged by using compatibility view) for its exchange traded fund (CPD) and I have derived the following table:

CPD Return, 1- & 3-month, to February 26, 2010
Date NAV Distribution Return for Sub-Period Monthly Return
November 30, 2009 16.77      
December 24 16.76 0.21 +1.19% +1.98%
December 31, 2009 16.89 0.00 +0.78%
January 29 16.80     -0.53%
February 26, 2010 16.83     +0.18%
Quarterly Return +1.90%

Claymore currently holds $420,750,223 $397,666,518 (advisor & common combined) in CPD assets, up about $23-million from the $397,666,518 reported last month and up about $47-million from the $373,729,364 reported at year-end.

The DPS.UN NAV for February 24 has been published so we may calculate the approximate February returns.

DPS.UN NAV Return, February-ish 2010
Date NAV Distribution Return for sub-period Return for period
January 27, 2010 20.26      
February 24, 2010 19.91     -1.73%
Estimated January Ending Stub -0.00% **
Estimated February Ending Stub +0.12% *
Estimated February Return -1.61% ***
*CPD had a NAVPU of 16.81 on February 24 and 16.83 on February 26, hence the total return for the period for CPD was +0.12%. The return for DPS.UN in this period is presumed to be equal.
**CPD had a NAVPU of 16.80 on January 27 and 16.80 on January 29, hence the total return for the period for CPD was 0.00%. The return for DPS.UN in this period is presumed to be equal.
*** The estimated February return for DPS.UN’s NAV is therefore the product of three period returns, -1.73%, 0.00% and +0.12% to arrive at an estimate for the calendar month of -1.61%

Now, to see the DPS.UN quarterly NAV approximate return, we refer to the calculations for December and January:

DPS.UN NAV Returns, three-month-ish to end-February-ish, 2010
December-ish +1.78%
January-ish +1.39%
February-ish -1.61%
Three-months-ish +1.53%

IFRS + ACM = Trouble for Trustcos?

Wednesday, March 3rd, 2010

Assiduous Reader JP Koning brings to my attention a column by Barry Critchley in the Financial Post titled David-Goliath matchup:

The Office of the Superindendant of Financial Institutions advisory states that as of Jan. 1 2010, National Housing Act MBS’s that are securitized will move from being an off balance sheet item to a balance sheet item, a move that boost the institution’s ACM ratio. At the margin, such transfers could limit the amount of securitizations that are completed in Canada every year, securitizations that lower the cost of mortgages more than otherwise.

While market participants await an updated advisory, some small players are less than happy with what has been proposed. The Trust Companies Association of Canada, a group of 19 member firms, has written to OSFI and to the Minister of Finance and given their views on the details included in the advisory. The members, whose largest include Community Trust, Equitable Trust and Home Capital, have more than $16-billion in outstanding mortgage backed securities.

If the rules in the OSFI draft advisory do go into effect, the letter says “many trust companies and indeed other regulated financial institutions, will have no effect but to exit or significantly reduce MBS/CMB program activity as the cost of incremental capital required to meet the ACM constraint will make these activities unprofitable.”…”Unregulated companies may seek to increase their presence to fill some of the void in the supply of mortgages for the MBS/CMB program.”

I would like to read and link to the actual letter, but as far as Google and I know, the TCAC doesn’t have a web-site. Highly peculiar. However, an examination of their stationery does reveal a ‘phone number, so at least they are bravely coping with the technological advances of the 19th century.

As I have repeatedly stressed over the past two years, increased regulation will improve the competitive position of non-regulated entities; whether this involves market making and prop trading by hedge funds or, it appears, mortgage sourcing by small financial institutions.

One thing that interests me about the current situation is the economics of mortgage sourcing. The TCAC claims that incremental cost of capital will result in the activity becoming upprofitable, but will this apply to all players? If so, then logically the IFRS/ACM interaction will simply push up the price of mortgages from all regulated players. If not, then what is the difference? Gross Margins, net margins, cost of capital, or what?

One point emphasized by Mr. Critchley was:

One academic, who requested anonymity, argued that through the new rules, OSFI is effectively creating an unfair advantage for unregulated players in the mortgage market “I think the credit crisis has taught us that it’s better to have large-scale lending operations [such as residential mortgages] in line of sight of the regulators and for borrowers to have the capacity to balance sheet their production [using deposits] if capital markets become shaky.”

I’ll have to think about that one. In a crisis that involves a lock-up of the mortgage market, there’s not likely to be much balance sheet room to spare for even the best-capitalized institutions; both the Canadian and US authorities have injected money into the economy by buying securitized mortgage paper in immense blocks. Additionally, a big chunk of the credit crunch happened precisely because securitizers were balance-sheeting their production, albeit in different branches of the firms. Admittedly, they were retaining the credit risk in addition to the funding, but still the anonymous academic’s argument is unclear to me.

March 2, 2010

Wednesday, March 3rd, 2010

Nice piece in the WSJ on the Goldman/Greece thing, Swapping Blame over Athens:

Greece was not alone in using creative accounting to massage its numbers ahead of euro entry. It’s been known for years that Italy and Portugal also took advantage of derivatives contracts to dress up their budget numbers in the late 1990s. And as Allister Heath of the CityAM newspaper reminded us, even France “bought” long-term pension obligations from France Telecom in exchange for an upfront payment of £4.7 billion ($7.1 billion) that helped pave its entry into the single currency.

There’s no small irony in the fact that the same governments that once took advantage of derivatives peddled by international financiers to help conceal their true financial condition are now claiming to be the victims of the same banks’ dealings in the derivatives market. But the blame-the-bankers theme in the nascent sovereign-debt panic is of a piece with the banker-baiting that came in the wake of the 2008-2009 financial crisis.

Once again, our political class has been all too eager to find someone else to blame for its own economic mismanagement

Another WSJ article Europe’s Original Sin asks the question: What’s a Grecian Earn?:

Europeans are blaming financial transactions arranged by Wall Street for bringing Greece to the brink of needing a bailout. But a close look at the country’s finances over the nearly 10 years since it adopted the euro shows not only that Greece was the principal author of its debt problems, but also that fellow European governments repeatedly turned a blind eye to its flouting of rules.

Though the European Commission and the U.S. Federal Reserve are examining a controversial 2001 swap arranged with Goldman Sachs Group Inc., Greece’s own budget moves, in clear breach of European Union rules, dwarfed the effect of such deals.

Those revisions far exceed the impact of controversial derivative transactions Greece used to help mask the size of its debt and deficit numbers. The 2001 currency-swap deal arranged by Goldman trimmed Greece’s deficit by about a 10th of a percentage point of GDP for that year. By comparison, Greece failed to book €1.6 billion ($2.2 billion) of military expenses in 2001—10 times what was saved with the swap, according to Eurostat, the EU’s statistics authority.

Naturally, the episode is being used to promote various hobby-horses (I mean, besides Goldman-bashing):

Greece would have been dissuaded from using swaps to obscure the country’s deficit if the $605 trillion derivatives industry were properly regulated, U.S. Commodity Futures Trading Commission Chairman Gary Gensler said.

“Derivatives reform would have made it more difficult for Greece to hide their embedded loan,” Gensler said in a speech to be delivered today to Women in Housing and Finance, a Washington-based professional society.

Derivatives rules proposed in the U.S. would have required Greece to post collateral against its derivatives transactions, “thus canceling out the embedded loan and discouraging the country from entering into such a transaction in the first place,” he said. New York-based Goldman Sachs Group Inc. was at least one of the banks involved in swaps transactions with Greece.

Assiduous Readers will note that since the deal was uncollateralized, Goldman – and the ultimate buyer of the package – also bought a CDS on Greece; this is similar to their actions with uncollateralized exposure to AIG.

Australia’s hiked rates again:

Reserve Bank of Australia Governor Glenn Stevens increased the benchmark overnight cash rate target to 4 percent from 3.75 percent in Sydney today, as forecast by 14 of 19 economists surveyed by Bloomberg News. The rest predicted no change.

The biggest jobs boom in more than three years and a surge in business confidence suggest Australia’s economy is already growing at or close to trend, after escaping recession during the global crisis, Stevens said. “It’s appropriate for interest rates to be closer to average,” which he last week signaled may be another 75 basis points higher than the current rate.

PrefBlog’s Piggies-at-the-trough Department reports that cellulosic ethanol will be immensely profitable, if subsidized enough:

The industry insists the ethanol-from-waste technology will soon be commercially viable with the proper government incentives, including a some sort of price on carbon dioxide emissions that makes fossil fuels more expensive.

If the government really wanted economic ethanol, they’d fund academics with $50-million with the objective of developing something that, you know, actually works rather than forking over $500-million to the industrial smiley-boys, but Spend-Every-Penny is contemptuous of anything that smacks of schoolwork. So don’t hold your breath.

Some nice volume on a good day for the market, with PerpetualDiscounts gaining 5bp while FixedResets gained 14bp, taking yields on the latter down to 3.54%. Still a very well-behaved market, with only two entries in the Performance Highlights table.

HIMIPref™ Preferred Indices
These values reflect the December 2008 revision of the HIMIPref™ Indices

Values are provisional and are finalized monthly
Index Mean
Current
Yield
(at bid)
Median
YTW
Median
Average
Trading
Value
Median
Mod Dur
(YTW)
Issues Day’s Perf. Index Value
Ratchet 2.75 % 2.89 % 38,099 20.52 1 0.2934 % 2,006.8
FixedFloater 5.28 % 3.38 % 41,117 19.72 1 -0.7229 % 2,994.9
Floater 1.93 % 1.67 % 47,883 23.39 4 -0.0368 % 2,380.1
OpRet 4.87 % 1.57 % 105,534 0.24 13 -0.0623 % 2,311.0
SplitShare 6.42 % 6.63 % 130,399 3.72 2 -0.2870 % 2,125.8
Interest-Bearing 0.00 % 0.00 % 0 0.00 0 -0.0623 % 2,113.2
Perpetual-Premium 5.87 % 5.78 % 133,104 6.90 7 -0.0960 % 1,897.4
Perpetual-Discount 5.86 % 5.89 % 181,214 14.05 70 0.0501 % 1,802.0
FixedReset 5.41 % 3.54 % 322,771 3.73 42 0.1361 % 2,191.4
Performance Highlights
Issue Index Change Notes
TD.PR.P Perpetual-Discount -1.10 % YTW SCENARIO
Maturity Type : Limit Maturity
Maturity Date : 2040-03-02
Maturity Price : 23.21
Evaluated at bid price : 23.39
Bid-YTW : 5.67 %
HSB.PR.D Perpetual-Discount 1.10 % YTW SCENARIO
Maturity Type : Limit Maturity
Maturity Date : 2040-03-02
Maturity Price : 21.97
Evaluated at bid price : 22.10
Bid-YTW : 5.76 %
Volume Highlights
Issue Index Shares
Traded
Notes
TRP.PR.A FixedReset 123,669 Desjardins crossed 20,600 at 26.00, then another 25,000 at the same price. Nesbitt crossed 50,000 at the same price again.
YTW SCENARIO
Maturity Type : Call
Maturity Date : 2015-01-30
Maturity Price : 25.00
Evaluated at bid price : 26.00
Bid-YTW : 3.62 %
POW.PR.D Perpetual-Discount 104,973 Nesbitt crossed 25,000 at 20.80; RBC crossed blocks of 36,500 and 37,100 at the same price.
YTW SCENARIO
Maturity Type : Limit Maturity
Maturity Date : 2040-03-02
Maturity Price : 20.75
Evaluated at bid price : 20.75
Bid-YTW : 6.13 %
BNS.PR.T FixedReset 89,714 RBC crossed 25,000 at 28.00; Desjardins bought 25,000 from National at 28.03. Desjardins crossed 23,900 at 28.03.
YTW SCENARIO
Maturity Type : Call
Maturity Date : 2014-05-25
Maturity Price : 25.00
Evaluated at bid price : 28.04
Bid-YTW : 3.34 %
MFC.PR.D FixedReset 87,209 RBC crossed 25,000 at 28.05; Desjardins crossed 42,600 at 28.05.
YTW SCENARIO
Maturity Type : Call
Maturity Date : 2014-07-19
Maturity Price : 25.00
Evaluated at bid price : 28.00
Bid-YTW : 3.58 %
PWF.PR.L Perpetual-Discount 78,725 RBC crossed 72,700 at 21.45.
YTW SCENARIO
Maturity Type : Limit Maturity
Maturity Date : 2040-03-02
Maturity Price : 21.33
Evaluated at bid price : 21.33
Bid-YTW : 6.06 %
SLF.PR.F FixedReset 73,589 Nesbitt crosse 65,000 at 27.50.
YTW SCENARIO
Maturity Type : Call
Maturity Date : 2014-07-30
Maturity Price : 25.00
Evaluated at bid price : 27.50
Bid-YTW : 3.45 %
There were 45 other index-included issues trading in excess of 10,000 shares.

SXT.PR.A Partial Call for Redemption

Wednesday, March 3rd, 2010

Sixty Split Corp. has announced:

that it has called 64,750 Preferred Shares for cash redemption on March 15, 2010 (in accordance with the Company’s Articles) representing approximately 10.402% of the outstanding Preferred Shares as a result of the special annual retraction of 129,500 Capital Shares by the holders thereof.

The Preferred Shares shall be redeemed on a pro rata basis, so that each holder of Preferred Shares of record on March 12, 2010 will have approximately 10.402% of their Preferred Shares redeemed. The redemption price for the Preferred Shares will be $25.00 per share.

In addition, holders of a further 100,234 Capital Shares and 50,117 Preferred Shares have deposited such shares concurrently for retraction on March 15, 2010. As a result, a total of 229,734 Capital Shares and 114,867 Preferred Shares, or approximately 17.0784% of both classes of shares currently outstanding, will be redeemed.

Holders of Preferred Shares that are on record for dividends but have been called for redemption will be entitled to receive dividends thereon which have been declared but remain unpaid up to but not including March 15, 2010. Payment of the amount due to holders of Preferred Shares will be made by the Company on March 15, 2010. From and after March 15, 2010 the holders of Preferred Shares that have been called for redemption will not be entitled to dividends or to exercise any right in respect of such shares except to receive the amount due on redemption.

SXT.PR.A was last mentioned on PrefBlog when it was upgraded to Pfd-2 by DBRS. SXT.PR.A is tracked by HIMIPref™ but is relegated to the Scraps index on volume concerns.

BSC.PR.A to Extend Term?

Wednesday, March 3rd, 2010

BNS Split Corp. II has announced:

that its Board of Directors has retained Scotia Capital to advise the Company on a possible extension and reorganization of the Company. There is no guarantee that after such review an extension will be proposed or if proposed, will be approved by shareholders.

BNS Split Corp. II is a mutual fund corporation created to hold a portfolio of common shares of The Bank of Nova Scotia.

BSC.PR.A is scheduled to wind up in September:

The Capital Shares and the Preferred Shares may be surrendered for retraction at any time and will be redeemed by the Company on September 22, 2010 (the ‘‘Redemption Date’’).

BSC has an NAVPU of $48.31 providing Asset Coverage of 2.3+:1.

BSC.PR.A was last mentioned on PrefBlog when it was upgraded to Pfd-2(low) by DBRS. BSC.PR.A is not tracked by HIMIPref™ …. but if they extend term and maybe up the size just a little, its successor might be.

BAM Issues 7-Year Notes at 5.2%

Tuesday, March 2nd, 2010

Brookfield Asset Management has announced:

an offering of C$300 million of medium term notes (unsecured) (“notes”) with a September 2016 maturity and a yield of 5.2%.

The notes have been assigned a credit rating of Baa2 (stable outlook) by Moody’s; A- (negative outlook) by Standard & Poor’s; BBB (stable outlook) by Fitch; and A low (stable outlook) by DBRS.

The notes are being offered through a syndicate of agents led by CIBC World Markets Inc. and RBC Capital Markets.

The net proceeds of the issue will be used to refinance US$200 million of notes that matured March 1, 2010 and for general corporate purposes.

This is useful data to have when evaluating BAM.PR.J, which is retractible on 2018-3-31 (presumed to trigger a call at $25 immediatly prior to exercise) which closed last night at 26.03-05 to yield 4.94-3%, equivalent to 6.90-1% interest at the standard equivalency factor of 1.4x. The interest-equivalent spread of about 170bp will be thought by many to more than adequately compensate for the seniority risk and slightly longer term. Note, however, that I have not yet reviewed the prospectus for the new bond issue – there may be terms and conditions peculiar to these notes which affect valuation.

Update: The Globe and Mail reports there is a credit-rating-linked put:

To give investors comfort, single-A-rated Brookfield agreed to buy back this paper at 101 cents on the dollar if its credit rating drops below investment grade, or if there is a change in control at the conglomerate.

That’s valuable – but in aggregate, that type of clause can leave credit quality on a knife-edge … as AIG found out.

March 1, 2010

Monday, March 1st, 2010

AIG Chairman Harvey Golub says pay restrictions hurt the company. Bloomberg reports:

“While we can pay the vast majority of people competitively, on occasion, these restrictions and his decisions have yielded outcomes that make little business sense,” Golub, 70, said of Feinberg. “In some cases we are prevented from providing market-competitive compensation to retain some of our most experienced and best executives. This hurts the business and makes it harder to repay the taxpayers.”

Feinberg, the Obama administration’s special master on executive pay, has instituted a $500,000 base salary cap for most AIG employees. He has made exceptions for those deemed necessary for the insurer’s success, including Chief Executive Officer Robert Benmosche, who secured a $7 million salary and $3.5 million in long-term incentive awards.

Is it true or is he just pointing a finger? Well, we’ll never know, will we? That’s the trouble with dotted-line responsibility.

The Greece/Goldman/Eurostat kerfuffle is getting funnier by the minute:

Goldman Sachs did consult European statistics agency Eurostat on currency swaps traded with the Greek government, which allowed the sovereign to reduce the size of its reported debt, Gerald Corrigan, a managing director and chairman of Goldman Sachs Bank USA, told a House of Commons Treasury Select Committee hearing this afternoon. It is the first public comment to come out of a Goldman official since the currency swaps controversy reignited two weeks ago, and directly contradicts Eurostat’s claim the agency had no knowledge of the trade.

Eurostat, however, has denied knowledge of the trades, saying it was alerted only when the story hit the headlines two weeks ago. “Greek authorities have not informed Eurostat about this kind of swap operation. It is only recently that Eurostat has heard from the press about this individual operation. Eurostat has requested information from the Greek authorities and will only give further comment on the issue when it has received the information,” said a Eurostat spokesperson.

Note that the lawyers have carefully worded Eurostat’s hairsplitting “Greek authorities” and “this individual operation”.

But does it matter? They were encouraging this type of deal!

Before 2002, deals of this kind occupied a grey area in European accounting rules, according to a 2001 report written for the US Council on Foreign Relations and the International Securities Market Association by Italian academic Gustavo Piga. In his report, Piga noted the inability of European authorities to decide whether the deals were permissible or not, and called for “a firm national accounting framework to deal with these window-dressing transactions” – citing as an example a swap put in place on a 1995-vintage three-year bond by the Italian government in 1996. In May 2002, the publication of ESA95 accounting rules answered Piga’s concern by explicitly permitting the transactions and providing a worked example of how to calculate the apparent reduction in national debt – not, perhaps, the reaction Piga had expected.

But, as Felix Salmon points out:

This is a failure of European transparency and coordination; Goldman is a scapegoat.

Of course, getting cash up front is hardly limited to European governments. US municipalities also liked the idea of cash upfront:

JPMorgan lured municipalities into derivative deals by offering upfront cash payments in exchange for a pledge by the local government to agree to enter interest-rate swaps with the bank at a future date.

In these deals, which were rarely put out for public competitive bidding, the bank said its clients would come out ahead if interest rates increased in the future.

JPMorgan and competitors routinely didn’t disclose their fees for these contracts, public records show. In some cases, the bank made more money than it paid out. In Erie, Pennsylvania, JPMorgan gave the school district $755,000 upfront and collected $1.2 million in fees.

The bank was able to lock in its income by selling a mirror-image swap contract on the open market for the higher amount. The transactions involved derivatives, which are unregulated contracts tied to the value of securities, indexes or interest rates.

The deals JPMorgan arranged used floating-rate bonds and interest-rate swaps. The swaps required a municipality and the bank to exchange payments as frequently as every month. The amounts that changed hands were based on various global lending rates.

One of the great joys of investing in US Treasuries is the occasional spike in demand for specific short-term issues due to municipal defeasance – which generally happens during a period of declining rates. That game isn’t being played much this time ’round:

Brill, 47, is caught in an unintended consequence of the Federal Reserve chairman holding overnight rates near zero to ease the worst recession since the 1930s. The city, facing a $212 million budget deficit for the current fiscal year, could sell tax-exempt obligations yielding less than 4 percent to retire 5 percent debt sold seven years ago. To do so, Brill would first have to park the proceeds of the new bonds in an escrow account investing in U.S. government securities that under Bernanke pay as little as 0.53 percent.

Local governments and other borrowers in the municipal market sold a record $378 billion of tax-exempt bonds in 2009, when yields fell to the lowest in at least 40 years. At the same time, so-called advance refundings of existing notes shrank to $48.1 billion in 2009 and $28.9 billion the year before, from $82.4 billion in 2003 when municipal yields were at a then-record low, though Treasury yields were higher than today, according to data compiled by Bloomberg.

If Los Angeles were to advance refund $151.7 million of 5 percent bonds sold in 2003, new debt would be invested in the low-yielding Treasuries until the 5 percent issues are eligible for repayment on Sept. 1 of 2011, 2012 and 2013, according to bond documents.

While Brill estimates the city could sell new bonds at less than 4 percent, that cost would be higher than the rates of 0.53 percent to 1.62 percent the Treasury pays on special securities with maturities matching the earliest dates the 5 percent issues can be repaid.

The Bloomberg article quoted discusses SLGSs, but any Treasury obligation will do.

Moderate volume today, as PerpetualDiscounts fell 4bp while FixedResets gained 19bp. A very well-behaved market with only one entry in the performance highlights.

HIMIPref™ Preferred Indices
These values reflect the December 2008 revision of the HIMIPref™ Indices

Values are provisional and are finalized monthly
Index Mean
Current
Yield
(at bid)
Median
YTW
Median
Average
Trading
Value
Median
Mod Dur
(YTW)
Issues Day’s Perf. Index Value
Ratchet 2.76 % 2.91 % 36,753 20.51 1 0.7389 % 2,000.9
FixedFloater 5.24 % 3.35 % 41,453 19.77 1 1.1702 % 3,016.7
Floater 1.93 % 1.68 % 48,306 23.36 4 0.6913 % 2,380.9
OpRet 4.87 % 1.38 % 106,876 0.24 13 0.1675 % 2,312.4
SplitShare 6.40 % 6.42 % 130,620 3.73 2 -0.1543 % 2,131.9
Interest-Bearing 0.00 % 0.00 % 0 0.00 0 0.1675 % 2,114.5
Perpetual-Premium 5.86 % 5.75 % 135,166 6.91 7 0.1527 % 1,899.2
Perpetual-Discount 5.86 % 5.90 % 173,953 14.04 70 -0.0408 % 1,801.1
FixedReset 5.41 % 3.56 % 324,444 3.73 42 0.1945 % 2,188.5
Performance Highlights
Issue Index Change Notes
BAM.PR.G FixedFloater 1.17 % YTW SCENARIO
Maturity Type : Limit Maturity
Maturity Date : 2040-03-01
Maturity Price : 25.00
Evaluated at bid price : 20.75
Bid-YTW : 3.35 %
Volume Highlights
Issue Index Shares
Traded
Notes
IAG.PR.F Perpetual-Discount 53,110 Recent new issue.
YTW SCENARIO
Maturity Type : Limit Maturity
Maturity Date : 2040-03-01
Maturity Price : 24.41
Evaluated at bid price : 24.62
Bid-YTW : 6.03 %
TRP.PR.A FixedReset 41,946 YTW SCENARIO
Maturity Type : Call
Maturity Date : 2015-01-30
Maturity Price : 25.00
Evaluated at bid price : 26.00
Bid-YTW : 3.62 %
RY.PR.T FixedReset 40,500 TD crossed 40,000 at 27.88.
YTW SCENARIO
Maturity Type : Call
Maturity Date : 2014-09-23
Maturity Price : 25.00
Evaluated at bid price : 27.89
Bid-YTW : 3.55 %
CM.PR.I Perpetual-Discount 33,563 RBC crossed 12,700 at 20.15.
YTW SCENARIO
Maturity Type : Limit Maturity
Maturity Date : 2040-03-01
Maturity Price : 20.14
Evaluated at bid price : 20.14
Bid-YTW : 5.91 %
SLF.PR.A Perpetual-Discount 33,267 TD crossed 25,000 at 19.75.
YTW SCENARIO
Maturity Type : Limit Maturity
Maturity Date : 2040-03-01
Maturity Price : 19.75
Evaluated at bid price : 19.75
Bid-YTW : 6.02 %
BMO.PR.L Perpetual-Discount 32,637 RBC crossed 11,900 at 24.82.
YTW SCENARIO
Maturity Type : Limit Maturity
Maturity Date : 2040-03-01
Maturity Price : 24.55
Evaluated at bid price : 24.77
Bid-YTW : 5.89 %
There were 33 other index-included issues trading in excess of 10,000 shares.

MAPF Portfolio Composition: February 2010

Monday, March 1st, 2010

Turnover declined dramatically in February to about 18%. Such decline in trading happens occasionally – I remember one period of about three month’s duration during which so few trades were done I was afraid the system was broken and spent a lot of time feverishly checking the code and the results. But one of the great constants in financial markets is a demand for liquidity and the fund is ready to meet that demand at a moment’s notice.

Trades were, as ever, triggered by a desire to exploit transient mispricing in the preferred share market (which may the thought of as “selling liquidity”), rather than any particular view being taken on market direction, sectoral performance or credit anticipation.

MAPF Sectoral Analysis 2010-2-26
HIMI Indices Sector Weighting YTW ModDur
Ratchet 0% N/A N/A
FixFloat 0% N/A N/A
Floater 0% N/A N/A
OpRet 0% N/A N/A
SplitShare 4.0% (-0.2) 7.82% 7.04
Interest Rearing 0% N/A N/A
PerpetualPremium 0.0% (0) N/A N/A
PerpetualDiscount 77.5% (+0.8) 6.03% 13.88
Fixed-Reset 13.6% (-0.8) 3.75% 3.84
Scraps (OpRet) 0% (-2.4) N/A N/A
Scraps (FixedReset) 4.8% (+2.3) 7.17% 12.18
Cash 0.0% (+0.1) 0.00% 0.00
Total 100% 5.84% 12.15
Totals and changes will not add precisely due to rounding. Bracketted figures represent change from January month-end. Cash is included in totals with duration and yield both equal to zero.

The “total” reflects the un-leveraged total portfolio (i.e., cash is included in the portfolio calculations and is deemed to have a duration and yield of 0.00.). MAPF will often have relatively large cash balances, both credit and debit, to facilitate trading. Figures presented in the table have been rounded to the indicated precision.

The most significant change was a swap from YPG.PR.B to YPG.PR.D, completing the process mentioned in the January performance report. The latter issue yields less, but is cheaper relative to other FixedResets than the former is cheap to OperatingRetractibles – although, mind you, both issues are pretty cheap according to me!

Credit distribution is:

MAPF Credit Analysis 2010-2-26
DBRS Rating Weighting
Pfd-1 0 (0)
Pfd-1(low) 75.7% (0)
Pfd-2(high) 9.3% (-0.5)
Pfd-2 0 (0)
Pfd-2(low) 10.1% (+0.3)
Pfd-3(high) 4.8% (-0.1)
Cash 0.0% (+0.1)
Totals will not add precisely due to rounding. Bracketted figures represent change from January month-end.

Liquidity Distribution is:

MAPF Liquidity Analysis 2010-2-26
Average Daily Trading Weighting
<$50,000 0.0% (0)
$50,000 – $100,000 0.0% (0)
$100,000 – $200,000 24.0% (-2.6)
$200,000 – $300,000 42.7% (+11.7)
>$300,000 33.3% (-9.2)
Cash 0.0% (+0.1)
Totals will not add precisely due to rounding. Bracketted figures represent change from January month-end.

MAPF is, of course, Malachite Aggressive Preferred Fund, a “unit trust” managed by Hymas Investment Management Inc. Further information and links to performance, audited financials and subscription information are available the fund’s web page. A “unit trust” is like a regular mutual fund, but is sold by offering memorandum rather than prospectus. This is cheaper, but means subscription is restricted to “accredited investors” (as defined by the Ontario Securities Commission) and those who subscribe for $150,000+. Fund past performances are not a guarantee of future performance. You can lose money investing in MAPF or any other fund.

A similar portfolio composition analysis has been performed on the Claymore Preferred Share ETF (symbol CPD) as of August 17 and published in the September PrefLetter. When comparing CPD and MAPF:

  • MAPF credit quality is better
  • MAPF liquidity is a little better
  • MAPF Yield is higher
  • Weightings in
    • MAPF is much more exposed to PerpetualDiscounts
    • MAPF is much less exposed to Operating Retractibles
    • MAPF is more exposed to SplitShares
    • MAPF is less exposed to FixFloat / Floater / Ratchet
    • MAPF weighting in FixedResets is much lower