Archive for December, 2010

December 7, 2010

Wednesday, December 8th, 2010

The David Berry Saga keeps grinding on:

David Berry has lost another bid to toss out disciplinary action taken against him by IIROC (Investment Industry Regulators of Canada).

The Divisional Court of the Ontario Court of Justice dismissed Berry’s attempt to block an action commenced against him by market regulation services, a forerunner of IIROC. Berry had previously asked the Ontario Securities Commission to block the disciplinary action, but the OSC dismissed the matter in September 2009. That’s why Berry took the matter to Ontario’s Divisional Court, which is often the venue for appeals of administrative decisions.

A news release from IIROC says Berry’s challenge was dismissed on Nov. 26, but it refers you to the court’s written decision for more details. As of this moment, those reasons aren’t on CanLII.

It has been so long since any news on this matter that I was beginning to think it had been quietly settled! Long time Assiduous Readers will remember that David Berry was Scotia’s pref trader for several years and made them literally hundreds of millions of dollars, of which he got a percentage. Scotia’s executives then demonstrated their levels of personal integrity by putting a rather large team of accountants and lawyers on the case to dig up any picayune regulatory infractions he might have committed in order to gain negotiating power over a new contract, a process in which IIROC was pleased to participate.

The Europeans think they’ve done enough:

European finance ministers ruled out immediate aid for Portugal and Spain or an increase in the 750 billion-euro ($1 trillion) crisis fund, counting on European Central Bank bond purchases to calm debt-spooked markets.

A week after handing Ireland an 85 billion-euro lifeline, the finance chiefs voiced confidence that Spain and Portugal will tame their budget deficits and said the existing credit line is enough to defend them in an emergency.

A 22-week high in ECB bond-buying brought a respite from speculative attacks, masking divisions between the 16 euro-area governments over the next steps to fight the explosion of debt that threatens the currency.

Meanwhile, the US sold its Citigroup stake, bringing the North American situation closer to a common or garden (albeit very nasty) recession.

There is still another three weeks odd to go, but the following effort from a major bank/dealer has a lock on the covetted PrefBlog “Most Asinine Investment Advice of 2010” Award:


Click for Big

The Canadian preferred share market got hit today on very heavy volume, with PerpetualDiscounts down 17bp and FixedResets losing 21bp.

HIMIPref™ Preferred Indices
These values reflect the December 2008 revision of the HIMIPref™ Indices

Values are provisional and are finalized monthly
Index Mean
Current
Yield
(at bid)
Median
YTW
Median
Average
Trading
Value
Median
Mod Dur
(YTW)
Issues Day’s Perf. Index Value
Ratchet 0.00 % 0.00 % 0 0.00 0 -0.1493 % 2,275.4
FixedFloater 4.73 % 3.20 % 28,903 19.04 1 -0.0435 % 3,557.5
Floater 2.62 % 2.37 % 53,338 21.32 4 -0.1493 % 2,456.9
OpRet 4.80 % 3.47 % 86,735 2.38 8 -0.1822 % 2,374.6
SplitShare 5.47 % 1.20 % 118,890 1.00 3 -0.1871 % 2,459.4
Interest-Bearing 0.00 % 0.00 % 0 0.00 0 -0.1822 % 2,171.3
Perpetual-Premium 5.70 % 5.42 % 157,066 5.44 27 -0.2282 % 2,008.9
Perpetual-Discount 5.37 % 5.38 % 282,382 14.75 51 -0.1696 % 2,028.4
FixedReset 5.24 % 3.57 % 352,310 3.12 52 -0.2095 % 2,254.5
Performance Highlights
Issue Index Change Notes
IAG.PR.C FixedReset -2.50 % YTW SCENARIO
Maturity Type : Call
Maturity Date : 2014-01-30
Maturity Price : 25.00
Evaluated at bid price : 26.52
Bid-YTW : 3.98 %
BAM.PR.I OpRet -2.02 % YTW SCENARIO
Maturity Type : Call
Maturity Date : 2012-07-30
Maturity Price : 25.00
Evaluated at bid price : 25.28
Bid-YTW : 5.47 %
MFC.PR.E FixedReset -1.63 % YTW SCENARIO
Maturity Type : Call
Maturity Date : 2014-10-19
Maturity Price : 25.00
Evaluated at bid price : 26.54
Bid-YTW : 3.84 %
GWO.PR.H Perpetual-Discount -1.59 % YTW SCENARIO
Maturity Type : Limit Maturity
Maturity Date : 2040-12-07
Maturity Price : 22.75
Evaluated at bid price : 22.95
Bid-YTW : 5.28 %
FTS.PR.G FixedReset -1.54 % YTW SCENARIO
Maturity Type : Call
Maturity Date : 2013-10-01
Maturity Price : 25.00
Evaluated at bid price : 25.60
Bid-YTW : 4.33 %
GWO.PR.M Perpetual-Premium -1.23 % YTW SCENARIO
Maturity Type : Limit Maturity
Maturity Date : 2040-12-07
Maturity Price : 24.62
Evaluated at bid price : 24.84
Bid-YTW : 5.84 %
TD.PR.K FixedReset -1.19 % YTW SCENARIO
Maturity Type : Call
Maturity Date : 2014-08-30
Maturity Price : 25.00
Evaluated at bid price : 27.41
Bid-YTW : 3.69 %
MFC.PR.C Perpetual-Discount -1.08 % YTW SCENARIO
Maturity Type : Limit Maturity
Maturity Date : 2040-12-07
Maturity Price : 20.12
Evaluated at bid price : 20.12
Bid-YTW : 5.62 %
GWO.PR.I Perpetual-Discount -1.08 % YTW SCENARIO
Maturity Type : Limit Maturity
Maturity Date : 2040-12-07
Maturity Price : 21.05
Evaluated at bid price : 21.05
Bid-YTW : 5.36 %
POW.PR.D Perpetual-Discount 1.15 % YTW SCENARIO
Maturity Type : Limit Maturity
Maturity Date : 2040-12-07
Maturity Price : 23.45
Evaluated at bid price : 23.70
Bid-YTW : 5.35 %
BNS.PR.P FixedReset 1.44 % YTW SCENARIO
Maturity Type : Call
Maturity Date : 2013-05-25
Maturity Price : 25.00
Evaluated at bid price : 26.12
Bid-YTW : 3.28 %
Volume Highlights
Issue Index Shares
Traded
Notes
BMO.PR.M FixedReset 121,458 Desjardins crossed 70,300 at 26.22; TD crossed 40,000 at the same price.
YTW SCENARIO
Maturity Type : Call
Maturity Date : 2013-09-24
Maturity Price : 25.00
Evaluated at bid price : 26.21
Bid-YTW : 3.17 %
BNS.PR.T FixedReset 106,447 RBC crossed blocks of 50,000 and 47,400, both at 27.50.
YTW SCENARIO
Maturity Type : Call
Maturity Date : 2014-05-25
Maturity Price : 25.00
Evaluated at bid price : 27.40
Bid-YTW : 3.53 %
BMO.PR.P FixedReset 72,177 Nesbitt crossed 50,000 at 27.22.
YTW SCENARIO
Maturity Type : Call
Maturity Date : 2015-03-27
Maturity Price : 25.00
Evaluated at bid price : 27.23
Bid-YTW : 3.19 %
RY.PR.X FixedReset 61,218 RBC crossed blocks of 37,900 and 11,100, both at 27.50.
YTW SCENARIO
Maturity Type : Call
Maturity Date : 2014-09-23
Maturity Price : 25.00
Evaluated at bid price : 27.55
Bid-YTW : 3.48 %
CM.PR.J Perpetual-Discount 50,702 RBC crossed 35,000 at 21.99.
YTW SCENARIO
Maturity Type : Limit Maturity
Maturity Date : 2040-12-07
Maturity Price : 21.86
Evaluated at bid price : 21.97
Bid-YTW : 5.18 %
MFC.PR.A OpRet 47,800 RBC crossed 37,100 at 25.65.
YTW SCENARIO
Maturity Type : Soft Maturity
Maturity Date : 2015-12-18
Maturity Price : 25.00
Evaluated at bid price : 25.71
Bid-YTW : 3.47 %
There were 75 other index-included issues trading in excess of 10,000 shares.

December 6, 2010

Monday, December 6th, 2010

Germany is convinced that European investments are a risky proposition:

European officials voiced divisions over the steps needed to stop the sovereign debt crisis as Germany opposes increasing the 750 billion-euro ($1 trillion) bailout fund and the introduction of joint European bonds.

Belgian Finance Minister Didier Reynders told reporters on Dec. 4 that the fund might be expanded if ministers decide to introduce a larger permanent facility when the current temporary one expires, breaking ranks with German Chancellor Angela Merkel and France’s Nicolas Sarkozy. Luxembourg and Italy today called for the creation of joint European bonds, a move rebuffed by Germany Finance Minister Wolfgang Schaeuble.

Today’s meeting comes after Luxembourg Finance Minister Jean-Claude Juncker and Italian counterpart Giulio Tremonti wrote a letter to the FT calling for the introduction of a joint European government bond.

“E-Bonds” would be sold by a European Debt Agency, which could be created as early as this month and finance as much as 50 percent of the issuances by EU members to create a deep market, they said. A switch would also be offered between E- Bonds and current government bonds.

German Deputy Finance Minister Joerg Asmussen on Dec. 3 rejected such a move because it wouldn’t encourage countries to fix their finances.

It was a muted day overall on the Canadian preferred share market, with PerpetualDiscounts up 6bp and FixedResets losing 5bp. There was some decent volatility, as shown on the performance highlights, and volume remained high.

HIMIPref™ Preferred Indices
These values reflect the December 2008 revision of the HIMIPref™ Indices

Values are provisional and are finalized monthly
Index Mean
Current
Yield
(at bid)
Median
YTW
Median
Average
Trading
Value
Median
Mod Dur
(YTW)
Issues Day’s Perf. Index Value
Ratchet 0.00 % 0.00 % 0 0.00 0 0.0996 % 2,278.8
FixedFloater 4.73 % 3.20 % 28,454 19.05 1 0.0000 % 3,559.0
Floater 2.61 % 2.36 % 53,667 21.36 4 0.0996 % 2,460.5
OpRet 4.79 % 3.16 % 68,773 2.38 8 0.2163 % 2,378.9
SplitShare 5.46 % 1.39 % 119,715 1.00 3 0.1472 % 2,464.0
Interest-Bearing 0.00 % 0.00 % 0 0.00 0 0.2163 % 2,175.3
Perpetual-Premium 5.69 % 5.44 % 153,990 5.38 27 0.1252 % 2,013.5
Perpetual-Discount 5.36 % 5.38 % 284,090 14.78 51 0.0611 % 2,031.8
FixedReset 5.23 % 3.48 % 352,034 3.13 52 -0.0511 % 2,259.3
Performance Highlights
Issue Index Change Notes
GWO.PR.J FixedReset -3.35 % YTW SCENARIO
Maturity Type : Call
Maturity Date : 2014-01-30
Maturity Price : 25.00
Evaluated at bid price : 26.00
Bid-YTW : 4.47 %
BNS.PR.P FixedReset -1.60 % YTW SCENARIO
Maturity Type : Call
Maturity Date : 2013-05-25
Maturity Price : 25.00
Evaluated at bid price : 25.75
Bid-YTW : 3.90 %
RY.PR.N FixedReset -1.20 % YTW SCENARIO
Maturity Type : Call
Maturity Date : 2014-03-26
Maturity Price : 25.00
Evaluated at bid price : 27.27
Bid-YTW : 3.38 %
MFC.PR.B Perpetual-Discount 1.11 % YTW SCENARIO
Maturity Type : Limit Maturity
Maturity Date : 2040-12-06
Maturity Price : 20.88
Evaluated at bid price : 20.88
Bid-YTW : 5.59 %
MFC.PR.E FixedReset 1.16 % YTW SCENARIO
Maturity Type : Call
Maturity Date : 2014-10-19
Maturity Price : 25.00
Evaluated at bid price : 26.98
Bid-YTW : 3.36 %
BNS.PR.X FixedReset 1.22 % YTW SCENARIO
Maturity Type : Call
Maturity Date : 2014-05-25
Maturity Price : 25.00
Evaluated at bid price : 27.45
Bid-YTW : 3.49 %
BAM.PR.I OpRet 2.67 % YTW SCENARIO
Maturity Type : Call
Maturity Date : 2011-01-05
Maturity Price : 25.50
Evaluated at bid price : 25.80
Bid-YTW : 3.16 %
Volume Highlights
Issue Index Shares
Traded
Notes
RY.PR.X FixedReset 65,687 Nesbitt crossed 50,000 at 27.54.
YTW SCENARIO
Maturity Type : Call
Maturity Date : 2014-09-23
Maturity Price : 25.00
Evaluated at bid price : 27.50
Bid-YTW : 3.53 %
SLF.PR.D Perpetual-Discount 53,626 TD crossed 25,000 at 20.40.
YTW SCENARIO
Maturity Type : Limit Maturity
Maturity Date : 2040-12-06
Maturity Price : 20.35
Evaluated at bid price : 20.35
Bid-YTW : 5.48 %
BNS.PR.T FixedReset 52,678 Nesbitt crossed 50,000 at 27.50.
YTW SCENARIO
Maturity Type : Call
Maturity Date : 2014-05-25
Maturity Price : 25.00
Evaluated at bid price : 27.50
Bid-YTW : 3.41 %
CL.PR.B Perpetual-Premium 51,300 Called for redemption.
YTW SCENARIO
Maturity Type : Call
Maturity Date : 2011-01-30
Maturity Price : 25.00
Evaluated at bid price : 24.94
Bid-YTW : 5.06 %
TRP.PR.C FixedReset 46,039 YTW SCENARIO
Maturity Type : Limit Maturity
Maturity Date : 2040-12-06
Maturity Price : 25.24
Evaluated at bid price : 25.29
Bid-YTW : 3.98 %
GWO.PR.N FixedReset 45,715 Recent new issue.
YTW SCENARIO
Maturity Type : Limit Maturity
Maturity Date : 2040-12-06
Maturity Price : 24.42
Evaluated at bid price : 24.47
Bid-YTW : 3.72 %
There were 53 other index-included issues trading in excess of 10,000 shares.

BSD.PR.A: DBRS Upgrades to Pfd-4(low)

Monday, December 6th, 2010

DBRS has announced that it:

has today upgraded the Preferred Securities issued by Brookfield Soundvest Split Trust (the Trust) to Pfd-4 (low) from Pfd-5 (high).

As of September 30, 2010, the Portfolio primarily consisted of various types of income trusts. The composition of the Portfolio may change significantly in 2011 as more income trusts convert to corporations. The Portfolio provides downside protection of approximately 29% to the holders of the Preferred Securities (as of November 30, 2010).

Over the past four months, the net asset value (NAV) of the Trust has increased from $12.41 to $14.07, an increase of approximately 13%. Furthermore, the downside protection has fluctuated between 16% and 29% in 2010 to date compared with 2% to 15% from August to November 2009. This significant increase in protection has resulted in an upgrade in the rating of the Preferred Securities to Pfd-4 (low) from Pfd-5 (high). The upgrade has been limited to one notch due to the lower credit quality of the Portfolio (the majority of its holdings are not rated by any rating agency) and uncertainty related to the potential reduction in income earned on the Portfolio because of the impending taxation of Canadian income trusts.

The redemption date for the Preferred Securities is March 31, 2015.

BSD.PR.A was last mentioned on PrefBlog when an extraordinatry resolution was passed allowing the fund to invest in other instruments beside income trusts. BSD.PR.A is tracked by HIMIPref™ but is relegated to the Scraps index on credit concerns.

MAPF Performance: November 2010

Saturday, December 4th, 2010

The fund had another good month in November.

The fund’s Net Asset Value per Unit as of the close November 30 was $11.8495.

Returns to November 30, 2010
Period MAPF Index CPD
according to
Claymore
One Month +1.40% +0.65% +0.25%
Three Months +8.52% +5.16% +3.81%
One Year +18.53% +12.32% +8.71%
Two Years (annualized) +50.73% +23.15% +20.04% *
Three Years (annualized) +24.94% +6.24% +4.06%
Four Years (annualized) +16.67% +2.89%  
Five Years (annualized) +14.59% +3.19%  
Six Years (annualized) +13.18% +3.45%  
Seven Years (annualized) +13.42% +3.82%  
Eight Years (annualized) +15.44% +4.30%  
Nine Years (annualized) +13.41% +4.10%  
The Index is the BMO-CM “50”
MAPF returns assume reinvestment of dividends, and are shown after expenses but before fees.
CPD Returns are for the NAV and are after all fees and expenses.
* CPD does not directly report its two-year returns. The figure shown is the square root of product of the current one-year return and the similar figure reported for November 2009.
Figures for Omega Preferred Equity (which are after all fees and expenses) for 1-, 3- and 12-months are +0.29%, +3.83% and +10.39%, respectively, according to Morningstar after all fees & expenses. Three year performance is +5.09%.
Figures for Jov Leon Frazer Preferred Equity Fund Class I Units (which are after all fees and expenses) for 1-, 3- and 12-months are -0.10%, +2.24% & +7.27% respectively, according to Morningstar
Figures for Manulife Preferred Income Fund (formerly AIC Preferred Income Fund) (which are after all fees and expenses) for 1-, 3- and 12-months are +0.00%, +2.44% & +5.78%, respectively
Figures for Horizons AlphaPro Preferred Share ETF are not yet available (inception date 2010-11-23)

MAPF returns assume reinvestment of dividends, and are shown after expenses but before fees. Past performance is not a guarantee of future performance. You can lose money investing in Malachite Aggressive Preferred Fund or any other fund. For more information, see the fund’s main page. The fund is available either directly from Hymas Investment Management or through a brokerage account at Odlum Brown Limited.

Sometimes everything works … sometimes the trading works, but sectoral shifts overwhelm the increment … sometimes nothing works. The fund seeks to earn incremental return by selling liquidity (that is, taking the other side of trades that other market participants are strongly motivated to execute), which can also be referred to as ‘trading noise’. There were a lot of strongly motivated market participants during the Panic of 2007, generating a lot of noise! Unfortunately, the conditions of the Panic may never be repeated in my lifetime … but the fund will simply attempt to make trades when swaps seem profitable, whether that implies monthly turnover of 10% or 100%.

The fund’s returns were helped along by the overweighting in deeply discounted PerpetualDiscounts in which the fund is still overweighted (see MAPF Portfolio Composition: November 2010) although not as overweighted as it has been. While this type of issue generally outperformed, the effect is nowhere near as marked as was reported in October.


Click for Big

There’s plenty of room for new money left in the fund. I have shown in recent issues of PrefLetter that market pricing for FixedResets is demonstrably stupid and I have lots of confidence – backed up by my bond portfolio management experience in the markets for Canadas and Treasuries, and equity trading on the NYSE & TSX – that there is enough demand for liquidity in any market to make the effort of providing it worthwhile (although the definition of “worthwhile” in terms of basis points of outperformance changes considerably from market to market!) I will continue to exert utmost efforts to outperform but it should be borne in mind that there will almost inevitably be periods of underperformance in the future.

The yields available on high quality preferred shares remain elevated, which is reflected in the current estimate of sustainable income.

Calculation of MAPF Sustainable Income Per Unit
Month NAVPU Portfolio
Average
YTW
Leverage
Divisor
Securities
Average
YTW
Capital
Gains
Multiplier
Sustainable
Income
per
current
Unit
June, 2007 9.3114 5.16% 1.03 5.01% 1.1883 0.3926
September 9.1489 5.35% 0.98 5.46% 1.1883 0.4203
December, 2007 9.0070 5.53% 0.942 5.87% 1.1883 0.4448
March, 2008 8.8512 6.17% 1.047 5.89% 1.1883 0.4389
June 8.3419 6.034% 0.952 6.338% 1.1883 $0.4449
September 8.1886 7.108% 0.969 7.335% 1.1883 $0.5054
December, 2008 8.0464 9.24% 1.008 9.166% 1.1883 $0.6206
March 2009 $8.8317 8.60% 0.995 8.802% 1.1883 $0.6423
June 10.9846 7.05% 0.999 7.057% 1.1883 $0.6524
September 12.3462 6.03% 0.998 6.042% 1.1883 $0.6278
December 2009 10.5662 5.74% 0.981 5.851% 1.0000 $0.6182
March 2010 10.2497 6.03% 0.992 6.079% 1.0000 $0.6231
June 10.5770 5.96% 0.996 5.984% 1.0000 $0.6329
September 11.3901 5.43% 0.980 5.540% 1.0000 $0.6310
November 2010 11.8495 5.39% 0.998 5.401% 1.0000 $0.6400
NAVPU is shown after quarterly distributions of dividend income and annual distribution of capital gains.
Portfolio YTW includes cash (or margin borrowing), with an assumed interest rate of 0.00%
The Leverage Divisor indicates the level of cash in the account: if the portfolio is 1% in cash, the Leverage Divisor will be 0.99
Securities YTW divides “Portfolio YTW” by the “Leverage Divisor” to show the average YTW on the securities held; this assumes that the cash is invested in (or raised from) all securities held, in proportion to their holdings.
The Capital Gains Multiplier adjusts for the effects of Capital Gains Dividends. On 2009-12-31, there was a capital gains distribution of $1.989262 which is assumed for this purpose to have been reinvested at the final price of $10.5662. Thus, a holder of one unit pre-distribution would have held 1.1883 units post-distribution; the CG Multiplier reflects this to make the time-series comparable. Note that Dividend Distributions are not assumed to be reinvested.
Sustainable Income is the resultant estimate of the fund’s dividend income per current unit, before fees and expenses. Note that a “current unit” includes reinvestment of prior capital gains; a unitholder would have had the calculated sustainable income with only, say, 0.9 units in the past which, with reinvestment of capital gains, would become 1.0 current units.

Significant positions were held in Fixed-Reset issues on November 30; all of which (with the exception of the two YLO issues) currently have their yields calculated with the presumption that they will be called by the issuers at par at the first possible opportunity. This presents another complication in the calculation of sustainable yield. The fund also holds a position in a SplitShare (BNA.PR.C) which also has its yield calculated with the expectation of a maturity.

However, if the entire portfolio except for the PerpetualDiscounts were to be sold and reinvested in these issues, the yield of the portfolio would be the 5.51% shown in the MAPF Portfolio Composition: November 2010 analysis (which is in excess of the 5.41% index yield on November 30). Given such reinvestment, the sustainable yield would be $11.8495 * 0.0551 = $0.6529, a nice increase from the $0.6474 reported last month.

Note that there will be a drag on the calculation in up-markets due to presence of shorter-term issues (or, at least, presumed shorter term issues!); the question is whether the positive effect of these issues in down markets will outweight their negative effect in up-markets – all I can say is … it has in the past!

Different assumptions lead to different results from the calculation, but the overall positive trend is apparent. I’m very pleased with the results! It will be noted that if there was no trading in the portfolio, one would expect the sustainable yield to be constant (before fees and expenses). The success of the fund’s trading is showing up in

  • the very good performance against the index
  • the long term increases in sustainable income per unit

As has been noted, the fund has maintained a credit quality equal to or better than the index; outperformance is due to constant exploitation of trading anomalies.

Again, there are no predictions for the future! The fund will continue to trade between issues in an attempt to exploit market gaps in liquidity, in an effort to outperform the index and keep the sustainable income per unit – however calculated! – growing.

MAPF Portfolio Composition: November 2010

Saturday, December 4th, 2010

Turnover remained fairly constant in November, at just under 30%.

Trades were, as ever, triggered by a desire to exploit transient mispricing in the preferred share market (which may be thought of as “selling liquidity”), rather than any particular view being taken on market direction, sectoral performance or credit anticipation.

MAPF Sectoral Analysis 2010-11-30
HIMI Indices Sector Weighting YTW ModDur
Ratchet 0% N/A N/A
FixFloat 0% N/A N/A
Floater 0% N/A N/A
OpRet 0% N/A N/A
SplitShare 2.2% (+0.8) 5.97% 6.70
Interest Rearing 0% N/A N/A
PerpetualPremium 18.9% (+10.3) 5.76% 9.49
PerpetualDiscount 65.1% (-9.5) 5.51% 14.65
Fixed-Reset 10.2% (0) 3.36% 3.11
Scraps (FixedReset) 3.6% (0) 6.83% 12.58
Cash 0.2% (-1.4) 0.00% 0.00
Total 100% 5.39% 12.24
Totals and changes will not add precisely due to rounding. Bracketted figures represent change from October month-end. Cash is included in totals with duration and yield both equal to zero.

The “total” reflects the un-leveraged total portfolio (i.e., cash is included in the portfolio calculations and is deemed to have a duration and yield of 0.00.). MAPF will often have relatively large cash balances, both credit and debit, to facilitate trading. Figures presented in the table have been rounded to the indicated precision.

The increase in PerpetualPremium holdings at the expense of PerpetualDiscounts is related to a shift in credit quality from the Pfd-1(low) bucket to the Pfd-2(high) bucket and will be discussed below.

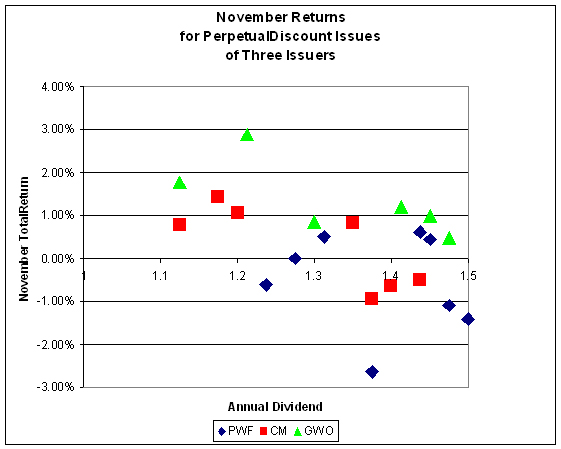
As reported in the post HIMIPref™ Index Performance, November 2010, PerpetualDiscounts significantly outperformed PerpetualPremiums over the month; unfortunately, heterogeniety of the data set does not allow us to conclude that Implied Volatility increased. In fact, for the three issuers with a sufficient sample of dividend rates, volatility was relatively constant, although it became more homogeneous between these specific issuers.

Analysis of the data using the Straight Perpetual Implied Volatility Calculator produces the following table:

Fits to Implied Volatility
Issuer 2010-10-29 2010-11-30
Yield Volatility Yield Volatility
PWF 4.40% 25% 4.45% 25%
CM 4.80% 17% 4.13% 24%
GWO 0.99% 35% 3.60% 30%
Calculations are performed with a time horizon of three years for all issues

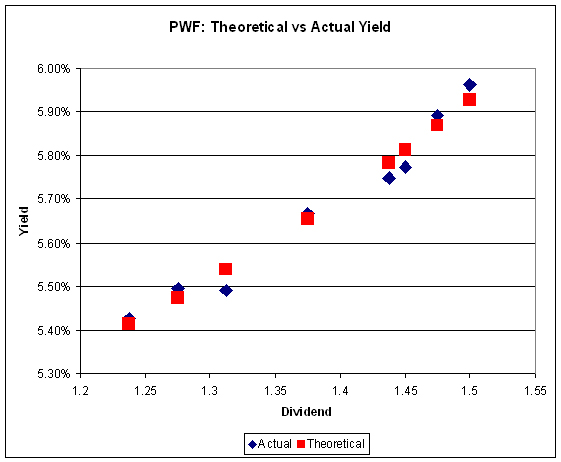
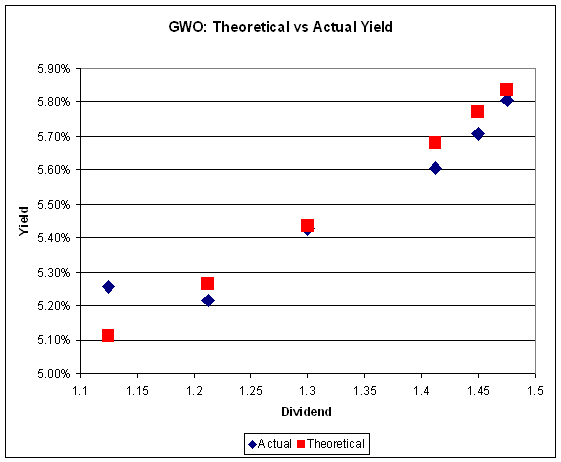
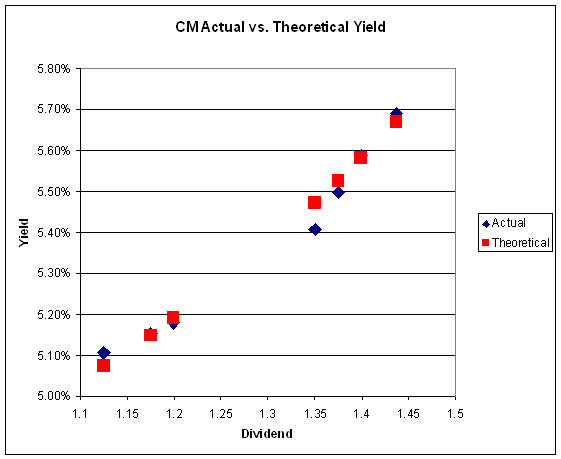
As discussed in the October edition of PrefLetter, the implied volatility calculated for GWO is very high and implies a questionable assessment of the probability distribution of future yields, but it looks like the market is finding a level for Implied Volatility in the mid- to high-twenties.

Graphs from the Straight Perpetual Volatility Calculator for November 30 are:


Click for Big


Click for Big


Click for Big

The yield pick-up for holding high-coupon Straights is such one should no longer automatically buy the deepest-discount issue in a series!

Credit distribution is:

MAPF Credit Analysis 2010-11-30
DBRS Rating Weighting
Pfd-1 0 (0)
Pfd-1(low) 54.5% (-10.1)
Pfd-2(high) 21.9% (+8.7)
Pfd-2 0 (0)
Pfd-2(low) 19.9% (+2.9)
Pfd-3(high) 3.6% (0)
Cash 0.2% (-1.4)
Totals will not add precisely due to rounding. Bracketted figures represent change from October month-end.

As noted earlier, the shift in holdings weight from Pfd-1(low) to Pfd-2(high) is related to the shift from PerpetualDiscounts to PerpetualPremiums. Most of the move is explained by the following trades:

November Swap from Low-Coupon CM to High-Coupon IAG
Date CM.PR.I CM.PR.H IAG.PR.F
10/29
Bid
22.48 22.93 25.40
11/5
Trade
Sold
22.83
Sold
23.29
Bot
25.49
11/30
Bid
22.80 23.17 25.18
Dividends     Earned
0.36875
11/24
This table represents an attempt to present fairly the net effect of a sequence of trades. Full particulars of all fund transactions will be disclosed when the fund’s audited financials are published.

Liquidity Distribution is:

MAPF Liquidity Analysis 2010-10-29
Average Daily Trading Weighting
<$50,000 0.0% (0)
$50,000 – $100,000 11.6% (-1.3)
$100,000 – $200,000 18.9% (-5.3)
$200,000 – $300,000 20.3% (+0.3)
>$300,000 49.1% (+7.2)
Cash 0.2% (-1.4)
Totals will not add precisely due to rounding. Bracketted figures represent change from October month-end.

MAPF is, of course, Malachite Aggressive Preferred Fund, a “unit trust” managed by Hymas Investment Management Inc. Further information and links to performance, audited financials and subscription information are available the fund’s web page. The fund may be purchased either directly from Hymas Investment Management or through a brokerage account at Odlum Brown Limited. A “unit trust” is like a regular mutual fund, but is sold by offering memorandum rather than prospectus. This is cheaper, but means subscription is restricted to “accredited investors” (as defined by the Ontario Securities Commission) and those who subscribe for $150,000+. Fund past performances are not a guarantee of future performance. You can lose money investing in MAPF or any other fund.

A similar portfolio composition analysis has been performed on the Claymore Preferred Share ETF (symbol CPD) as of August 31, 2010, and published in the September, 2010, PrefLetter. When comparing CPD and MAPF:

  • MAPF credit quality is better
  • MAPF liquidity is a higher
  • MAPF Yield is higher
  • Weightings in
    • MAPF is much more exposed to Straight Perpetuals
    • MAPF is much less exposed to Operating Retractibles
    • MAPF is slightly more exposed to SplitShares
    • MAPF is less exposed to FixFloat / Floater / Ratchet
    • MAPF weighting in FixedResets is much lower

December 3, 2010

Friday, December 3rd, 2010

The inherent contradictions of the brokerage business continue to cause problems:

Social media sites such as LinkedIn and Twitter are redefining the way businesses reach their customers. Securities firms are largely absent from the revolution.

The U.S. Securities and Exchange Commission, which regulates the securities industry, says all broker stock recommendations must be ‘‘suitable” for individual clients by measuring their risk tolerance, security holdings, income, net worth and investment objectives, according to the agency’s website. Tweeting a stock pick or posting it on Facebook generally breaks this rule, said David Sobel, executive vice president and compliance officer at New York-based Abel/Noser Corp., which helps clients lower trading costs and does allow its employees to use LinkedIn for networking.

Stockbrokers are salesmen; the “suitability” rule is nonsense. One step forward would be to change their registration title to “Salesman” and prohibit their use of any other title. Anybody who wants to think about “suitability” or “advice” should be a fiduciary and be required to publish their track record.

As suggested yesterday, the debt panel’s recommendations did not win enough of a supermajority:

The seven votes against the plan were enough to sink it, even though 11 of the 18 members voted in favor, because 14 were needed to forward the proposal to Congress for consideration. Five of the six senators on the panel backed the plan, as did five of the six unelected officials. Five of six House members opposed it, with the sole support coming from South Carolina Democrat John Spratt, who was defeated in the Nov. 2 election.

I continue to believe the US will not take its fiscal problems seriously until the President gets a call from the Treasury secretary asking him to play bond salesman. The Hot Air blog which, as far as I can tell, is a mouthpiece for the Republican party, claims to want to reduce the deficit but only if it’s done through spending cuts. That would be nice, folks, and it may even be the best solution, but nothing will last until there is a bipartisan consensus.

Meanwhile, Baucus (who was on the committee and voted no) has been busy:

U.S. Senate Finance Committee Chairman Max Baucus, a Montana Democrat, omitted a provision to boost tax rates on so- called carried interest from a bill to extend Bush-era tax cuts for middle-income Americans that is set for a Senate vote tomorrow. The bill also would renew dozens of expired business tax breaks to which the carried interest proposal had been attached as a budget-balancing measure.

Since winning control of Congress in 2006, Democrats have made taxing such income at ordinary rates a priority. The House voted in May to tax three quarters of carried interest as wages. While the Senate trimmed it back further to a 50-50 split in June, objections from Republicans and some Democrats blocked the proposal from being considered on the floor.

The Obama administration has proposed taxing carried interest as ordinary income in each of its annual budget proposals.

Can’t be too smug about all this, though, because there’s no plan for balancing the books in Canada either – although, with Spend-Every-Penny in charge, that’s scarcely a surprise.

But Spain is getting serious:

Spain’s Cabinet yesterday raised tax on tobacco and set a date for a pension overhaul, two days after saying it plans to raise about 14 billion euros ($18.4 billion) from selling stakes in the airport operator and lottery company.

“Time has run out; we have been talking for months,” Deputy Prime Minister Alfredo Perez Rubalcaba told reporters, referring to the pension plan. “We are going to work even harder to reach agreements.”

The Basel Committee has announced that it:

agreed on the details of the Basel III rules text, which includes global regulatory standards on capital adequacy and liquidity. The liquidity coverage ratio and the net stable funding ratio will be subject to an observation period and will include a review clause to address any unintended consequences.

The Committee expects to publish the Basel III rules text by the end of this year.

In addition, the Committee reviewed issues related to globally systemic banking institutions. Such banks should have loss-absorbing capacity beyond the Basel III standards and work on this topic continues in the Committee and the Financial Stability Board (FSB). The Committee reviewed a provisional methodology comprising both quantitative and qualitative indicators to assist national authorities in assessing the systemic importance of financial institutions at the global level. It will send a paper on these topics to the FSB by the end of this year for its review. The Committee will complete by mid-2011 a study of the magnitude of additional loss absorbency that global systemically important banks should have. It is also assessing the extent of going-concern loss absorbency that could be provided by different instruments. This review will be completed by mid-2011.

Taking account of comments received during a recent public consultation, the Committee agreed on key elements of the proposal to ensure the loss absorbency of regulatory capital at the point of non-viability and will elaborate the rules concerning transitional arrangements and grandfathering.

Mention of a leverage cap is conspicuous by its absence. DBRS has concluded there will be no credit effect on Canadian banks.

BIS has also published a working paper by Ilhyock Shim and Haibin Zhu titled The impact of CDS trading on the bond market: evidence from Asia:

This paper investigates the impact of CDS trading on the development of the bond market in Asia. In general, CDS trading has lowered the cost of issuing bonds and enhanced the liquidity in the bond market. The positive impact is stronger for smaller firms, non-financial firms and those firms with higher liquidity in the CDS market. These empirical findings support the diversification and information hypotheses in the literature. Nevertheless, CDS trading has also introduced a new source of risk. There is strong evidence that, at the peak of the recent global financial crisis, those firms included in CDS indices faced higher bond yield spreads than those not included.

Very soon trading will become a cooperative game and everybody will win without risk – if only the CFTC enforces enough rules:

The CFTC in October said it was seeking public comment on whether and how to regulate potentially disruptive practices including algorithmic trading and “spoofing,” in which someone enters a bid or offer with the intent of canceling it before the trade is carried out.

Though the Dodd-Frank law expressly prohibits spoofing, Joel Hasbrouck, a professor at New York University, said that a rule tailored to that practice would likely be too narrow. “I think it is going to be based on intent,” he said. “And I would not be in the position of wanting to have to define it.”

The CFTC request for comments takes particular aim at algorithms:

15. Should the Commission consider promulgating rules to regulate the use of algorithmic or automated trading systems to prevent disruptive trading practices? If so, what kinds of rules should the Commission consider?

16. Should the Commission consider promulgating rules to regulate the design of algorithmic or automated trading systems to prevent disruptive trading practices? If so, what kinds of rules should the Commission consider?

17. Should the Commission consider promulgating rules to regulate the supervision and monitoring of algorithmic or automated trading systems to prevent disruptive trading practices? If so, what kinds of rules should the Commission consider?

18. Should the Commission promulgate additional rules specifically applicable to the use of algorithmic trading methodologies and programs that are reasonably necessary to prevent algorithmic trading systems from disrupting fair and equitable markets? If so, what kinds of rules should the Commission consider?

19. Should algorithmic traders be held accountable if they disrupt fair and equitable trading? If so, how?

Last I heard, there needed to be two parties to a trade. If they have agreed on the price, what’s unfair?

Themis Trading notes approvingly:

A new front has been opened up by the CFTC on the battle against HFT.

Police Chief Blair has admitted that his remarks on the arrest of Adam Nobody were completely devoid of factual basis:

Toronto Police Chief Bill Blair publicly apologized Friday to G20 protester Adam Nobody for suggesting he was armed and violent when arrested by police.

Chief Blair said there is no evidence Mr. Nobody was armed at the time of his arrest.

He also said he regretted that his comments in a radio interview created a false impression that the video of Mr. Nobody’s takedown, captured in two segments by bank employee John Bridge, had been doctored in an attempt to mislead.

So that’s how seriously the Toronto Police Force takes well-supported allegations of excessive force: automatic denial, blaming of the victim and making no effort whatsoever to ascertain the facts. We are poorly served and protected.

And, as long as I’m updating that story (discussed December 1, I’ll also update the Emil Cohen story:

The principal’s decision to suspend Cohen, 17, was one Northern’s principal made with a “heavy heart,” said Supt. Ian Allison.

“The issue here is not the speech itself,” he said. “The issue is there was a process and he didn’t follow through.”

The school has countered that the speech he read wasn’t an approved version and he disobeyed his teacher.

I love the contradiction there. ‘The issue isn’t censorship, the issue is that we think he didn’t submit to the censorship process to our satisfaction.’ Never mind, Emil – even if you aren’t on the way to university, most of your classmates are, and there you will all be able to criticize your professors and the administration to your heart’s content – generally speaking, they feel secure enough in their competence to avoid hysterical responses to criticism (informed and otherwise; respectful and otherwise). It’s just too bad Toronto’s secondary school system hasn’t done anything to help you learn to deal with that freedom.

The Canadian preferred share market bounced today and recovered a portion of yesterday’s losses, with PerpetualDiscounts gaining 12 bp (down 38bp yesterday) and Fixed Resets up 13bp (down 58bp yesterday). However, the FixedReset index would have lost today if it hadn’t been for the reinstatement of a reasonable quote for GWO.PR.J, so don’t break out the champagne just yet. Volume was down from yesterday’s peak, but still quite heavy.

HIMIPref™ Preferred Indices
These values reflect the December 2008 revision of the HIMIPref™ Indices

Values are provisional and are finalized monthly
Index Mean
Current
Yield
(at bid)
Median
YTW
Median
Average
Trading
Value
Median
Mod Dur
(YTW)
Issues Day’s Perf. Index Value
Ratchet 0.00 % 0.00 % 0 0.00 0 0.2497 % 2,276.6
FixedFloater 4.73 % 3.19 % 28,358 19.06 1 1.0984 % 3,559.0
Floater 2.62 % 2.35 % 53,182 21.37 4 0.2497 % 2,458.1
OpRet 4.80 % 3.50 % 81,172 2.42 8 -0.2062 % 2,370.9
SplitShare 5.47 % 1.37 % 121,161 1.01 3 0.0603 % 2,460.3
Interest-Bearing 0.00 % 0.00 % 0 0.00 0 -0.2062 % 2,168.0
Perpetual-Premium 5.70 % 5.47 % 155,220 5.39 27 0.1290 % 2,011.0
Perpetual-Discount 5.36 % 5.40 % 284,327 14.79 51 0.1155 % 2,030.6
FixedReset 5.23 % 3.45 % 354,103 3.13 52 0.1283 % 2,260.4
Performance Highlights
Issue Index Change Notes
BAM.PR.I OpRet -2.41 % YTW SCENARIO
Maturity Type : Soft Maturity
Maturity Date : 2013-12-30
Maturity Price : 25.00
Evaluated at bid price : 25.13
Bid-YTW : 5.70 %
MFC.PR.B Perpetual-Discount -1.43 % YTW SCENARIO
Maturity Type : Limit Maturity
Maturity Date : 2040-12-03
Maturity Price : 20.65
Evaluated at bid price : 20.65
Bid-YTW : 5.65 %
TD.PR.O Perpetual-Discount -1.08 % YTW SCENARIO
Maturity Type : Limit Maturity
Maturity Date : 2040-12-03
Maturity Price : 23.50
Evaluated at bid price : 23.75
Bid-YTW : 5.15 %
BAM.PR.G FixedFloater 1.10 % YTW SCENARIO
Maturity Type : Limit Maturity
Maturity Date : 2040-12-03
Maturity Price : 22.84
Evaluated at bid price : 23.01
Bid-YTW : 3.19 %
MFC.PR.E FixedReset 1.10 % YTW SCENARIO
Maturity Type : Call
Maturity Date : 2014-10-19
Maturity Price : 25.00
Evaluated at bid price : 26.67
Bid-YTW : 3.69 %
PWF.PR.K Perpetual-Discount 1.23 % YTW SCENARIO
Maturity Type : Limit Maturity
Maturity Date : 2040-12-03
Maturity Price : 22.80
Evaluated at bid price : 23.00
Bid-YTW : 5.44 %
RY.PR.N FixedReset 1.28 % YTW SCENARIO
Maturity Type : Call
Maturity Date : 2014-03-26
Maturity Price : 25.00
Evaluated at bid price : 27.60
Bid-YTW : 2.96 %
GWO.PR.I Perpetual-Discount 1.29 % YTW SCENARIO
Maturity Type : Limit Maturity
Maturity Date : 2040-12-03
Maturity Price : 21.20
Evaluated at bid price : 21.20
Bid-YTW : 5.32 %
GWO.PR.L Perpetual-Premium 1.46 % YTW SCENARIO
Maturity Type : Call
Maturity Date : 2019-01-30
Maturity Price : 25.00
Evaluated at bid price : 25.00
Bid-YTW : 5.62 %
CIU.PR.A Perpetual-Discount 1.86 % YTW SCENARIO
Maturity Type : Limit Maturity
Maturity Date : 2040-12-03
Maturity Price : 21.55
Evaluated at bid price : 21.90
Bid-YTW : 5.27 %
GWO.PR.J FixedReset 8.42 % A bounce from yesterday’s nonsense. To my complete astonishment, the Toronto Stock Exchange has not yet responded to my queries regarding yesterday’s quote.
YTW SCENARIO
Maturity Type : Call
Maturity Date : 2014-01-30
Maturity Price : 25.00
Evaluated at bid price : 26.90
Bid-YTW : 3.27 %
Volume Highlights
Issue Index Shares
Traded
Notes
FTS.PR.H FixedReset 235,422 Nesbitt crossed blocks of 50,000 and 150,000, both at 25.55. TD crossed 25,000 at the same price.
YTW SCENARIO
Maturity Type : Call
Maturity Date : 2015-07-01
Maturity Price : 25.00
Evaluated at bid price : 25.54
Bid-YTW : 3.73 %
BNS.PR.Q FixedReset 212,876 Desjardins crossed blocks of 115,000 and 89,600, both at 26.20.
YTW SCENARIO
Maturity Type : Call
Maturity Date : 2013-11-24
Maturity Price : 25.00
Evaluated at bid price : 26.23
Bid-YTW : 3.36 %
TRP.PR.A FixedReset 147,361 Nesbitt crossed 100,000 at 25.85. RBC crossed 35,000 at the same price.
YTW SCENARIO
Maturity Type : Call
Maturity Date : 2015-01-30
Maturity Price : 25.00
Evaluated at bid price : 25.85
Bid-YTW : 3.62 %
FTS.PR.E OpRet 101,000 Nesbitt crossed 100,000 at 27.00.
YTW SCENARIO
Maturity Type : Call
Maturity Date : 2013-07-01
Maturity Price : 25.75
Evaluated at bid price : 26.92
Bid-YTW : 2.94 %
CIU.PR.C FixedReset 100,200 Recent new issue.
YTW SCENARIO
Maturity Type : Limit Maturity
Maturity Date : 2040-12-03
Maturity Price : 23.13
Evaluated at bid price : 25.00
Bid-YTW : 3.56 %
RY.PR.F Perpetual-Discount 97,031 Nesbitt bought 10,000 from RBC at 22.14. RBC crossed 23,900 and Nesbitt crossed 50,000, both at 22.10.
YTW SCENARIO
Maturity Type : Limit Maturity
Maturity Date : 2040-12-03
Maturity Price : 22.03
Evaluated at bid price : 22.15
Bid-YTW : 5.05 %
There were 52 other index-included issues trading in excess of 10,000 shares.

December 2, 2010

Friday, December 3rd, 2010

The European emergency measures is being extended:

Under pressure from investors to lead the charge against the spreading sovereign debt crisis, Trichet said the ECB will keep offering banks as much cash as they want through the first quarter over periods of up to three months at a fixed interest rate. As he spoke, ECB staff embarked upon a new wave of purchases, triggering a surge in Irish and Portuguese bonds.

While the ECB chose not to deploy new crisis-fighting tools, Trichet managed to avoid sparking another market selloff four days after traders gave a vote of no-confidence to a bailout of Ireland. He kept up pressure on governments to fight the crisis by saying that “benign neglect” is not enough and indicated they could expand Europe’s rescue fund amid concern it’s not large enough to finance any bailout of Spain.

The yield on Portuguese 10-year bonds dropped 50 basis points to 6.13 percent and Irish yields fell 37 basis points to 8.76 percent. The Spanish 10-year yield declined 22 basis points to 5.07 percent. The euro traded at $1.3228 at 5:41 p.m. in London compared with $1.3152 before Trichet started talking.

Signaling disagreement within the 22-member council, Trichet said an “overwhelming majority” of officials backed the ECB’s Securities Market Program and that a “consensus” supported maintaining the status quo on providing liquidity. Bond purchases will continue to be offset to keep the money supply unchanged, in contrast to the Federal Reserve and the Bank of England, he said.

“It’s not quantitative easing, we’re withdrawing all the liquidity,” he said.

The future seniority of ESM debt to public sovereign debt is cited as a potential trigger for a Greek downgrade:

Greece’s ‘BB+’ long-term sovereign rating was placed on “CreditWatch” with negative implications, Standard & Poor’s Ratings Services said in a statement today from Madrid. S&P said it is assessing credit implications of the so-called European Stability Mechanism that may govern European Union sovereign bonds beginning in July 2013.

“Assigning ‘preferred creditor’ status to future official lending via the ESM could be detrimental to the ability of non- official holders of sovereign debt to be repaid,” S&P said.

The EU in October agreed on the need to set up the ESM as a permanent crisis mechanism to safeguard the financial stability of the euro area as a whole. The Eurogroup, comprising the finance ministers of the 16 nations sharing the euro, said in a statement on Nov. 28 that “an ESM loan will enjoy preferred creditor status, junior only” to the loan from the International Monetary Fund.

Greece in May got a three-year aid package of 110 billion euros ($145 billion) from the euro area and the IMF to prevent a debt default.

The Icelandic model is being touted:

While analysts expect Iceland’s recession to extend into next year, the nation’s exporters are benefiting from a 28 percent drop in the krona against the dollar since September 2008. The decline may help the nation of 320,000 people rebalance its economy faster than Ireland, whose euro membership rules out a currency devaluation. With Iceland’s OMX share index up 17 percent this year, the third-biggest gain in Europe after Denmark and Sweden, Nobel Prize-winning economist Paul Krugman says Iceland may be an example of “bankrupting yourself to recovery.”

“The difference is that in Iceland we allowed the banks to fail,” Iceland President Olafur R. Grimsson said in a Nov. 26 interview with Bloomberg Television’s Mark Barton. “These were private banks and we didn’t pump money into them in order to keep them going; the state did not shoulder the responsibility of the failed private banks.”

The insolvency was highly unpopular at the time – but a lot better for the world than the pretend sort-of insolvencies being touted by politicians.

In the meantime, it appears that the US still isn’t taking its fiscal deficit seriously enough:

Senate Finance Committee Chairman Max Baucus, a Democrat, and incoming House Ways and Means Committee Chairman Dave Camp, a Republican, said today they will vote against the plan tomorrow. They join Representatives Paul Ryan, a Wisconsin Republican, and Jan Schakowsky, an Illinois Democrat, in opposition.

The plan requires approval from 14 of the panel’s 18 members to forward it to Congress, meaning five “no” votes would kill it. Texas Republican Jeb Hensarling said today he is leaning against the proposal.

The recommendations are “wrong for Montana and wrong for rural communities across the country,” Baucus of Montana said in a statement. While reducing the deficit is “imperative,” he said, “we cannot cut the deficit at the expense of veterans, seniors, ranchers, farmers and hard-working families.”

Ideally, of course, Baucus will be dead, retired, or gainfully employed by the time the shit hits the fan. ABC News reports that it:

has learned Andrew Stern will vote no on the deficit commission’s plan to reduce the national deficit by nearly $4 trillion. Mr. Stern, the former president of the SEIU, has informed co-chairmen Erskine Bowles and Alan Simpson that he will be the fifth member voting no, ending the commission’s hopes of officially passing the plan to Congress.

Two recent products to hit the Toronto market FFL / FFL.U and SST / SST.U are either craziness or genius. One or the other. The latter is the iPath® US Treasury Flattener Exchange Traded Note, which:

is linked inversely to the performance of the Barclays Capital US Treasury 2Y/10Y Yield Curve Index™. The index employs a strategy that seeks to capture returns that are potentially available from a “steepening” or “flattening”, as applicable, of the U.S. Treasury yield curve through a notional rolling investment in U.S. Treasury note futures contracts. The level of the index is designed to increase in response to a “steepening” of the yield curve and to decrease in response to a “flattening” of the yield curve. To accomplish this objective, the performance of the index tracks the returns of a notional investment in a weighted “long” position in relation to 2-year Treasury futures contracts and a weighted “short” position in relation to 10-year Treasury futures contracts, as traded on the Chicago Board of Trade.

The iPath® US Treasury Flattener ETN employs an index multiplier that provides the investor at maturity or upon redemption a participation rate of $0.10 gain or loss per each 1.00 point decrease or increase, respectively, in the level of the index. For purposes of calculating the closing indicative note value on a given day, the index multiplier is multiplied by the daily index performance, which is added to the daily interest that accrued from a notional investment of the value of the ETN at the 28-day U.S. Treasury Bill rate, from which all applicable costs and fees are deducted.

On the one hand, this is a way for retail and small institutions to adjust their exposures without entering into costly trades. On the other hand, trading Treasuries is about the cheapest thing you can do in the capital markets. And retail’s lucky if it understands duration, let alone steepeners, flatteners and convexity. And there’s no related product to handle the 10-30 spread. On the other hand, I guess, if it sells, it sells.

CIBC debt capital markets division is doing well:

Canadian Imperial Bank of Commerce ranks among the top three banks managing corporate bond sales in Canada for the first time since 2004, displacing Toronto- Dominion Bank as company issuance surges to a three-year high.

The bank’s CIBC World Markets unit ranks second this year after leading debt sales for companies such as Telus Corp. and BCE Inc. Royal Bank of Canada’s RBC Capital Markets is first, extending its streak of more than a decade as the top arranger, according to data compiled by Bloomberg. Bank of Nova Scotia’s Scotia Capital unit ranks third among Canada’s six major banks.

Companies have raised C$69.4 billion ($68.2 billion) in bond sales this year, up from C$57.2 billion in all of 2009 and the highest since 2007, according to Bloomberg data.

The Toronto-based firm also raised about C$6.2 billion for its parent, Canadian Imperial Bank of Commerce, the country’s fifth-biggest bank.

By comparison, TD Securities had one C$1 billion debt sale this year for its parent, Toronto-Dominion Bank, Canada’s second-biggest bank.

“When we look at things, excluding self-led deals, we see ourselves solidly in second place,” Brad Saunders, vice president of debt syndication at TD Securities, said in an interview.

It was clobberin’ time in the Canadian preferred share market today, with PerpetualDiscounts losing 38bp and FixedResets being hammered for an unbelievable (semi-believable, at best) loss of 58bp. Volume was extremely heavy; so heavy that the market maker for GWO.PR.J had to take the afternoon off – which cost the FixedReset index about a third of its apparent loss.

HIMIPref™ Preferred Indices
These values reflect the December 2008 revision of the HIMIPref™ Indices

Values are provisional and are finalized monthly
Index Mean
Current
Yield
(at bid)
Median
YTW
Median
Average
Trading
Value
Median
Mod Dur
(YTW)
Issues Day’s Perf. Index Value
Ratchet 0.00 % 0.00 % 0 0.00 0 0.0625 % 2,270.9
FixedFloater 4.78 % 3.43 % 29,483 19.16 1 -0.6114 % 3,520.4
Floater 2.62 % 2.36 % 53,048 21.36 4 0.0625 % 2,452.0
OpRet 4.79 % 3.87 % 83,592 2.39 8 -0.1150 % 2,375.8
SplitShare 5.47 % 1.28 % 121,853 1.01 3 -0.0937 % 2,458.9
Interest-Bearing 0.00 % 0.00 % 0 0.00 0 -0.1150 % 2,172.4
Perpetual-Premium 5.70 % 5.50 % 156,073 5.40 27 0.0037 % 2,008.4
Perpetual-Discount 5.37 % 5.39 % 284,189 14.78 51 -0.3814 % 2,028.2
FixedReset 5.24 % 3.42 % 355,418 3.20 52 -0.5792 % 2,257.5
Performance Highlights
Issue Index Change Notes
GWO.PR.J FixedReset -9.35 % This is just a stupid quote. The issue traded 2,831 shares in a range of 27.41-64 and the last of the eleven trades was at 3:33pm. The closing quote was 24.81-27.54, 4×9.

There is no excuse for this crap. Market makers get numerous privileges but are nudge-wink obliged ha-ha to maintain orderly markets and reasonable snicker spreads hee-hee. The Toronto Exchange should be investigating this and issuing a statement explaining this apparent gross dereliction of duty; and perhaps stripping the market maker of his responsibilities for this issue; perhaps extending some sanctions to the individual’s other issues and to the rest of his firm. If he was legitimately busy, or had a heart attack or whatever … who cares? That’s what algorithms are for and they can call a market with a latency of somewhat less than half an hour.

I have sent an email to the TMX (join in!) inquiring about the circumstances and repercussions of this quote. Who knows … if I’m lucky I might get a note from a clerk six months out of B-School thanking me for my inquiry, which is being taken very seriously.

Could we simply chalk this up to the vagaries of the capital markets? Could there be a good reason for this? Sure. Let’s hear it.

YTW SCENARIO
Maturity Type : Limit Maturity
Maturity Date : 2040-12-02
Maturity Price : 24.69
Evaluated at bid price : 24.81
Bid-YTW : 5.52 %

TRP.PR.C FixedReset -2.20 % YTW SCENARIO
Maturity Type : Limit Maturity
Maturity Date : 2040-12-02
Maturity Price : 25.30
Evaluated at bid price : 25.35
Bid-YTW : 3.96 %
CIU.PR.A Perpetual-Discount -1.83 % YTW SCENARIO
Maturity Type : Limit Maturity
Maturity Date : 2040-12-02
Maturity Price : 21.50
Evaluated at bid price : 21.50
Bid-YTW : 5.39 %
BNS.PR.T FixedReset -1.66 % YTW SCENARIO
Maturity Type : Call
Maturity Date : 2014-05-25
Maturity Price : 25.00
Evaluated at bid price : 27.29
Bid-YTW : 3.65 %
TD.PR.E FixedReset -1.59 % YTW SCENARIO
Maturity Type : Call
Maturity Date : 2014-05-30
Maturity Price : 25.00
Evaluated at bid price : 27.30
Bid-YTW : 3.65 %
RY.PR.L FixedReset -1.49 % YTW SCENARIO
Maturity Type : Call
Maturity Date : 2014-03-26
Maturity Price : 25.00
Evaluated at bid price : 26.45
Bid-YTW : 3.74 %
RY.PR.F Perpetual-Discount -1.47 % YTW SCENARIO
Maturity Type : Limit Maturity
Maturity Date : 2040-12-02
Maturity Price : 22.00
Evaluated at bid price : 22.12
Bid-YTW : 5.06 %
BNS.PR.X FixedReset -1.44 % YTW SCENARIO
Maturity Type : Call
Maturity Date : 2014-05-25
Maturity Price : 25.00
Evaluated at bid price : 27.36
Bid-YTW : 3.59 %
GWO.PR.I Perpetual-Discount -1.32 % YTW SCENARIO
Maturity Type : Limit Maturity
Maturity Date : 2040-12-02
Maturity Price : 20.93
Evaluated at bid price : 20.93
Bid-YTW : 5.38 %
SLF.PR.G FixedReset -1.21 % YTW SCENARIO
Maturity Type : Limit Maturity
Maturity Date : 2040-12-02
Maturity Price : 25.25
Evaluated at bid price : 25.30
Bid-YTW : 3.80 %
BMO.PR.N FixedReset -1.19 % YTW SCENARIO
Maturity Type : Call
Maturity Date : 2014-03-27
Maturity Price : 25.00
Evaluated at bid price : 27.48
Bid-YTW : 3.35 %
MFC.PR.C Perpetual-Discount -1.17 % YTW SCENARIO
Maturity Type : Limit Maturity
Maturity Date : 2040-12-02
Maturity Price : 20.21
Evaluated at bid price : 20.21
Bid-YTW : 5.59 %
BMO.PR.K Perpetual-Discount -1.09 % YTW SCENARIO
Maturity Type : Limit Maturity
Maturity Date : 2040-12-02
Maturity Price : 24.28
Evaluated at bid price : 24.51
Bid-YTW : 5.38 %
FTS.PR.F Perpetual-Discount -1.08 % YTW SCENARIO
Maturity Type : Limit Maturity
Maturity Date : 2040-12-02
Maturity Price : 22.68
Evaluated at bid price : 22.85
Bid-YTW : 5.39 %
RY.PR.A Perpetual-Discount -1.07 % YTW SCENARIO
Maturity Type : Limit Maturity
Maturity Date : 2040-12-02
Maturity Price : 21.99
Evaluated at bid price : 22.12
Bid-YTW : 5.06 %
BAM.PR.T FixedReset 1.22 % YTW SCENARIO
Maturity Type : Limit Maturity
Maturity Date : 2040-12-02
Maturity Price : 23.06
Evaluated at bid price : 24.90
Bid-YTW : 4.52 %
MFC.PR.D FixedReset 1.28 % YTW SCENARIO
Maturity Type : Call
Maturity Date : 2014-07-19
Maturity Price : 25.00
Evaluated at bid price : 27.60
Bid-YTW : 3.48 %
BNS.PR.O Perpetual-Premium 1.57 % YTW SCENARIO
Maturity Type : Call
Maturity Date : 2017-05-26
Maturity Price : 25.00
Evaluated at bid price : 25.19
Bid-YTW : 5.60 %
Volume Highlights
Issue Index Shares
Traded
Notes
CM.PR.L FixedReset 326,948 RBC crossed six blocks: 91,600 and 74,900 and 25,100 and 40,000 and 10,000 and 50,000, all at 27.90.
YTW SCENARIO
Maturity Type : Call
Maturity Date : 2014-05-30
Maturity Price : 25.00
Evaluated at bid price : 27.90
Bid-YTW : 3.18 %
CIU.PR.C FixedReset 294,500 New issue settled today.
YTW SCENARIO
Maturity Type : Limit Maturity
Maturity Date : 2040-12-02
Maturity Price : 23.13
Evaluated at bid price : 25.00
Bid-YTW : 3.56 %
BNS.PR.Q FixedReset 227,885 RBC bought 12,400 from anonymous at 26.18; Desjardins crossed two blocks of 100,000 each, both at 26.20.
YTW SCENARIO
Maturity Type : Call
Maturity Date : 2013-11-24
Maturity Price : 25.00
Evaluated at bid price : 26.20
Bid-YTW : 3.40 %
CIU.PR.B FixedReset 209,316 RBC crossed blocks of 132,400 and 74,400, both at 28.06.
YTW SCENARIO
Maturity Type : Call
Maturity Date : 2014-07-01
Maturity Price : 25.00
Evaluated at bid price : 27.86
Bid-YTW : 3.34 %
NA.PR.N FixedReset 104,100 RBC sold 19,600 to TD at 26.40, then crossed blocks of 60,800 and 19,000, both at 26.34.
YTW SCENARIO
Maturity Type : Call
Maturity Date : 2013-09-14
Maturity Price : 25.00
Evaluated at bid price : 26.39
Bid-YTW : 3.30 %
BMO.PR.O FixedReset 87,121 TD crossed 74,300 at 27.75.
YTW SCENARIO
Maturity Type : Call
Maturity Date : 2014-06-24
Maturity Price : 25.00
Evaluated at bid price : 27.75
Bid-YTW : 3.29 %
There were 77 other index-included issues trading in excess of 10,000 shares.

CIU.PR.C Closes Steady on Reasonable Volume

Thursday, December 2nd, 2010

CIU.PR.C, the 3.80%+136 FixedReset announced November 16, has settled.

The issue traded 294,500 shares in a very tight range of 25.00-05 before closing at 25.00-09, 10×10.

Vital statistics are:

CIU.PR.C FixedReset Not Calc! YTW SCENARIO
Maturity Type : Limit Maturity
Maturity Date : 2040-12-02
Maturity Price : 23.13
Evaluated at bid price : 25.00
Bid-YTW : 3.56 %

CIU.PR.C is tracked by HIMIPref™ and has been assigned to the FixedReset index.

HIMIPre™ Index Performance: November 2010

Thursday, December 2nd, 2010

Performance of the HIMIPref™ Indices for November, 2010, was:

Total Return
Index Performance
November 2010
Three Months
to
November 30, 2010
Ratchet +3.81% *** +11.02% ***
FixFloat +5.65% ** +13.36% **
Floater +3.48% +11.02%
OpRet +0.29% +1.25%
SplitShare +2.98% +6.79%
Interest +0.29%**** +1.25%****
PerpetualPremium -0.32% +2.01
PerpetualDiscount +0.71% +6.91%
FixedReset -0.25% +0.77%
** The last member of the FixedFloater index was transferred to Scraps at the June, 2010, rebalancing; subsequent performance figures are set equal to the Floater index. The index was repopulated at the October, 2010, rebalancing
*** The last member of the RatchetRate index was transferred to Scraps at the July, 2010, rebalancing; subsequent performance figures are set equal to the Floater index
**** The last member of the InterestBearing index was transferred to Scraps at the June, 2009, rebalancing; subsequent performance figures are set equal to the OperatingRetractible index
Initial index values have been used until I run the precise index computations. Final values are not expected to be materially different
Passive Funds (see below for calculations)
CPD +0.23% +3.81%
DPS.UN +0.88% +5.49%
Index
BMO-CM 50 +0.65% +5.15%
TXPR Total Return +0.30% +4.13%

CPD still has a problem with tracking error – based on its management fee, the monthly tracking error is expected to be 4bp, but this month they came in at 7bp (which was nevertheless an improvement from recent values). The difference may not seem like much, but when these figures are annualized …

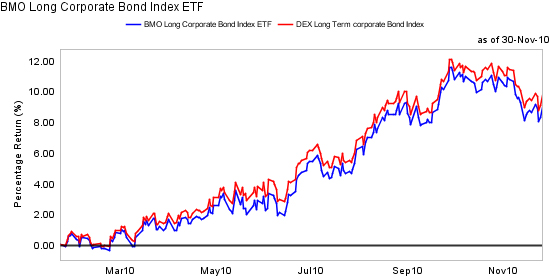
The pre-tax interest equivalent spread of PerpetualDiscounts over Long Corporates (which I also refer to as the Seniority Spread) ended the month at 220bp, a significant decline from the 235bp reported at October month end. Long corporate yields increased to 5.4% from 5.2% during the period while PerpetualDiscounts remained constant at 5.41% dividend yield, equivalent to 7.57% interest at the standard conversion factor of 1.4x. I would be happier with long corporates in the 6.00-6.25% range with a seniority spread in the range of 100-150bp, but what do I know? The market has never shown any particular interest in my happiness.

The increase in Long Corporate yields was most pronounced in the first part of the month:


Click for Big

Charts related to the Seniority Spread and the Bozo Spread (PerpetualDiscount Current Yield less FixedReset Current Yield) are published in PrefLetter.

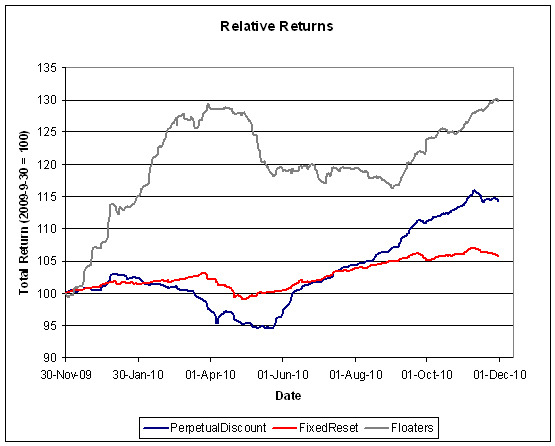
The trailing year returns are starting to look a bit more normal.


Click for big

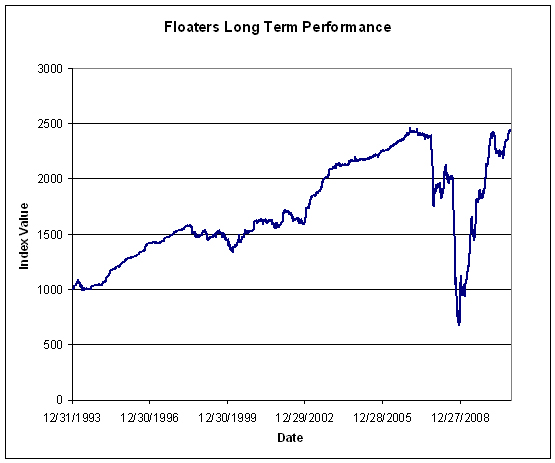
Floaters have had a wild ride; the latest decline is presumably due to the idea that the BoC will be slower rather than faster in hiking the overnight rate. I’m going to keep publishing updates of this graph until the one-year trailing return for the sector no longer looks so gigantic:


Click for big

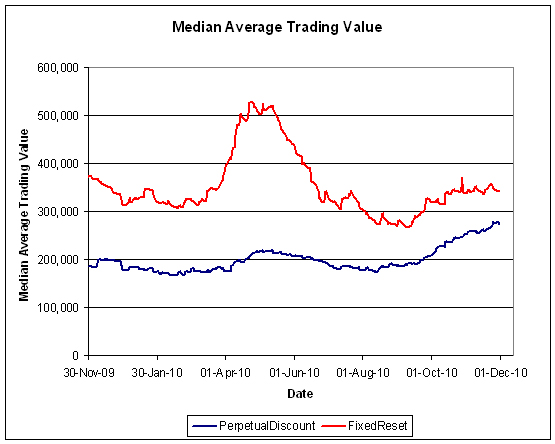
Volumes are on their way back up Volume may be under-reported due to the influence of Alternative Trading Systems (as discussed in the November PrefLetter), but I am biding my time before incorporating ATS volumes into the calculations, to see if the effect is transient or not.


Click for big

Compositions of the passive funds were discussed in the September, 2010, edition of PrefLetter.

Claymore has published NAV and distribution data (problems with the page in IE8 can be kludged by using compatibility view) for its exchange traded fund (CPD) and I have derived the following table:

CPD Return, 1- & 3-month, to November 30, 2010
Date NAV Distribution Return for Sub-Period Monthly Return
August 31 16.78    
September 27 17.12 0.069 +2.44% +2.14%
September 30 17.07   -0.29%
October 26 17.21 0.069 +1.22% +1.40%
October 29, 2010 17.24   +0.17%
November 25 17.25 0.069 +0.46% +0.23%
November 30 17.21   -0.23%
Quarterly Return +3.81%

Claymore currently holds $582,195,003 (advisor & common combined) in CPD assets, up about $23-million (4.03%) from the $559,641,405 reported at August month-end and up about $208-million (55.78%) from the $373,729,364 reported at year-end. Their tracking error does not seem to be affecting their ability to gather assets!

The DPS.UN NAV for December 1 has been published so we may calculate the approximate November returns.

DPS.UN NAV Return, November-ish 2010
Date NAV Distribution Return for sub-period Return for period
October 27 21.12   0.00%  
December 1 21.33     +0.99%
Estimated October Ending Stub -0.17% *****
Estimated December Beginning Stub *
Estimated November Return +0.88% ******
*CPD had a NAVPU of 16.82 on September 1 and 16.78 on August 31, hence the total return for the period for CPD was +0.24%. The return for DPS.UN in this period is presumed to be equal.
**CPD had a NAVPU of 17.21 on November 30 and 17.20 on December 1, therefore the return for the day was -0.06%. The return for DPS.UN in this period is presumed to be equal.
*****CPD had a NAVPU of 17.21 on October 27 and 17.24 on October 29, hence the total return for the period for CPD was +0.17%. The return for DPS.UN in this period is presumed to be equal.
**** The estimated November return for DPS.UN’s NAV is therefore the product of three period returns, +0.99%, -0.17%, +0.06% to arrive at an estimate for the calendar month of +0.88%

Now, to see the DPS.UN quarterly NAV approximate return, we refer to the calculations for September & October:

DPS.UN NAV Returns, three-month-ish to end-November-ish, 2010
September-ish +4.39%
October-ish +0.17%
November-ish +0.88%
Three-months-ish +5.49%

Sentry Select is now publishing performance data for DPS.UN, but this appears to be price-based, rather than NAV-based. I will continue to report NAV-based figures.

New Issue: TA FixedReset 4.60%+203

Thursday, December 2nd, 2010

Transalta Corporation has announced:

that it has agreed to issue to a syndicate of underwriters led by CIBC, RBC Capital Markets and Scotia Capital Inc. for distribution to the public 8,000,000 Cumulative Rate Reset First Preferred Shares, Series A (the “Series A Shares”). The Series A Shares will be issued at a price of $25.00 per Series A Share, for aggregate gross proceeds of $200 million. Holders of the Series A Shares will be entitled to receive a cumulative quarterly fixed dividend yielding 4.60% annually for the initial period ending March 31, 2016. Thereafter, the dividend rate will be reset every five years at a rate equal to the 5-year Government of Canada bond yield plus 2.03%.

Holders of Series A Shares will have the right, at their option, to convert their shares into Cumulative Rate Reset First Preferred Shares, Series B (the “Series B Shares”), subject to certain conditions, on March 31, 2016 and on March 31 every five years thereafter. Holders of the Series B Shares will be entitled to receive cumulative quarterly floating dividends at a rate equal to the three-month Government of Canada Treasury Bill yield plus 2.03%.

TransAlta Corporation has granted the underwriters an option, exercisable in whole or in part prior to closing, to purchase up to an additional 2,000,000 Series A Shares at the same offering price. The Series A Shares will be offered by way of prospectus supplement under the short form base shelf prospectus of TransAlta Corporation dated October 19, 2009. The prospectus supplement will be filed with securities regulatory authorities in all provinces of Canada.

The net proceeds of the offering will be used to partially fund capital projects, for other general corporate purposes and to reduce short term indebtedness of the Company and its affiliates, which short term indebtedness was used to fund the Company’s capital program and for general corporate purposes. The Company may invest funds that it does not immediately require in short term marketable debt securities. The offering is expected to close on or about December 10, 2010.

Update: The market says “Super-Size me!”

TransAlta Corporation (TSX:TA) (NYSE:TAC) has increased its previously announced bought deal financing to $250 million. TransAlta Corporation has agreed to issue to a syndicate of underwriters led by CIBC, RBC Capital Markets and Scotia Capital Inc. for distribution to the public 10,000,000 Cumulative Rate Reset First Preferred Shares, Series A (the “Series A Shares”). The Series A Shares will be issued at a price of $25.00 per Series A Share, for aggregate gross proceeds of $250 million.

TransAlta Corporation has granted the underwriters an option, exercisable in whole or in part prior to closing, to purchase up to an additional 2,000,000 Series A Shares at the same offering price.