There’s a story about Credit Suisse’s toxic asset bonuses:
The toxic-asset bonuses given to senior Credit Suisse Group AG (CSGN) bankers at the depths of the 2008 financial crisis are turning out to be almost as good as gold.
Credit Suisse employees who got $5.05 billion of junk-grade loans and commercial-mortgage-backed bonds in late 2008 as part of annual bonuses have reaped gains of 75 percent on the payouts since the end of that year through Nov. 30, people with knowledge of the results said. Gold futures returned 98 percent in the period, while Credit Suisse’s shares declined 23 percent.
The gains, which also beat the 4.8 percent return of two- year Treasuries, show how the rebound in debt markets from the lows of 2008 has sweetened the Zurich-based bank’s executive bonuses compared with the cash and stock bonuses rivals paid.
Assiduous Readers with extremely good memories will remember that on December 18, 2008 I wrote:
If I am correct – with the support of the BoE – and bank assets have, in general, been written down to far below fundamental value, this is a clever way for the executives to (a) earn brownie points, and (b) give themselves enormous bonuses.
It was reported that this pool was up 17% on August 7, 2009.
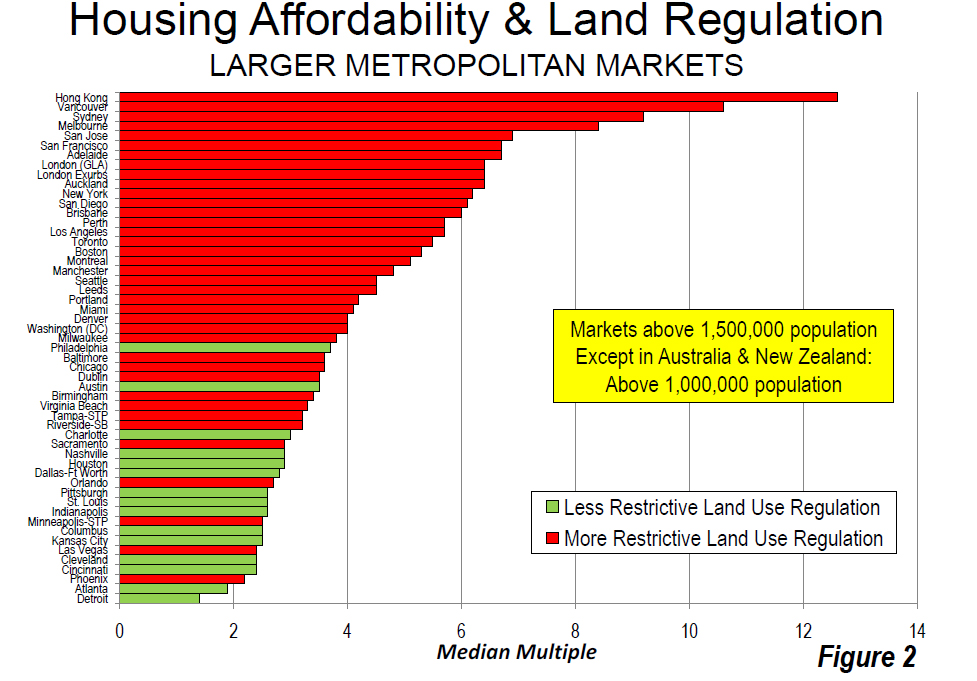
Bloomberg brings to my attention an interesting survey on global real-estate prices titled 8th Annual Demographia International Housing Affordability Survey: 2012:
The five least affordable major metropolitan markets remained the same in 2011. Hong Kong, Vancouver and Sydney continued to be the most unaffordable major markets. However Vancouver displaced Sydney as the second most unaffordable market. Hong Kong ranked as the least affordable major market (81st)8, with a median multiple of 12.6. Vancouver ranked second least affordable (80th), with a Median Multiple of 10.6. Sydney ranked third most unaffordable, with a Median Multiple of 9.2 (79th). Melbourne ranked 78th, with a Median Multiple of 8.4. Plymouth & Devon was also above 7.0 (78th ), with a Median Multiple of 7.4. The 5 major metropolitan areas with a Median Multiple above 7.0 is an improvement from last year’s 8 (Table 4).
The Median Multiple is the Median House Price divided by Median Household Income. For Toronto, this is $406,400 / $73,600.
I’m not certain that I like this measure of “Affordability” and also not certain that I like the term “Affordability” at all. After all, if houses were genuinely unaffordable, then nobody would be able to buy them and the price would come down. I would be interested in a measure that took into account income inequality; if we were to say, as a rule of thumb, that a house should cost three times household income, then what percentage of the population can afford to buy a house? e.g., if the median house in Toronto costs $406,400 then we can say that you need household income of $135,500 to buy one – so what percentage of the Toronto population has household income in excess of $135,500?
It was a strong day for the Canadian preferred share market with PerpetualDiscounts up 22bp, FixedResets gaining 18bp and DeemedRetractibles winning 27bp. All entries on the Performance Highlights table were winners, with a marked preponderance of SLF DeemedRetractibles. Volume was high.
HIMIPref™ Preferred Indices These values reflect the December 2008 revision of the HIMIPref™ Indices Values are provisional and are finalized monthly |
|||||||
Index | Mean Current Yield (at bid) |
Median YTW |
Median Average Trading Value |
Median Mod Dur (YTW) |
Issues | Day’s Perf. | Index Value |
Ratchet | 0.00 % | 0.00 % | 0 | 0.00 | 0 | 0.9947 % | 2,367.0 |
FixedFloater | 4.70 % | 4.07 % | 41,667 | 17.27 | 1 | 0.4975 % | 3,315.7 |
Floater | 2.82 % | 3.01 % | 67,153 | 19.71 | 3 | 0.9947 % | 2,555.7 |
OpRet | 4.94 % | 1.43 % | 64,650 | 1.31 | 7 | -0.0601 % | 2,502.6 |
SplitShare | 5.34 % | 0.71 % | 68,522 | 0.88 | 4 | 0.0453 % | 2,620.3 |
Interest-Bearing | 0.00 % | 0.00 % | 0 | 0.00 | 0 | -0.0601 % | 2,288.4 |
Perpetual-Premium | 5.41 % | -9.62 % | 86,276 | 0.09 | 23 | -0.0068 % | 2,212.2 |
Perpetual-Discount | 5.03 % | 4.98 % | 161,351 | 15.51 | 7 | 0.2249 % | 2,406.7 |
FixedReset | 5.03 % | 2.81 % | 207,671 | 2.35 | 65 | 0.1803 % | 2,382.9 |
Deemed-Retractible | 4.89 % | 3.47 % | 190,031 | 1.29 | 46 | 0.2703 % | 2,306.5 |
Performance Highlights | |||
Issue | Index | Change | Notes |
GWO.PR.N | FixedReset | 1.01 % | Recovery from Friday’s Moronification. YTW SCENARIO Maturity Type : Hard Maturity Maturity Date : 2022-01-31 Maturity Price : 25.00 Evaluated at bid price : 24.05 Bid-YTW : 3.60 % |
MFC.PR.D | FixedReset | 1.07 % | YTW SCENARIO Maturity Type : Call Maturity Date : 2014-06-19 Maturity Price : 25.00 Evaluated at bid price : 27.32 Bid-YTW : 2.88 % |
SLF.PR.A | Deemed-Retractible | 1.15 % | YTW SCENARIO Maturity Type : Hard Maturity Maturity Date : 2022-01-31 Maturity Price : 25.00 Evaluated at bid price : 23.81 Bid-YTW : 5.44 % |
CM.PR.L | FixedReset | 1.58 % | Recovery from Friday’s Moronification. YTW SCENARIO Maturity Type : Call Maturity Date : 2014-04-30 Maturity Price : 25.00 Evaluated at bid price : 27.03 Bid-YTW : 2.74 % |
PWF.PR.A | Floater | 1.61 % | YTW SCENARIO Maturity Type : Limit Maturity Maturity Date : 2042-01-23 Maturity Price : 20.75 Evaluated at bid price : 20.75 Bid-YTW : 2.52 % |
SLF.PR.C | Deemed-Retractible | 1.93 % | YTW SCENARIO Maturity Type : Hard Maturity Maturity Date : 2022-01-31 Maturity Price : 25.00 Evaluated at bid price : 22.75 Bid-YTW : 5.71 % |
SLF.PR.D | Deemed-Retractible | 2.29 % | YTW SCENARIO Maturity Type : Hard Maturity Maturity Date : 2022-01-31 Maturity Price : 25.00 Evaluated at bid price : 22.81 Bid-YTW : 5.68 % |
TD.PR.I | FixedReset | 3.84 % | Recovery from Friday’s Moronification. YTW SCENARIO Maturity Type : Call Maturity Date : 2014-07-31 Maturity Price : 25.00 Evaluated at bid price : 27.33 Bid-YTW : 2.38 % |
Volume Highlights | |||
Issue | Index | Shares Traded |
Notes |
ENB.PR.F | FixedReset | 270,265 | Recent new issue. YTW SCENARIO Maturity Type : Limit Maturity Maturity Date : 2042-01-23 Maturity Price : 23.19 Evaluated at bid price : 25.30 Bid-YTW : 3.77 % |
BMO.PR.L | Deemed-Retractible | 131,831 | Nesbitt crossed blocks of 88,300 and 34,000, both at 28.02. We haven’t seen a 28-handle in a while! YTW SCENARIO Maturity Type : Call Maturity Date : 2013-05-25 Maturity Price : 26.00 Evaluated at bid price : 27.98 Bid-YTW : 0.51 % |
GWO.PR.G | Deemed-Retractible | 91,472 | Nesbitt crossed 84,200 at 25.25. YTW SCENARIO Maturity Type : Call Maturity Date : 2013-12-31 Maturity Price : 25.00 Evaluated at bid price : 25.16 Bid-YTW : 5.05 % |
PWF.PR.K | Perpetual-Discount | 63,412 | Nesbitt crossed blocks of 39,600 and 12,700, both at 24.77. YTW SCENARIO Maturity Type : Limit Maturity Maturity Date : 2042-01-23 Maturity Price : 24.30 Evaluated at bid price : 24.80 Bid-YTW : 4.98 % |
BAM.PR.Z | FixedReset | 58,612 | Nesbitt crossed blocks of 30,000 and 15,000 at 26.20. YTW SCENARIO Maturity Type : Call Maturity Date : 2017-12-31 Maturity Price : 25.00 Evaluated at bid price : 25.95 Bid-YTW : 4.15 % |
CM.PR.L | FixedReset | 58,517 | RBC crossed 46,800 at 27.02. The seller may well be the guy who bought 42,600 at 26.61 on Friday during the Extended Moron Session … if so, call it profit of almost $20-grand, not a bad day’s work. YTW SCENARIO Maturity Type : Call Maturity Date : 2014-04-30 Maturity Price : 25.00 Evaluated at bid price : 27.03 Bid-YTW : 2.74 % |
There were 43 other index-included issues trading in excess of 10,000 shares. |
Wide Spread Highlights | ||
Issue | Index | Quote Data and Yield Notes |
BNA.PR.E | SplitShare | Quote: 24.10 – 24.60 Spot Rate : 0.5000 Average : 0.3448 YTW SCENARIO |
BAM.PR.I | OpRet | Quote: 25.60 – 25.99 Spot Rate : 0.3900 Average : 0.2768 YTW SCENARIO |
BAM.PR.J | OpRet | Quote: 26.81 – 27.10 Spot Rate : 0.2900 Average : 0.1929 YTW SCENARIO |
RY.PR.L | FixedReset | Quote: 26.53 – 26.72 Spot Rate : 0.1900 Average : 0.1197 YTW SCENARIO |
PWF.PR.E | Perpetual-Premium | Quote: 25.85 – 26.18 Spot Rate : 0.3300 Average : 0.2667 YTW SCENARIO |
GWO.PR.I | Deemed-Retractible | Quote: 24.01 – 24.19 Spot Rate : 0.1800 Average : 0.1211 YTW SCENARIO |
BCE.PR.F Secondary Offering at 24.25
Tuesday, January 24th, 2012I have heard from multiple authoritative sources that a big holder of BCE.PR.F is selling 2-million shares at 24.25 through a syndicate of dealers. They were last quoted at 24.53-60, 3×48, having traded 8,206 shares today in a range of 24.46-60.
BCE.PR.F was last mentioned on PrefBlog when the BCE.PR.E / BCE.PR.F Conversion Results were announced on 2010-1-19. BCE.PR.F is tracked by HIMIPref™ but is relegated to the Scraps index on credit concerns.
Posted in Issue Comments | No Comments »