The fund probably underperformed in December, although comparators are not yet available.
The fund’s Net Asset Value per Unit as of the close December 30 was $10.0793 after distribution of $0.162247 dividends and $0.299965 capital gains.
| Returns to December 30, 2011 |
| Period |
MAPF |
Index |
CPD
according to
Claymore |
| One Month |
+0.87% |
+1.48% |
+1.35% |
| Three Months |
+2.63% |
+2.50% |
+2.29% |
| One Year |
+1.78% |
+7.80% |
+5.23% |
| Two Years (annualized) |
+8.80% |
+8.95% |
N/A |
| Three Years (annualized) |
+25.33% |
+15.38% |
+12.29% |
| Four Years (annualized) |
+17.29% |
+6.44% |
|
| Five Years (annualized) |
+13.24% |
+3.79% |
|
| Six Years (annualized) |
+12.15% |
+3.87% |
|
| Seven Years (annualized) |
+11.24% |
+3.87% |
|
| Eight Years (annualized) |
+11.51% |
+4.13% |
|
| Nine Years (annualized) |
+13.77% |
+4.48% |
|
| Ten Years (annualized) |
+12.44% |
+4.47% |
|
| The Index is the BMO-CM “50” |
| MAPF returns assume reinvestment of distributions, and are shown after expenses but before fees. |
| CPD Returns are for the NAV and are after all fees and expenses. |
| * CPD does not directly report its two-year returns. |
| Figures for Omega Preferred Equity (which are after all fees and expenses) for 1-, 3- and 12-months are +1.13%, +2.19% and +5.55%, respectively, according to Morningstar after all fees & expenses. Three year performance is +13.35%. |
| Figures for Jov Leon Frazer Preferred Equity Fund Class I Units (which are after all fees and expenses) for 1-, 3- and 12-months are +1.04%, +1.91% and +3.43% respectively, according to Morningstar |
| Figures for Manulife Preferred Income Fund (formerly AIC Preferred Income Fund) (which are after all fees and expenses) for 1-, 3- and 12-months are +1.22%, +1.80% & +4.66%, respectively |
| Figures for Horizons AlphaPro Preferred Share ETF (which are after all fees and expenses) for 1-, 3- and 12-months are +1.61%, +2.57% & +6.36%, respectively. |
MAPF returns assume reinvestment of dividends, and are shown after expenses but before fees. Past performance is not a guarantee of future performance. You can lose money investing in Malachite Aggressive Preferred Fund or any other fund. For more information, see the fund’s main page. The fund is available either directly from Hymas Investment Management or through a brokerage account at Odlum Brown Limited.
My assumption that the fund underperformed in December is based on the performance of the S&P/TSX Preferred Share Index (TXPR) Total Return Index, for which preliminary figures show a return of +1.37% for the month (although the quarter was OK, with the fund gaining 2.63%, vs. +2.35% for TXPR). However, this return is based on the closing price, not the closing bid, and these figures were significantly different this year.
| Closing Prices vs. Last Bid for Some Preferred Share Positions Held by MAPF |
| Ticker |
Proportion of MAPF Holdings |
Last Bid |
Closing Price |
| BNA.PR.C |
9.9% |
21.98 |
22.10 |
| GWO.PR.H |
9.3% |
23.70 |
23.92 |
| MFC.PR.C |
8.5% |
21.66 |
21.74 |
| GWO.PR.I |
8.5% |
22.55 |
22.56 |
| SLF.PR.D |
7.8% |
20.81 |
20.85 |
In all, the difference in valuation for the whole fund is about $25,000, or about 0.5% of fund value.
Naturally, this is not a full explanation – ideally, we would know what the difference was at November month-end and compare the two differences. I will say, however, that in the course of valuing the fund I was surprised at the size of the discrepency, which is a number I usually just glance at and discard, since it has no real meaning.
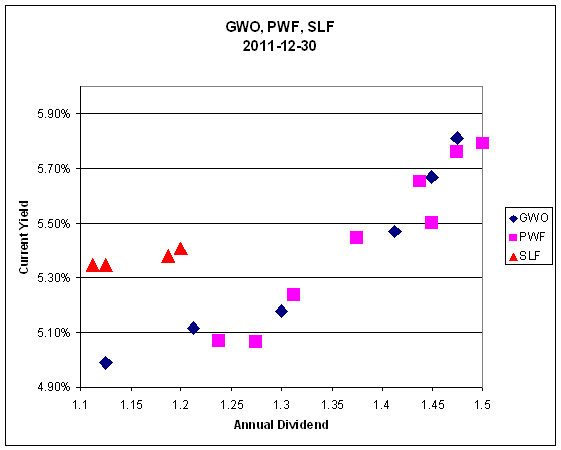
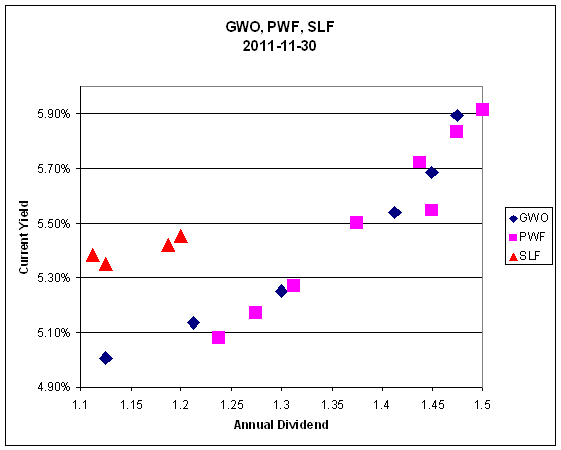
Fund returns in December were dragged down by poor performance in low-coupon DeemedRetractibles. SLF, in particular, has been afflicted in recent months by relatively poor financial results and bouts of selling (see Who’s Selling all the SLF Preferreds? and Moody’s puts SLF on Review-Negative) and has not yet shown significant signs of recovery.
SLF issues may be compared with PWF and GWO:
 Click for Big
 Click for Big
Now, I certainly agree that GWO is a better credit than SLF and deserves a little bit of premium pricing – but the current situation goes far beyond what I consider reasonable. What is also very interesting is the observation that the market is sharply differentiating between SLF and GWO, but not between GWO and its unregulated parent, PWF.
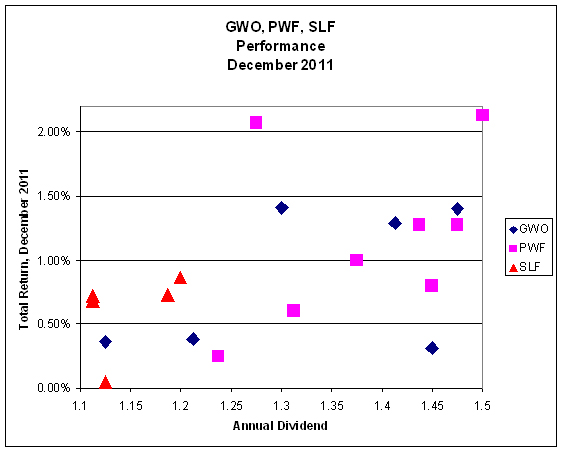
The import of the above charts becomes more clear when we examine the December performance for the same issues:
 Click for Big
While the SLF issues did fairly well when compared against other insurance and insurance-related Straight Perpetuals, there was a clear bias towards higher returns for the higher coupon issues – and the fund is concentrated in the low-coupon issues.
Further, I consider the comparison between SLF and WN to be absolutely fascinating:
SLF vs WN
Straight Perpetuals
2011-12-30 |
| Ticker |
Dividend |
Bid |
Current
Yield |
| SLF.PR.A |
1.1875 |
22.07 |
5.38% |
| SLF.PR.B |
1.20 |
22.20 |
5.41% |
| SLF.PR.C |
1.1125 |
20.81 |
5.35% |
| SLF.PR.D |
1.1125 |
20.81 |
5.35% |
| SLF.PR.E |
1.125 |
21.04 |
5.35% |
| WN.PR.A |
1.45 |
25.46 |
5.70% |
| WN.PR.C |
1.30 |
25.01 |
5.20% |
| WN.PR.D |
1.30 |
24.95 |
5.21% |
| WN.PR.E |
1.1875 |
23.93 |
4.96% |
Aside from the outlier WN.PR.A, which is currently redeemable at 25.00, it is clear that the WN issues are trading at lower Current Yields than the SLF issues (there’s minimal jiggery-pokery regarding the next dividend; the SLF issues go ex-dividend on about February 21, while WN.PR.A is at the end of February and the other WN issues go ex in mid-March).
In order to rationalize the relationship between the Current Yields we are asked to believe:
- That the additional credit quality of SLF is worthless
- It is possible, of course, to argue that WN is actually a better credit than SLF, or that the scarcity value of a non-financial preferred outweighs the difference in credit. I have not yet heard these arguments being made
- The option value of the issuer’s call is worthless
- This can be phrased as ‘The potential capital gain for the SLF issues prior to a call, relative to that of the WN issues, is worthless’
- The potential of a regulatory inspired call for the SLF issues is worthless
- the SLF issues are currently Tier 1 Capital at the holding company level, but do not have an NVCC clause
All in all, this is a good indication of what I don’t understand about what the market has been doing this year and a big factor in the fund’s underperformance.
Another factor, for the year and for December, has been the performance of the YLO issues. These performed poorly in December and reduced the fund’s return for the month by about 36bp. I continue to be surprised at just how poorly these issues are surprising: I will certainly agree that YLO was never the best of all possible credits, and will also agree that their financial position has deteriorated over the year – but the company remains significantly profitable (on an operating basis) and cash-flow positive; but the preferreds are trading as if they are on the steps of bankruptcy court.
According to me, the worst-case realistic scenario for YLO is not bankruptcy court, but a reorganization in which the bond holders take over the company. This will be bad news for the common shareholders, and for holders of the two issues which can be converted by the company into common (YLO.PR.A and YLO.PR.B), but the prospects for the two FixedResets (YLO.PR.C and YLO.PR.D) are much less clear even given further financial deterioration and angry bondholders.
Sometimes everything works … sometimes the trading works, but sectoral shifts overwhelm the increment … sometimes nothing works – and in 2011 circumstances were closer to the third possibility than they have generally been in the past. The fund seeks to earn incremental return by selling liquidity (that is, taking the other side of trades that other market participants are strongly motivated to execute), which can also be referred to as ‘trading noise’. There were a lot of strongly motivated market participants during the Panic of 2007, generating a lot of noise! Unfortunately, the conditions of the Panic may never be repeated in my lifetime … but the fund will simply attempt to make trades when swaps seem profitable, without worrying about the level of monthly turnover.
There’s plenty of room for new money left in the fund. I have shown in recent issues of PrefLetter that market pricing for FixedResets is demonstrably stupid and I have lots of confidence – backed up by my bond portfolio management experience in the markets for Canadas and Treasuries, and equity trading on the NYSE & TSX – that there is enough demand for liquidity in any market to make the effort of providing it worthwhile (although the definition of “worthwhile” in terms of basis points of outperformance changes considerably from market to market!) I will continue to exert utmost efforts to outperform but it should be borne in mind that there will almost inevitably be periods of underperformance in the future.
The yields available on high quality preferred shares remain elevated, which is reflected in the current estimate of sustainable income.
| Calculation of MAPF Sustainable Income Per Unit |
| Month |
NAVPU |
Portfolio
Average
YTW |
Leverage
Divisor |
Securities
Average
YTW |
Capital
Gains
Multiplier |
Sustainable
Income
per
current
Unit |
| June, 2007 |
9.3114 |
5.16% |
1.03 |
5.01% |
1.3240 |
0.3524 |
| September |
9.1489 |
5.35% |
0.98 |
5.46% |
1.3240 |
0.3773 |
| December, 2007 |
9.0070 |
5.53% |
0.942 |
5.87% |
1.3240 |
0.3993 |
| March, 2008 |
8.8512 |
6.17% |
1.047 |
5.89% |
1.3240 |
0.3938 |
| June |
8.3419 |
6.034% |
0.952 |
6.338% |
1.3240 |
$0.3993 |
| September |
8.1886 |
7.108% |
0.969 |
7.335% |
1.3240 |
$0.4537 |
| December, 2008 |
8.0464 |
9.24% |
1.008 |
9.166% |
1.3240 |
$0.5571 |
| March 2009 |
$8.8317 |
8.60% |
0.995 |
8.802% |
1.3240 |
$0.5872 |
| June |
10.9846 |
7.05% |
0.999 |
7.057% |
1.3240 |
$0.5855 |
| September |
12.3462 |
6.03% |
0.998 |
6.042% |
1.3240 |
$0.5634 |
| December 2009 |
10.5662 |
5.74% |
0.981 |
5.851% |
1.1141 |
$0.5549 |
| March 2010 |
10.2497 |
6.03% |
0.992 |
6.079% |
1.1141 |
$0.5593 |
| June |
10.5770 |
5.96% |
0.996 |
5.984% |
1.1141 |
$0.5681 |
| September |
11.3901 |
5.43% |
0.980 |
5.540% |
1.1141 |
$0.5664 |
| December 2010 |
10.7659 |
5.37% |
0.993 |
5.408% |
1.0298 |
$0.5654 |
| March, 2011 |
11.0560 |
6.00% |
0.994 |
5.964% |
1.0298 |
$0.6403 |
| June |
11.1194 |
5.87% |
1.018 |
5.976% |
1.0298 |
$0.6453 |
| September |
10.2709 |
6.10%
Note |
1.001 |
6.106% |
1.0298 |
$0.6090 |
| December, 2011 |
10.0793 |
5.63%
Note |
1.031 |
5.805% |
1.0000 |
$0.5851 |
NAVPU is shown after quarterly distributions of dividend income and annual distribution of capital gains.
Portfolio YTW includes cash (or margin borrowing), with an assumed interest rate of 0.00%
The Leverage Divisor indicates the level of cash in the account: if the portfolio is 1% in cash, the Leverage Divisor will be 0.99
Securities YTW divides “Portfolio YTW” by the “Leverage Divisor” to show the average YTW on the securities held; this assumes that the cash is invested in (or raised from) all securities held, in proportion to their holdings.
The Capital Gains Multiplier adjusts for the effects of Capital Gains Dividends. On 2009-12-31, there was a capital gains distribution of $1.989262 which is assumed for this purpose to have been reinvested at the final price of $10.5662. Thus, a holder of one unit pre-distribution would have held 1.1883 units post-distribution; the CG Multiplier reflects this to make the time-series comparable. Note that Dividend Distributions are not assumed to be reinvested.
Sustainable Income is the resultant estimate of the fund’s dividend income per current unit, before fees and expenses. Note that a “current unit” includes reinvestment of prior capital gains; a unitholder would have had the calculated sustainable income with only, say, 0.9 units in the past which, with reinvestment of capital gains, would become 1.0 current units. |
| DeemedRetractibles are comprised of all Straight Perpetuals (both PerpetualDiscount and PerpetualPremium) issued by BMO, BNS, CM, ELF, GWO, HSB, IAG, MFC, NA, RY, SLF and TD, which are not exchangable into common at the option of the company (definition refined in May). These issues are analyzed as if their prospectuses included a requirement to redeem at par on or prior to 2022-1-31, in addition to the call schedule explicitly defined. See OSFI Does Not Grandfather Extant Tier 1 Capital, CM.PR.D, CM.PR.E, CM.PR.G: Seeking NVCC Status and the January, February, March and June, 2011, editions of PrefLetter for the rationale behind this analysis. |
| Yields for September, 2011, to December, 2011, were calculated by imposing a cap of 10% on the yields of YLO issues held, in order to avoid their extremely high calculated yields distorting the calculation and to reflect the uncertainty in the marketplace that these yields will be realized. |
Significant positions were held in DeemedRetractible and FixedReset issues on December 30; all of the former and most of the latter currently have their yields calculated with the presumption that they will be called by the issuers at par prior to 2022-1-31. This presents another complication in the calculation of sustainable yield. The fund also holds a position in SplitShare issues (mainly BNA.PR.C) and an OperatingRetractible Scrap (YLO.PR.B) which also have their yields calculated with the expectation of a maturity at par, a somewhat dubious assumption in the latter case.
However, if the entire portfolio except for the PerpetualDiscounts were to be sold and reinvested in these issues, the yield of the portfolio would be the 5.69% shown in the MAPF Portfolio Composition: December 2011 analysis (which is greater than the 5.12% index yield on November 30). Given such reinvestment, the sustainable yield would be ($10.0793 + 0.162247) * 0.0569 = $0.5827 (note the adjustment for the dividend distribution, which makes the figure more comparable to November’s), down somewhat from the $10.4511 * 0.0579 / 1.0298 = 0.5876 (note the adjustment for capital gains reinvestment) reported for November.
Still, I am pleased that although the market value of the portfolio has not kept up with expectations, the sustainable income per unit (adjusted for capital gains) did increase by $0.02 over the year … do that often enough and eventually market value will reflect the underlying performance!
Different assumptions lead to different results from the calculation, but the overall positive trend is apparent. I’m very pleased with the results! It will be noted that if there was no trading in the portfolio, one would expect the sustainable yield to be constant (before fees and expenses). The success of the fund’s trading is showing up in
- the very good performance against the index
- the long term increases in sustainable income per unit
As has been noted, the fund has maintained a credit quality equal to or better than the index; outperformance is due to constant exploitation of trading anomalies.
Again, there are no predictions for the future! The fund will continue to trade between issues in an attempt to exploit market gaps in liquidity, in an effort to outperform the index and keep the sustainable income per unit – however calculated! – growing.


