Archive for February, 2012

YLO Suspends Preferred Dividends

Thursday, February 9th, 2012

Yellow Media has announced:

Net earnings per share from continuing operations before the impairment charge for 2011 were $0.29 compared to net earnings per share from continuing operations of $0.42 in 2010. Adjusted earnings per common share from continuing operations for the year were $0.53 versus $0.84 last year due to lower EBITDA and increased cash taxes.

Revenues decreased 5.2% from $1.40 billion to $1.33 billion, due to lower print revenues as well as lower revenues associated with the Company’s U.S. operations. This was partly offset by higher organic online revenues and revenues generated from Canpages and Mediative. Online revenues in 2011 were $346.1 million representing growth of 30% versus last year’s results.

Income from operations before the impairment charge was $484.9 million in 2011 compared to $514.9 million in 2010. EBITDA for the year declined from $757.1 million to $679.7 million and the EBITDA margin for 2011 was 51.1% compared to 54.0% last year. The decrease is mainly attributable to print revenue pressure, lower margins associated with Canpages, investments in the national digital division Mediative and in support of the Company’s transformation.

EBITDA for the fourth quarter declined from $161.3 million to $147.2 million while EBITDA margin was approximately 47.0% for the fourth quarter of 2011 and 2010.

The Company has begun evaluating alternatives to refinance maturities in 2012 and beyond. A broad range of alternatives will be considered and may involve the issuance of secured or unsecured debt, equity or other securities or other transactions. At this time, the Board of directors has decided to suspend the dividends on the outstanding series of preferred shares.

In connection with this review, the Board of directors of Yellow Media has established a committee of independent directors to serve as the Financing Committee of the Board (the “Financing Committee”) that will oversee this process with the objective of completing any transaction or transactions during the current fiscal year.

The Financing Committee is comprised of directors Anthony G. Miller, Michael T. Boychuk, John R. Gaulding and Bruce K. Robertson. Mr. Robertson will serve as Chair of the Financing Committee.

The Company also announced this morning three new appointments to its Board of Directors. David G. Leith, Bruce K. Robertson and Craig Forman will bring extensive knowledge of corporate finance, and corporate development and strategy within the technology, media and communications industries.

The new directors have dealmaking experience:

David G. Leith is Chair of MTS Allstream and Manitoba Telecom Services. Mr. Leith is also a trustee of TransGlobe Apartment REIT and a member of the Economic Advisory Panel of the Government of Ontario. Mr. Leith spent over 25 years at CIBC World Markets and its predecessors where he retired as Deputy Chairman of CIBC World Markets and Managing Director and Head of CIBC World Markets’ Investment, Corporate and Merchant Banking in 2009. Mr. Leith has a Bachelor of Arts from the University of Toronto and a Masters of Arts from Cambridge University.

Bruce K. Robertson serves as Principal at Grandview Capital, a Canadian merchant bank. Prior to Grandview Capital, Mr. Robertson was a senior officer at AbitibiBowater Inc. Mr. Robertson also served as Senior Managing Partner of Brookfield Asset Management Inc., a specialty asset management company. Mr. Robertson received his Bachelor of Commerce (Honours) from Queen’s University and is a Chartered Accountant.

I will provide more commentary in this month’s edition of PrefLetter, which will be prepared as of the close tomorrow for delivery to clients prior to the opening on Monday, February 13. But I will say that it is highly unusual for a profitable, cash-flow positive, company to suspend its preferred dividend.

YLO has four issues of preferreds outstanding: YLO.PR.A and YLO.PR.B (OperatingRetractible) and YLO.PR.C and YLO.PR.D (FixedReset). All are tracked by HIMIPref™; all are relegated to the Scraps index on credit concerns.

February 8, 2012

Wednesday, February 8th, 2012

ITG claims that high frequency trading in Canada is becoming less frequent:

“This quarter’s analysis of message traffic data reveals changes in trading behaviour that may signal the begginings of a new regime,” ITG’s analysts wrote. “Improvements in our metric for the quality of order flow, combined with a decline in fleeting orders points to a structural change amongst HFT participants.”

Why are HFTs backing away? Money.

Study author Doug Clark, a managing director at ITG, said that other markets are showing similar trends. That suggests that the business of high-frequency trading is so competitive that some players weren’t making money.

Also, brokerage houses are doing a better job of offering clients algorithms and routers that handle trading in ways that combat high frequency traders and cut their profits.

Zerohedge continues to whine about HFT. Institutional Investor breathlessly tells us of how some “real money” investors’ agents have attempted to remain competitive by the unheard of strategy of getting better at their jobs:

The electronic-trading team at RBC decided to fight back against the problem of “phantom” or “disappearing liquidity,” which they blamed on a subset of high frequency traders using “predatory” tactics. That is how they came up with THOR, a system to help clients such as institutional money managers combat predatory HFT strategies and complete trades at the desired price.

The system has been in use for a year, and Steiner says it has greatly improved liquidity for RBC and its clients — allowing them to execute orders at the desired price.

The real reason behind the fashionability of deprecating HFT can be found in the recent IIAC publication Securities Industry Performance 11Q3:

Even though trading revenue only accounts for about 10% of overall revenue, the severe collapse in net trading revenue of nearly 50% in the year, reflecting substantial losses for equity market-makers, put a significant dent in overall earnings.

The industry’s prop-traders are having their lunch eaten by HFT practitioners who didn’t even go to the right schools! The horror!

Lucas van Praag, world’s greatest corporate spokesman, is leaving Goldman Sachs:

Lucas van Praag, who became one of the public faces of the U.S. financial industry as Goldman Sachs Group Inc.’s global head of corporate communications, is leaving the firm after 12 years.

Van Praag, a 62-year-old British citizen, will retire at the end of March and continue to provide strategic advice as a consultant to the company, according to an internal memo signed by Chief Executive Officer Lloyd C. Blankfein and President Gary D. Cohn. The memo’s contents were confirmed by Michael DuVally, a spokesman. Van Praag was promoted to partner, the highest rank in the New York-based company, in 2006.

The Canadian preferred share market resumed its winning ways today, with PerpetualPremiums winning 18bp, FixedResets gaining 9bp and DeemedRetractibles up 18bp. Volatility was good and highly skewed to the upside, with SLF notable among the winners. Volume was average.

PerpetualDiscounts (those few that are left; only four issues from two issuers) now yield 4.80%, equivalent to 6.24% interest at the standard 1.3x equivalency factor. Long corporates now yield a hair under 4.6%, so the pre-tax interest equivalent spread is now about 165bp, a sharp decline from the 190bp reported on February 1.

HIMIPref™ Preferred Indices
These values reflect the December 2008 revision of the HIMIPref™ Indices

Values are provisional and are finalized monthly
Index Mean
Current
Yield
(at bid)
Median
YTW
Median
Average
Trading
Value
Median
Mod Dur
(YTW)
Issues Day’s Perf. Index Value
Ratchet 0.00 % 0.00 % 0 0.00 0 0.3490 % 2,437.8
FixedFloater 4.52 % 3.88 % 40,123 17.53 1 1.2048 % 3,447.0
Floater 2.74 % 2.96 % 61,095 19.80 3 0.3490 % 2,632.1
OpRet 4.81 % -1.35 % 68,310 1.27 6 0.0818 % 2,531.3
SplitShare 5.29 % -0.29 % 80,436 0.84 4 -0.1396 % 2,644.0
Interest-Bearing 0.00 % 0.00 % 0 0.00 0 0.0818 % 2,314.7
Perpetual-Premium 5.30 % -9.32 % 108,483 0.09 26 0.1840 % 2,232.5
Perpetual-Discount 5.02 % 4.80 % 194,744 15.75 4 0.2782 % 2,462.1
FixedReset 5.00 % 2.56 % 214,256 2.30 65 0.0885 % 2,400.9
Deemed-Retractible 4.86 % 2.03 % 223,536 1.03 45 0.1828 % 2,333.1
Performance Highlights
Issue Index Change Notes
ELF.PR.F Perpetual-Discount -1.01 % YTW SCENARIO
Maturity Type : Limit Maturity
Maturity Date : 2042-02-08
Maturity Price : 23.94
Evaluated at bid price : 24.50
Bid-YTW : 5.44 %
SLF.PR.D Deemed-Retractible 1.19 % YTW SCENARIO
Maturity Type : Hard Maturity
Maturity Date : 2022-01-31
Maturity Price : 25.00
Evaluated at bid price : 23.74
Bid-YTW : 5.19 %
BAM.PR.G FixedFloater 1.20 % YTW SCENARIO
Maturity Type : Limit Maturity
Maturity Date : 2042-02-08
Maturity Price : 21.81
Evaluated at bid price : 21.00
Bid-YTW : 3.88 %
BAM.PR.M Perpetual-Discount 1.38 % YTW SCENARIO
Maturity Type : Limit Maturity
Maturity Date : 2042-02-08
Maturity Price : 24.65
Evaluated at bid price : 24.95
Bid-YTW : 4.80 %
CIU.PR.A Perpetual-Premium 1.47 % YTW SCENARIO
Maturity Type : Call
Maturity Date : 2016-06-01
Maturity Price : 25.00
Evaluated at bid price : 25.50
Bid-YTW : 4.04 %
SLF.PR.E Deemed-Retractible 1.57 % YTW SCENARIO
Maturity Type : Hard Maturity
Maturity Date : 2022-01-31
Maturity Price : 25.00
Evaluated at bid price : 23.88
Bid-YTW : 5.17 %
FTS.PR.H FixedReset 1.92 % YTW SCENARIO
Maturity Type : Call
Maturity Date : 2015-06-01
Maturity Price : 25.00
Evaluated at bid price : 26.50
Bid-YTW : 2.62 %
Volume Highlights
Issue Index Shares
Traded
Notes
BNS.PR.Z FixedReset 243,630 Nesbitt crossed 140,000; RBC crossed 50,000; and TD crossed 30,200; all at 25.15.
YTW SCENARIO
Maturity Type : Hard Maturity
Maturity Date : 2022-01-31
Maturity Price : 25.00
Evaluated at bid price : 25.15
Bid-YTW : 3.07 %
CM.PR.M FixedReset 104,416 RBC crossed 49,900 and TD crossed 48,200, both at 27.35.
YTW SCENARIO
Maturity Type : Call
Maturity Date : 2014-07-31
Maturity Price : 25.00
Evaluated at bid price : 27.43
Bid-YTW : 2.52 %
RY.PR.C Deemed-Retractible 81,000 TD crossed 25,000 and bought two blocks of 10,000 each from RBC, all at 26.10; RBC crossed blocks of 13,900 and 16,300 at the same price.
YTW SCENARIO
Maturity Type : Call
Maturity Date : 2012-03-09
Maturity Price : 26.00
Evaluated at bid price : 26.09
Bid-YTW : -2.13 %
BMO.PR.P FixedReset 59,407 TD crossed 49,900 at 27.00.
YTW SCENARIO
Maturity Type : Call
Maturity Date : 2015-02-25
Maturity Price : 25.00
Evaluated at bid price : 27.02
Bid-YTW : 2.56 %
TD.PR.Y FixedReset 58,821 Desjardins bought 30,000 from anonymous at 26.00.
YTW SCENARIO
Maturity Type : Call
Maturity Date : 2013-10-31
Maturity Price : 25.00
Evaluated at bid price : 26.08
Bid-YTW : 2.61 %
TD.PR.E FixedReset 53,109 RBC crossed 47,300 at 27.10.
YTW SCENARIO
Maturity Type : Call
Maturity Date : 2014-04-30
Maturity Price : 25.00
Evaluated at bid price : 27.17
Bid-YTW : 2.29 %
There were 32 other index-included issues trading in excess of 10,000 shares.
Wide Spread Highlights
Issue Index Quote Data and Yield Notes
ELF.PR.F Perpetual-Discount Quote: 24.50 – 24.97
Spot Rate : 0.4700
Average : 0.3361

YTW SCENARIO
Maturity Type : Limit Maturity
Maturity Date : 2042-02-08
Maturity Price : 23.94
Evaluated at bid price : 24.50
Bid-YTW : 5.44 %

TCA.PR.X Perpetual-Premium Quote: 52.17 – 52.50
Spot Rate : 0.3300
Average : 0.2309

YTW SCENARIO
Maturity Type : Call
Maturity Date : 2013-10-15
Maturity Price : 50.00
Evaluated at bid price : 52.17
Bid-YTW : 3.03 %

TCA.PR.Y Perpetual-Premium Quote: 52.30 – 52.54
Spot Rate : 0.2400
Average : 0.1862

YTW SCENARIO
Maturity Type : Call
Maturity Date : 2014-03-05
Maturity Price : 50.00
Evaluated at bid price : 52.30
Bid-YTW : 3.36 %

ENB.PR.A Perpetual-Premium Quote: 26.45 – 26.64
Spot Rate : 0.1900
Average : 0.1365

YTW SCENARIO
Maturity Type : Call
Maturity Date : 2012-03-09
Maturity Price : 25.00
Evaluated at bid price : 26.45
Bid-YTW : -44.83 %

IFC.PR.A FixedReset Quote: 25.68 – 25.90
Spot Rate : 0.2200
Average : 0.1696

YTW SCENARIO
Maturity Type : Hard Maturity
Maturity Date : 2022-01-31
Maturity Price : 25.00
Evaluated at bid price : 25.68
Bid-YTW : 3.50 %

TD.PR.S FixedReset Quote: 25.96 – 26.10
Spot Rate : 0.1400
Average : 0.0902

YTW SCENARIO
Maturity Type : Call
Maturity Date : 2013-07-31
Maturity Price : 25.00
Evaluated at bid price : 25.96
Bid-YTW : 2.43 %

February 7, 2012

Tuesday, February 7th, 2012

This looks better than a government programme as a way to address delinquent underwater mortgages:

Banks, accelerating efforts to move troubled mortgages off their books, are offering as much as $35,000 or more in cash to delinquent homeowners to sell their properties for less than they owe.

Lenders have routinely delayed or blocked such transactions, known as short sales, in which they accept less from a buyer than the seller’s outstanding loan. Now banks have decided the deals are faster and less costly than foreclosures, which have slowed in response to regulatory probes of abusive practices. Banks are nudging potential sellers by pre-approving deals, streamlining the closing process, forgoing their right to pursue unpaid debt and in some cases providing large cash incentives, said Bill Fricke, senior credit officer for Moody’s Investors Service in New York.

What’s more, it seems like there is a direct connection with auto loans:

Three years ago, credit was so tight that the owner of a legal firm with a $400,000 salary and a very good credit score of more than 700 couldn’t get financed to buy the car he wanted from Michael Mosser’s dealership.

“The world is upside-down compared to then,” said Mosser, general manager of Chevrolet and Cadillac stores in Ann Arbor, Michigan. “Today, somebody with a 500 credit score, I can get approved and in a Malibu,” which starts at $22,110.

Lenders resisted extending credit to car buyers when the mortgage market collapsed in 2008, helping push General Motors Corp. and Chrysler LLC into bankruptcy and sending U.S. sales to the lowest point in almost three decades. Amid a slow housing market, auto demand is rebounding, spurring lenders from Bank of America Corp. to Capital One Financial Corp. to approve buyers faster and at better rates to compete for a piece of an expanding market.

Amazingly, another Greek deadline has been missed:

Greek political parties delayed yet again on Tuesday making the tough choice of accepting painful reforms in return for a new international bailout to avoid a chaotic default, seemingly deaf to EU warnings that the eurozone can live without Athens.

With a series of deadlines come and gone, leaders of the three parties in the coalition of Prime Minister Lucas Papademos postponed what was supposed to be a crunch meeting until Wednesday.

S&P affirmed AltaGas, proud issuer of ALA.PR.A:

  • AltaGas Ltd. has announced it is acquiring SEMCO Holding Corp., the sole shareholder of SEMCO Holding Corp. from Continental Energy Systems LLC for about C$1.1 billion.
  • We are affirming our ratings, including our ‘BBB’ long-term corporate credit rating, on AltaGas.
  • In our view, SEMCO has an excellent business risk profile and a highly leveraged financial risk profile.
  • We have revised AltaGas’ business risk profile to strong from satisfactory and financial risk profile to significant from aggressive, assuming the transaction closes as expected. The stable outlook reflects our assessment of the company’s business mix, which is increasingly diverse with a greater contribution from fee-based and regulated utility cash flows.

It was another down day for the Canadian preferred share market, with PerpetualPremiums off 16bp, FixedResets down 14bp and DeemedRetractibles losing 18bp. Volatility was minor. Volume was a little below average.

HIMIPref™ Preferred Indices
These values reflect the December 2008 revision of the HIMIPref™ Indices

Values are provisional and are finalized monthly
Index Mean
Current
Yield
(at bid)
Median
YTW
Median
Average
Trading
Value
Median
Mod Dur
(YTW)
Issues Day’s Perf. Index Value
Ratchet 0.00 % 0.00 % 0 0.00 0 0.0873 % 2,429.3
FixedFloater 4.58 % 3.94 % 40,384 17.43 1 1.7157 % 3,405.9
Floater 2.75 % 2.96 % 60,470 19.81 3 0.0873 % 2,623.0
OpRet 4.81 % -1.55 % 67,518 1.28 6 -0.1570 % 2,529.3
SplitShare 5.28 % 0.17 % 80,213 0.84 4 -0.1095 % 2,647.7
Interest-Bearing 0.00 % 0.00 % 0 0.00 0 -0.1570 % 2,312.8
Perpetual-Premium 5.31 % -8.57 % 109,187 0.09 26 -0.1643 % 2,228.4
Perpetual-Discount 5.04 % 4.86 % 194,681 15.66 4 0.1134 % 2,455.3
FixedReset 5.01 % 2.58 % 221,449 2.31 65 -0.1355 % 2,398.8
Deemed-Retractible 4.86 % 2.12 % 222,967 1.18 45 -0.1850 % 2,328.9
Performance Highlights
Issue Index Change Notes
TD.PR.P Deemed-Retractible -1.33 % YTW SCENARIO
Maturity Type : Call
Maturity Date : 2012-11-01
Maturity Price : 26.00
Evaluated at bid price : 26.67
Bid-YTW : 1.64 %
IAG.PR.C FixedReset -1.26 % YTW SCENARIO
Maturity Type : Call
Maturity Date : 2013-12-31
Maturity Price : 25.00
Evaluated at bid price : 26.60
Bid-YTW : 3.07 %
CIU.PR.A Perpetual-Premium -1.06 % YTW SCENARIO
Maturity Type : Call
Maturity Date : 2016-06-01
Maturity Price : 25.00
Evaluated at bid price : 25.13
Bid-YTW : 4.42 %
BAM.PR.G FixedFloater 1.72 % YTW SCENARIO
Maturity Type : Limit Maturity
Maturity Date : 2042-02-07
Maturity Price : 21.70
Evaluated at bid price : 20.75
Bid-YTW : 3.94 %
Volume Highlights
Issue Index Shares
Traded
Notes
TRP.PR.B FixedReset 114,960 Desjardins crossed 108,900 at 25.80.
YTW SCENARIO
Maturity Type : Limit Maturity
Maturity Date : 2042-02-07
Maturity Price : 23.56
Evaluated at bid price : 25.75
Bid-YTW : 2.58 %
BNS.PR.Z FixedReset 86,379 Desjardins bought 31,200 from Nesbitt at 25.15 and 20,000 from RBC at the same price.
YTW SCENARIO
Maturity Type : Hard Maturity
Maturity Date : 2022-01-31
Maturity Price : 25.00
Evaluated at bid price : 25.16
Bid-YTW : 3.06 %
BNS.PR.M Deemed-Retractible 36,400 TD crossed 20,000 at 26.25.
YTW SCENARIO
Maturity Type : Call
Maturity Date : 2012-07-27
Maturity Price : 26.00
Evaluated at bid price : 26.24
Bid-YTW : 2.53 %
MFC.PR.D FixedReset 28,122 TD crossed 20,500 at 27.40.
YTW SCENARIO
Maturity Type : Call
Maturity Date : 2014-06-19
Maturity Price : 25.00
Evaluated at bid price : 27.29
Bid-YTW : 2.98 %
SLF.PR.B Deemed-Retractible 26,659 YTW SCENARIO
Maturity Type : Hard Maturity
Maturity Date : 2022-01-31
Maturity Price : 25.00
Evaluated at bid price : 24.28
Bid-YTW : 5.27 %
BAM.PR.N Perpetual-Discount 26,487 YTW SCENARIO
Maturity Type : Limit Maturity
Maturity Date : 2042-02-07
Maturity Price : 24.20
Evaluated at bid price : 24.70
Bid-YTW : 4.84 %
There were 27 other index-included issues trading in excess of 10,000 shares.
Wide Spread Highlights
Issue Index Quote Data and Yield Notes
BAM.PR.G FixedFloater Quote: 20.75 – 21.40
Spot Rate : 0.6500
Average : 0.4235

YTW SCENARIO
Maturity Type : Limit Maturity
Maturity Date : 2042-02-07
Maturity Price : 21.70
Evaluated at bid price : 20.75
Bid-YTW : 3.94 %

TD.PR.P Deemed-Retractible Quote: 26.67 – 27.03
Spot Rate : 0.3600
Average : 0.2280

YTW SCENARIO
Maturity Type : Call
Maturity Date : 2012-11-01
Maturity Price : 26.00
Evaluated at bid price : 26.67
Bid-YTW : 1.64 %

ELF.PR.G Perpetual-Discount Quote: 23.01 – 23.59
Spot Rate : 0.5800
Average : 0.4601

YTW SCENARIO
Maturity Type : Limit Maturity
Maturity Date : 2042-02-07
Maturity Price : 22.60
Evaluated at bid price : 23.01
Bid-YTW : 5.19 %

BAM.PR.M Perpetual-Discount Quote: 24.61 – 24.87
Spot Rate : 0.2600
Average : 0.1615

YTW SCENARIO
Maturity Type : Limit Maturity
Maturity Date : 2042-02-07
Maturity Price : 24.16
Evaluated at bid price : 24.61
Bid-YTW : 4.86 %

RY.PR.P FixedReset Quote: 26.84 – 27.10
Spot Rate : 0.2600
Average : 0.1639

YTW SCENARIO
Maturity Type : Call
Maturity Date : 2014-02-24
Maturity Price : 25.00
Evaluated at bid price : 26.84
Bid-YTW : 2.42 %

IAG.PR.C FixedReset Quote: 26.60 – 26.85
Spot Rate : 0.2500
Average : 0.1640

YTW SCENARIO
Maturity Type : Call
Maturity Date : 2013-12-31
Maturity Price : 25.00
Evaluated at bid price : 26.60
Bid-YTW : 3.07 %

CZP.PR.A & CZP.PR.B: Ticker Change to AZP.PR.A & AZP.PR.B

Tuesday, February 7th, 2012

Atlantic Power has announced:

Capital Power Income L.P. (the Partnership) and CPI Preferred Equity Ltd. (TSX: CZP.PR.A and CZP.PR.B) (the Corporation), subsidiaries of Atlantic Power Corporation (Atlantic Power), announced that the Partnership has changed its name to “Atlantic Power Limited Partnership” and the Corporation has changed its name to “Atlantic Power Preferred Equity Ltd.”.

In connection with the Corporation’s name change, the Cumulative Redeemable Preferred Shares, Series 1 of the Corporation and the Cumulative Rate Reset Preferred Shares, Series 2 of the Corporation (which prior to the name change traded on the Toronto Stock Exchange under the symbols “CZP.PR.A” and “CZP.PR.B”, respectively), will begin trading on the Toronto Stock Exchange under the symbols “AZP.PR.A” and “AZP.PR.B”, respectively. It is expected that the preferred shares of the Corporation will begin trading on the Toronto Stock Exchange under the new symbols at the opening of business on or about February 7, 2012.

The name changes were made in connection with the acquisition of the Partnership by Atlantic Power completed on November 5, 2011.

These issues were last mentioned on PrefBlog when they were downgraded to P-4(low) by S&P. I also noted the DBRS update on January 31.

Both these issues are tracked by HIMIPref™ but are relegated to the Scraps index on credit concerns.

February 6, 2012

Tuesday, February 7th, 2012

Bloomberg has an interesting story about the legal snarl of an effective Greek default:

Hedge funds seeking to wring profits from a Greek debt restructuring are underestimating the will of policy makers to impose losses on them, according to investors who say trying to beat the politicians is too risky.

European banks own most of the 200 billion euros ($263 billion) of Greek debt held by non-government investors. Hedge funds, pension funds, sovereign wealth funds and other “non- regulated investors,” own a further 60 billion euros, according to estimates by Pavan Wadhwa, JPMorgan Chase & Co.’s head of global interest-rate strategy.

Because hedge funds and other holders could collectively keep the participation rate below that level, Greece has said it may approve legislation that imposes losses on investors who don’t support the voluntary swap by adding a retroactive collective action clause into its bond documentation. Such a provision would give a majority of bondholders the ability to force holdouts to accept the same terms as everyone else.

It will be difficult for holdouts to assemble enough votes to block any collective action clause, because European banks have an incentive to support the provision, fund managers said.

A lawsuit against a collective-action clause legislated by the Greek government may also be difficult to win, because it would probably have to be filed in Greece, said a hedge-fund executive whose firm holds the country’s debt and has examined the legal options.

Never play poker with somebody who can change the rules! The question is: will anybody in their right minds ever buy Greek debt again? Or any European’s?

DBRS confirmed GMP.PR.B at Pfd-3(low):

DBRS has confirmed the Pfd-3 (low) rating on the Preferred Share obligations of GMP Capital Inc. (GMP or the Company) with a Stable trend. The rating reflects the strength of the Company’s business franchise as a premier provider of investment banking and capital markets products and services to its targeted market of mid-sized Canadian companies, most of whom operate in the resource and energy sectors. Following the issue of preferred shares in early 2011, the Company’s capitalization has become relatively more aggressive as a result of $66 million in share buybacks completed during the first nine months of 2011. At current levels of financial leverage, the Company’s financial flexibility is somewhat impaired. A continued slump in underwriting and trading activities, which DBRS does not expect to recover in the short to medium term given the weak global economic outlook and continued absence of investor confidence, will prevent a material improvement in this condition in the medium term. Nevertheless, DBRS remains comfortable with the Pfd-3 (low) rating, given the Company’s flexible cost base and its excess regulatory capital at its operating subsidiaries.

The recent run-up in the Canadian preferred share market took a pause today, with PerpetualPremiums down 7bp, FixedResets off 2bp and DeemedRetractibles losing 13bp. Volatility was significant and fairly evenly distributed between asset classes, winners and losers. Volume was average.

HIMIPref™ Preferred Indices
These values reflect the December 2008 revision of the HIMIPref™ Indices

Values are provisional and are finalized monthly
Index Mean
Current
Yield
(at bid)
Median
YTW
Median
Average
Trading
Value
Median
Mod Dur
(YTW)
Issues Day’s Perf. Index Value
Ratchet 0.00 % 0.00 % 0 0.00 0 -0.1917 % 2,427.2
FixedFloater 4.66 % 4.03 % 38,353 17.30 1 0.7407 % 3,348.5
Floater 2.75 % 2.96 % 61,127 19.81 3 -0.1917 % 2,620.7
OpRet 4.80 % -1.38 % 66,427 1.28 6 0.0566 % 2,533.2
SplitShare 5.28 % -0.29 % 79,904 0.84 4 0.3447 % 2,650.6
Interest-Bearing 0.00 % 0.00 % 0 0.00 0 0.0566 % 2,316.4
Perpetual-Premium 5.30 % -8.51 % 109,775 0.09 26 -0.0691 % 2,232.1
Perpetual-Discount 5.04 % 4.88 % 192,811 15.62 4 -0.1545 % 2,452.5
FixedReset 5.00 % 2.48 % 225,863 2.31 65 -0.0250 % 2,402.0
Deemed-Retractible 4.86 % 1.58 % 225,221 0.96 45 -0.1266 % 2,333.2
Performance Highlights
Issue Index Change Notes
GWO.PR.G Deemed-Retractible -2.41 % YTW SCENARIO
Maturity Type : Call
Maturity Date : 2013-12-31
Maturity Price : 25.00
Evaluated at bid price : 25.51
Bid-YTW : 4.38 %
PWF.PR.F Perpetual-Premium -1.75 % YTW SCENARIO
Maturity Type : Call
Maturity Date : 2012-03-07
Maturity Price : 25.00
Evaluated at bid price : 25.32
Bid-YTW : -9.16 %
PWF.PR.K Perpetual-Premium -1.42 % YTW SCENARIO
Maturity Type : Call
Maturity Date : 2013-10-31
Maturity Price : 25.25
Evaluated at bid price : 25.64
Bid-YTW : 4.04 %
CU.PR.C FixedReset -1.11 % YTW SCENARIO
Maturity Type : Call
Maturity Date : 2017-06-01
Maturity Price : 25.00
Evaluated at bid price : 25.95
Bid-YTW : 3.18 %
CM.PR.K FixedReset -1.07 % YTW SCENARIO
Maturity Type : Call
Maturity Date : 2014-07-31
Maturity Price : 25.00
Evaluated at bid price : 26.75
Bid-YTW : 2.48 %
MFC.PR.C Deemed-Retractible -1.00 % YTW SCENARIO
Maturity Type : Hard Maturity
Maturity Date : 2022-01-31
Maturity Price : 25.00
Evaluated at bid price : 23.69
Bid-YTW : 5.29 %
SLF.PR.G FixedReset 1.02 % YTW SCENARIO
Maturity Type : Hard Maturity
Maturity Date : 2022-01-31
Maturity Price : 25.00
Evaluated at bid price : 24.80
Bid-YTW : 3.49 %
BNS.PR.X FixedReset 1.07 % YTW SCENARIO
Maturity Type : Call
Maturity Date : 2014-04-25
Maturity Price : 25.00
Evaluated at bid price : 27.42
Bid-YTW : 1.82 %
BNA.PR.E SplitShare 1.16 % YTW SCENARIO
Maturity Type : Hard Maturity
Maturity Date : 2017-12-10
Maturity Price : 25.00
Evaluated at bid price : 24.52
Bid-YTW : 5.43 %
CIU.PR.A Perpetual-Premium 1.40 % YTW SCENARIO
Maturity Type : Call
Maturity Date : 2016-06-01
Maturity Price : 25.00
Evaluated at bid price : 25.40
Bid-YTW : 4.14 %
Volume Highlights
Issue Index Shares
Traded
Notes
BNS.PR.Z FixedReset 313,461 Desjardins crossed 101,000 at 25.10. RBC and Nesbitt both crossed 100,000 at 25.15 each.
YTW SCENARIO
Maturity Type : Hard Maturity
Maturity Date : 2022-01-31
Maturity Price : 25.00
Evaluated at bid price : 25.12
Bid-YTW : 3.08 %
BAM.PR.N Perpetual-Discount 74,740 Nesbitt crossed 62,300 at 24.68.
YTW SCENARIO
Maturity Type : Limit Maturity
Maturity Date : 2042-02-06
Maturity Price : 23.98
Evaluated at bid price : 24.48
Bid-YTW : 4.88 %
SLF.PR.E Deemed-Retractible 47,629 YTW SCENARIO
Maturity Type : Hard Maturity
Maturity Date : 2022-01-31
Maturity Price : 25.00
Evaluated at bid price : 23.29
Bid-YTW : 5.49 %
BMO.PR.L Deemed-Retractible 42,930 Desjardins sold 11,300 to National at 27.65 and another 10,000 to TD at the same price.
YTW SCENARIO
Maturity Type : Call
Maturity Date : 2013-05-25
Maturity Price : 26.00
Evaluated at bid price : 27.62
Bid-YTW : 0.52 %
SLF.PR.A Deemed-Retractible 30,498 YTW SCENARIO
Maturity Type : Hard Maturity
Maturity Date : 2022-01-31
Maturity Price : 25.00
Evaluated at bid price : 24.38
Bid-YTW : 5.16 %
BMO.PR.M FixedReset 29,950 Scotia crossed 25,000 at 25.90.
YTW SCENARIO
Maturity Type : Call
Maturity Date : 2013-08-25
Maturity Price : 25.00
Evaluated at bid price : 25.95
Bid-YTW : 2.35 %
There were 33 other index-included issues trading in excess of 10,000 shares.
Wide Spread Highlights
Issue Index Quote Data and Yield Notes
PWF.PR.A Floater Quote: 21.75 – 22.60
Spot Rate : 0.8500
Average : 0.6074

YTW SCENARIO
Maturity Type : Limit Maturity
Maturity Date : 2042-02-06
Maturity Price : 21.49
Evaluated at bid price : 21.75
Bid-YTW : 2.38 %

GWO.PR.G Deemed-Retractible Quote: 25.51 – 25.84
Spot Rate : 0.3300
Average : 0.2229

YTW SCENARIO
Maturity Type : Call
Maturity Date : 2013-12-31
Maturity Price : 25.00
Evaluated at bid price : 25.51
Bid-YTW : 4.38 %

RY.PR.F Deemed-Retractible Quote: 26.10 – 26.38
Spot Rate : 0.2800
Average : 0.1733

YTW SCENARIO
Maturity Type : Call
Maturity Date : 2012-05-24
Maturity Price : 26.00
Evaluated at bid price : 26.10
Bid-YTW : 2.26 %

PWF.PR.H Perpetual-Premium Quote: 25.46 – 25.79
Spot Rate : 0.3300
Average : 0.2253

YTW SCENARIO
Maturity Type : Call
Maturity Date : 2012-03-07
Maturity Price : 25.00
Evaluated at bid price : 25.46
Bid-YTW : -14.92 %

RY.PR.H Deemed-Retractible Quote: 27.21 – 27.53
Spot Rate : 0.3200
Average : 0.2207

YTW SCENARIO
Maturity Type : Call
Maturity Date : 2013-05-24
Maturity Price : 26.00
Evaluated at bid price : 27.21
Bid-YTW : 1.58 %

FTS.PR.E OpRet Quote: 28.08 – 28.50
Spot Rate : 0.4200
Average : 0.3317

YTW SCENARIO
Maturity Type : Call
Maturity Date : 2013-06-01
Maturity Price : 25.75
Evaluated at bid price : 28.08
Bid-YTW : -1.38 %

MAPF Performance: January 2012

Sunday, February 5th, 2012

The fund strongly outperformed in January as the fund’s long-standing overweighting in insurance company Straight Perpetuals finally paid off.

The fund’s Net Asset Value per Unit as of the close January 31, 2012, was 10.6827.

Returns to January 31, 2012
Period MAPF Index CPD
according to
Claymore
One Month +5.99% +1.70% +1.68%
Three Months +6.50% +3.63% +3.16%
One Year +4.60% +7.88% +6.08%
Two Years (annualized) +10.99% +9.53% N/A
Three Years (annualized) +23.61% +14.53% +11.72%
Four Years (annualized) +18.63% +6.66%  
Five Years (annualized) +14.79% +4.15%  
Six Years (annualized) +13.20% +4.17%  
Seven Years (annualized) +12.10% +4.07%  
Eight Years (annualized) +12.04% +4.13%  
Nine Years (annualized) +13.64% +4.63%  
Ten Years (annualized) +12.50% +4.44%  
The Index is the BMO-CM “50”
MAPF returns assume reinvestment of distributions, and are shown after expenses but before fees.
CPD Returns are for the NAV and are after all fees and expenses.
* CPD does not directly report its two-year returns.
Figures for Omega Preferred Equity (which are after all fees and expenses) for 1-, 3- and 12-months are +1.90%, +3.25% and +6.24%, respectively, according to Morningstar after all fees & expenses. Three year performance is +12.74%.
Figures for Jov Leon Frazer Preferred Equity Fund Class I Units (which are after all fees and expenses) for 1-, 3- and 12-months are +1.04%, +1.91% and +3.43% respectively, according to Morningstar
Figures for Manulife Preferred Income Fund (formerly AIC Preferred Income Fund) (which are after all fees and expenses) for 1-, 3- and 12-months are +1.55%, +2.96% & +5.57%, respectively
Figures for Horizons AlphaPro Preferred Share ETF (which are after all fees and expenses) for 1-, 3- and 12-months are +1.61%, +2.75% & +6.36%, respectively.

MAPF returns assume reinvestment of dividends, and are shown after expenses but before fees. Past performance is not a guarantee of future performance. You can lose money investing in Malachite Aggressive Preferred Fund or any other fund. For more information, see the fund’s main page. The fund is available either directly from Hymas Investment Management or through a brokerage account at Odlum Brown Limited.

Fund returns in January were helped substantially by a very dramatic narrowing of the difference between bank-issued Straight Perpetuals and those issued by insurers and others. The following chart shows the difference in bid price between CM.PR.J and GWO.PR.I, which pay the same annual dividend. No correction has been made for the difference in ex-Dividend dates:
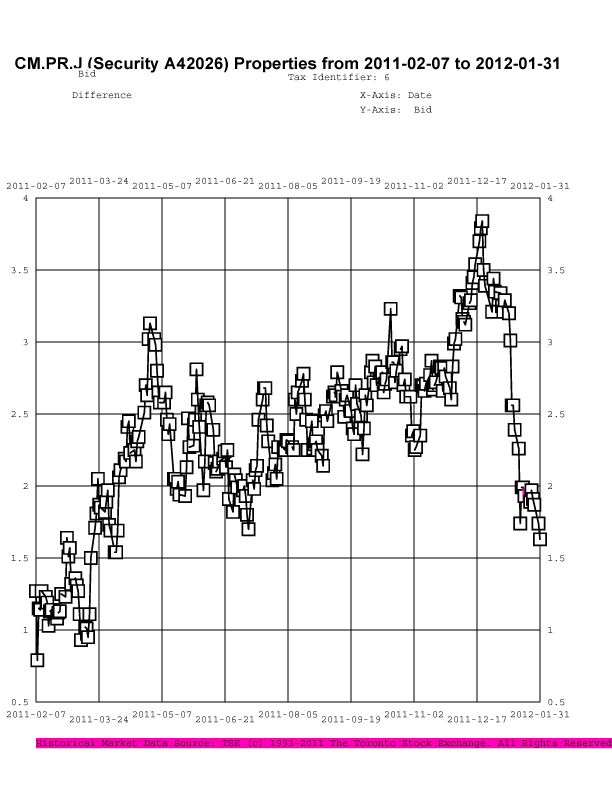

Click for Big

SLF, in particular, has been afflicted in recent months by relatively poor financial results and bouts of selling (see Who’s Selling all the SLF Preferreds? and Moody’s puts SLF on Review-Negative) but is showing signs of recovery.

SLF issues may be compared with PWF and GWO:
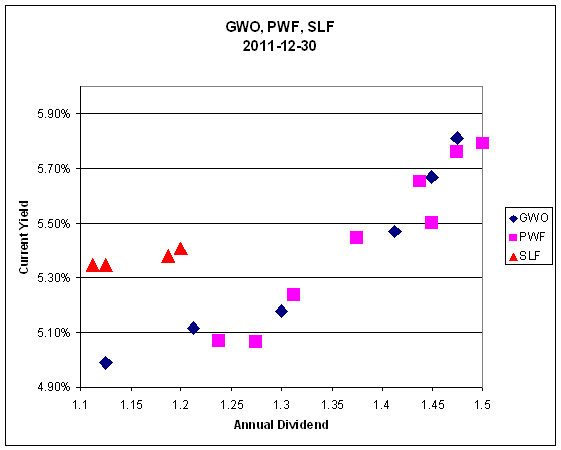

Click for Big

Click for Big
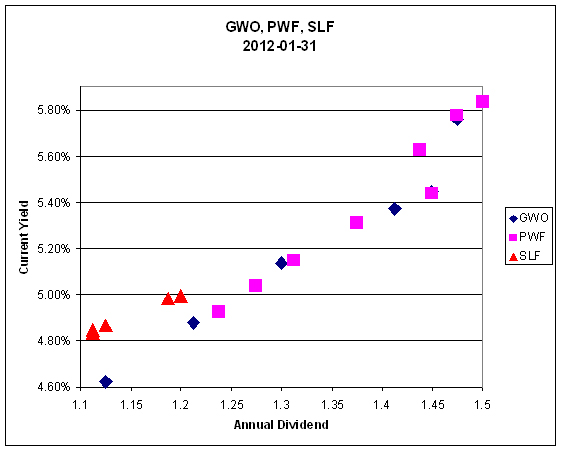
It is quite apparent that the pricing difference between SLF and similar issues has narrowed – and also that the market continues to treat regulated issues (SLF, GWO) no differently from unregulated issues (PWF).

The extent of the remaining SLF exceptionalism is better illustrated by a chart showing the current yield against the bid price:
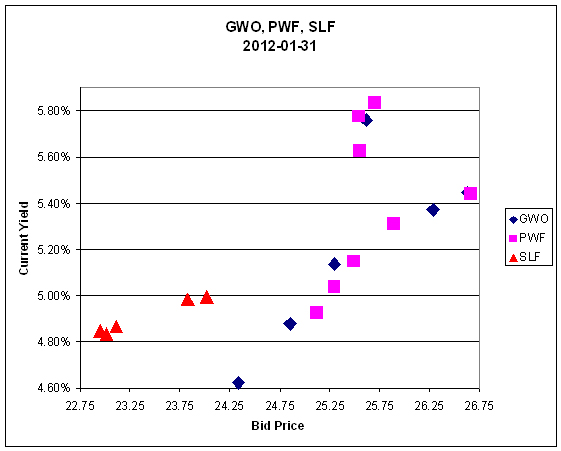

Click for Big

Now, I certainly agree that GWO is a better credit than SLF and deserves a little bit of premium pricing – but the current situation goes far beyond what I consider reasonable.

Amazingly, SLF continues to trade cheaper than WN:
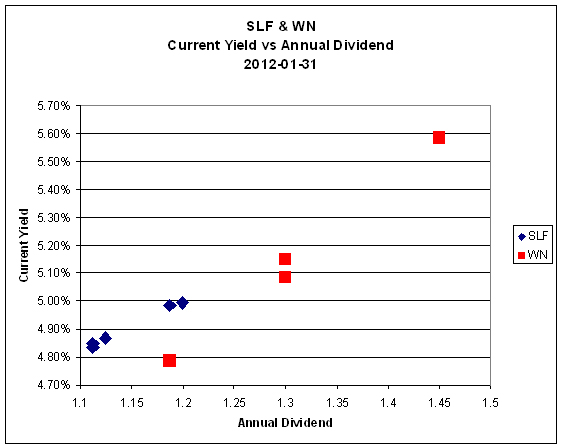

Click for Big

In order to rationalize the relationship between the Current Yields we are asked to believe:

  • That the additional credit quality of SLF is worthless
    • It is possible, of course, to argue that WN is actually a better credit than SLF, or that the scarcity value of a non-financial preferred outweighs the difference in credit. I have not yet heard these arguments being made
  • The option value of the issuer’s call is worthless
    • This can be phrased as ‘The potential capital gain for the SLF issues prior to a call, relative to that of the WN issues, is worthless’
  • The potential of a regulatory inspired call for the SLF issues is worthless
    • the SLF issues are currently Tier 1 Capital at the holding company level, but do not have an NVCC clause

Sometimes everything works … sometimes the trading works, but sectoral shifts overwhelm the increment … sometimes nothing works – and in 2011 circumstances were closer to the third possibility than they have generally been in the past. The fund seeks to earn incremental return by selling liquidity (that is, taking the other side of trades that other market participants are strongly motivated to execute), which can also be referred to as ‘trading noise’. There were a lot of strongly motivated market participants during the Panic of 2007, generating a lot of noise! Unfortunately, the conditions of the Panic may never be repeated in my lifetime … but the fund will simply attempt to make trades when swaps seem profitable, without worrying about the level of monthly turnover.

There’s plenty of room for new money left in the fund. I have shown in recent issues of PrefLetter that market pricing for FixedResets is demonstrably stupid and I have lots of confidence – backed up by my bond portfolio management experience in the markets for Canadas and Treasuries, and equity trading on the NYSE & TSX – that there is enough demand for liquidity in any market to make the effort of providing it worthwhile (although the definition of “worthwhile” in terms of basis points of outperformance changes considerably from market to market!) I will continue to exert utmost efforts to outperform but it should be borne in mind that there will almost inevitably be periods of underperformance in the future.

The yields available on high quality preferred shares remain elevated, which is reflected in the current estimate of sustainable income.

Calculation of MAPF Sustainable Income Per Unit
Month NAVPU Portfolio
Average
YTW
Leverage
Divisor
Securities
Average
YTW
Capital
Gains
Multiplier
Sustainable
Income
per
current
Unit
June, 2007 9.3114 5.16% 1.03 5.01% 1.3240 0.3524
September 9.1489 5.35% 0.98 5.46% 1.3240 0.3773
December, 2007 9.0070 5.53% 0.942 5.87% 1.3240 0.3993
March, 2008 8.8512 6.17% 1.047 5.89% 1.3240 0.3938
June 8.3419 6.034% 0.952 6.338% 1.3240 $0.3993
September 8.1886 7.108% 0.969 7.335% 1.3240 $0.4537
December, 2008 8.0464 9.24% 1.008 9.166% 1.3240 $0.5571
March 2009 $8.8317 8.60% 0.995 8.802% 1.3240 $0.5872
June 10.9846 7.05% 0.999 7.057% 1.3240 $0.5855
September 12.3462 6.03% 0.998 6.042% 1.3240 $0.5634
December 2009 10.5662 5.74% 0.981 5.851% 1.1141 $0.5549
March 2010 10.2497 6.03% 0.992 6.079% 1.1141 $0.5593
June 10.5770 5.96% 0.996 5.984% 1.1141 $0.5681
September 11.3901 5.43% 0.980 5.540% 1.1141 $0.5664
December 2010 10.7659 5.37% 0.993 5.408% 1.0298 $0.5654
March, 2011 11.0560 6.00% 0.994 5.964% 1.0298 $0.6403
June 11.1194 5.87% 1.018 5.976% 1.0298 $0.6453
September 10.2709 6.10%
Note
1.001 6.106% 1.0298 $0.6090
December, 2011 10.0793 5.63%
Note
1.031 5.805% 1.0000 $0.5851
January, 2012 10.6827 5.04%
Note
1.00 5.040% 1.0000 $0.5384
NAVPU is shown after quarterly distributions of dividend income and annual distribution of capital gains.
Portfolio YTW includes cash (or margin borrowing), with an assumed interest rate of 0.00%
The Leverage Divisor indicates the level of cash in the account: if the portfolio is 1% in cash, the Leverage Divisor will be 0.99
Securities YTW divides “Portfolio YTW” by the “Leverage Divisor” to show the average YTW on the securities held; this assumes that the cash is invested in (or raised from) all securities held, in proportion to their holdings.
The Capital Gains Multiplier adjusts for the effects of Capital Gains Dividends. On 2009-12-31, there was a capital gains distribution of $1.989262 which is assumed for this purpose to have been reinvested at the final price of $10.5662. Thus, a holder of one unit pre-distribution would have held 1.1883 units post-distribution; the CG Multiplier reflects this to make the time-series comparable. Note that Dividend Distributions are not assumed to be reinvested.
Sustainable Income is the resultant estimate of the fund’s dividend income per current unit, before fees and expenses. Note that a “current unit” includes reinvestment of prior capital gains; a unitholder would have had the calculated sustainable income with only, say, 0.9 units in the past which, with reinvestment of capital gains, would become 1.0 current units.
DeemedRetractibles are comprised of all Straight Perpetuals (both PerpetualDiscount and PerpetualPremium) issued by BMO, BNS, CM, ELF, GWO, HSB, IAG, MFC, NA, RY, SLF and TD, which are not exchangable into common at the option of the company (definition refined in May). These issues are analyzed as if their prospectuses included a requirement to redeem at par on or prior to 2022-1-31, in addition to the call schedule explicitly defined. See OSFI Does Not Grandfather Extant Tier 1 Capital, CM.PR.D, CM.PR.E, CM.PR.G: Seeking NVCC Status and the January, February, March and June, 2011, editions of PrefLetter for the rationale behind this analysis.
Yields for September, 2011, to January, 2012, were calculated by imposing a cap of 10% on the yields of YLO issues held, in order to avoid their extremely high calculated yields distorting the calculation and to reflect the uncertainty in the marketplace that these yields will be realized.

Significant positions were held in DeemedRetractible and FixedReset issues on January 31; all of the former and most of the latter currently have their yields calculated with the presumption that they will be called by the issuers at par prior to 2022-1-31. This presents another complication in the calculation of sustainable yield. The fund also holds a position in SplitShare issues (mainly BNA.PR.C) and an OperatingRetractible Scrap (YLO.PR.B) which also have their yields calculated with the expectation of a maturity at par (capped at 10% for the latter issue), a somewhat dubious assumption in the latter case.

The decline in the calculated sustainable yield is due to a significant shortening of term over the month – the recent run-up in the prices of longer-term issues has made it prudent to increase the investment in shorter-term, better-credit, lower-yielding FixedResets, although the weighting in this asset class remains well below index levels.

I will no longer show calculations that assume the conversion of the entire portfolio into PerpetualDiscounts, as there are currently only four such issues of investment grade, from only two issues. Additionally, the fund has substantially reduced its holdings of these issues.

Different assumptions lead to different results from the calculation, but the overall positive trend is apparent. I’m very pleased with the results! It will be noted that if there was no trading in the portfolio, one would expect the sustainable yield to be constant (before fees and expenses). The success of the fund’s trading is showing up in

  • the very good performance against the index
  • the long term increases in sustainable income per unit

As has been noted, the fund has maintained a credit quality equal to or better than the index; outperformance is due to constant exploitation of trading anomalies.

Again, there are no predictions for the future! The fund will continue to trade between issues in an attempt to exploit market gaps in liquidity, in an effort to outperform the index and keep the sustainable income per unit – however calculated! – growing.

MAPF Portfolio Composition: January, 2012

Saturday, February 4th, 2012

Turnover picked up in January, to about 10%.

Portfolio composition changed in several ways this month, but the major effects are due to the sale of nearly the entire ELF.PR.F and ELF.PR.G, with proceeds used to purchase higher-rated, more liquid, lower yielding FixedResets.

Sectoral distribution of the MAPF portfolio on January 31 was as follows:

MAPF Sectoral Analysis 2012-1-31
HIMI Indices Sector Weighting YTW ModDur
Ratchet 0% N/A N/A
FixFloat 0% N/A N/A
Floater 0% N/A N/A
OpRet 0% N/A N/A
SplitShare 10.0% (+0.2) 6.21% 5.78
Interest Rearing 0% N/A N/A
PerpetualPremium 0.0% (0) N/A N/A
PerpetualDiscount 1.4% (-6.5) 5.16% 15.18
Fixed-Reset 19.4% (+6.3) 2.63% 2.20
Deemed-Retractible 58.5% (+2.4) 5.31% 7.77
Scraps (Various) 10.7% (+0.7) 6.80% (see note) 11.21 (see note)
Cash 0.0 (-3.1) 0.00% 0.00
Total 100% 5.04% 6.96
Yields for the YLO preferreds have been set at 10% for calculation purposes, and their durations at 5.00. The extraordinarily low price of these issues has resulted in extremely high calculated yields; I feel that substitution of these values results in a more prudent total indication.
Totals and changes will not add precisely due to rounding. Bracketted figures represent change from December month-end. Cash is included in totals with duration and yield both equal to zero.
DeemedRetractibles are comprised of all Straight Perpetuals (both PerpetualDiscount and PerpetualPremium) issued by BMO, BNS, CM, ELF, GWO, HSB, IAG, MFC, NA, RY, SLF and TD, which are not exchangable into common at the option of the company. These issues are analyzed as if their prospectuses included a requirement to redeem at par on or prior to 2022-1-31, in addition to the call schedule explicitly defined. See OSFI Does Not Grandfather Extant Tier 1 Capital, CM.PR.D, CM.PR.E, CM.PR.G: NVCC Status Confirmed and the January, February, March and June, 2011, editions of PrefLetter for the rationale behind this analysis.

The “total” reflects the un-leveraged total portfolio (i.e., cash is included in the portfolio calculations and is deemed to have a duration and yield of 0.00.). MAPF will often have relatively large cash balances, both credit and debit, to facilitate trading. Figures presented in the table have been rounded to the indicated precision.

Credit distribution is:

MAPF Credit Analysis 2012-1-31
DBRS Rating Weighting
Pfd-1 0 (0)
Pfd-1(low) 51.7% (+4.9)
Pfd-2(high) 26.2% (+4.7)
Pfd-2 0 (0)
Pfd-2(low) 11.3% (-7.4)
Pfd-3(high) 1.1% (-2.0)
Pfd-3 4.8% (+1.8)
Pfd-4 2.5% (+0.2)
Pfd-4(low) 1.8% (+0.1)
Cash 0.0 (-3.1)
Totals will not add precisely due to rounding. Bracketted figures represent change from December month-end.
A position held in ELF preferreds has been assigned to Pfd-2(low)
A position held in CSE preferreds has been assigned to Pfd-3

Liquidity Distribution is:

MAPF Liquidity Analysis 2012-1-31
Average Daily Trading Weighting
<$50,000 1.2% (-1.2)
$50,000 – $100,000 11.0% (-18.0)
$100,000 – $200,000 33.2% (+7.2)
$200,000 – $300,000 36.8% (-0.3)
>$300,000 17.8% (+5.5)
Cash 0.0 (-3.1)
Totals will not add precisely due to rounding. Bracketted figures represent change from December month-end.

MAPF is, of course, Malachite Aggressive Preferred Fund, a “unit trust” managed by Hymas Investment Management Inc. Further information and links to performance, audited financials and subscription information are available the fund’s web page. The fund may be purchased either directly from Hymas Investment Management or through a brokerage account at Odlum Brown Limited. A “unit trust” is like a regular mutual fund, but is sold by offering memorandum rather than prospectus. This is cheaper, but means subscription is restricted to “accredited investors” (as defined by the Ontario Securities Commission) or those who subscribe for $150,000+. Fund past performances are not a guarantee of future performance. You can lose money investing in MAPF or any other fund.

A similar portfolio composition analysis has been performed on the Claymore Preferred Share ETF (symbol CPD) as of August 31, 2011, and published in the October, 2011, PrefLetter. While direct comparisons are difficult due to the introduction of the DeemedRetractible class of preferred share (see above) it is fair to say:

  • MAPF credit quality is better
  • MAPF liquidity is a higher
  • MAPF Yield is higher
  • Weightings in
    • MAPF is much more exposed to DeemedRetractibles
    • MAPF is much less exposed to Operating Retractibles
    • MAPF is much more exposed to SplitShares
    • MAPF is less exposed to FixFloat / Floater / Ratchet
    • MAPF weighting in FixedResets is much lower

February 3, 2012

Saturday, February 4th, 2012

Very nice US jobs number today:

The U.S. jobless rate unexpectedly fell in January to the lowest in three years as payrolls climbed more than forecast, casting doubt on the Federal Reserve’s plan to keep interest rates low until late 2014.

The unemployment rate dropped to 8.3 percent, the lowest since February 2009, Labor Department figures showed today in Washington. The 243,000 increase in jobs was the biggest in nine months and exceeded the most optimistic forecast in a Bloomberg News survey. Service industries grew by the most in a year, according to a separate report.

The Standard & Poor’s 500 Index rose 1.5 percent to 1,344.90 at the close of trading in New York, extending the best start to a year since 1987. The index is up 6.9 percent in 2012. The yield on the benchmark 10-year Treasury note climbed to 1.92 percent from 1.82 percent late yesterday.

The median projection in the Bloomberg survey called for payrolls to rise by 140,000. Estimates of the 89 economists ranged from increases of 95,000 to 225,000. Revisions added a total of 60,000 jobs to payrolls in November and December.

The most left wing PM since Trudeau just can’t stop meddling with the economy:

Prime Minister Stephen Harper drew an apparent line in the sand on foreign takeovers on Friday, saying he wanted to see BlackBerry-maker Research In Motion grow “as a Canadian company” and questioning whether hostile takeovers of key domestic firms are in the country’s best interests.

“Takeovers of critical technology that the government’s invested in, or … hostile takeovers of key Canadian businesses, are obviously something that I think is widely understood is not in this country’s interest,” Mr. Harper said.

Well, it’s been a week and I still don’t see OSFI doing the decent thing and releasing the documents obtained by Bloomberg with a Freedom of Information request:

Bank of Canada Governor Mark Carney talks about the potential impact of the so-called Volcker rule on the trading of government bonds, the European Central Bank’s efforts to ease the region’s debt crisis and bank capital regulations. He speaks with Bloomberg’s Erik Schatzker on the sidelines of the World Economic Forum’s annual meeting in Davos, Switzerland. (Source: Bloomberg)
Attachment: Documents Obtained by Bloomberg. .Canadian lenders are loosening standards, offering mortgages similar to U.S. subprime loans that pose an “emerging risk” to financial institutions, according to the country’s banking regulator.

Banks and other lenders are becoming “increasingly liberal” with mortgages and home-equity credit lines that don’t require individuals to prove their income, according to 152 pages of documents obtained by Bloomberg News under freedom of information law from the Office of the Superintendent of Financial Institutions. The mortgages, typically granted to the self-employed and recent immigrants, “have some similarities to non-prime loans in the U.S. retail lending market,” the documents show.

But then, you don’t often see OSFI doing the decent thing.

Another very strong day for the Canadian preferred share market, with PerpetualPremiums winning 33bp (taking the median YTW down to -8.58%), FixedResets gaining 28bp and DeemedRetractibles up 36bp. All fourteen entries on the Performance Highlights table wer winners. Volume continued to be extremely heavy.

HIMIPref™ Preferred Indices
These values reflect the December 2008 revision of the HIMIPref™ Indices

Values are provisional and are finalized monthly
Index Mean
Current
Yield
(at bid)
Median
YTW
Median
Average
Trading
Value
Median
Mod Dur
(YTW)
Issues Day’s Perf. Index Value
Ratchet 0.00 % 0.00 % 0 0.00 0 0.7198 % 2,431.8
FixedFloater 4.69 % 4.06 % 38,432 17.25 1 0.2475 % 3,323.9
Floater 2.75 % 2.96 % 61,915 19.82 3 0.7198 % 2,625.7
OpRet 4.81 % -1.15 % 67,462 1.29 6 0.1447 % 2,531.8
SplitShare 5.30 % -0.84 % 79,540 0.85 4 0.0800 % 2,641.5
Interest-Bearing 0.00 % 0.00 % 0 0.00 0 0.1447 % 2,315.1
Perpetual-Premium 5.30 % -8.58 % 109,158 0.09 26 0.3320 % 2,233.7
Perpetual-Discount 5.03 % 4.91 % 191,732 15.61 4 0.4240 % 2,456.3
FixedReset 5.00 % 2.45 % 222,931 2.32 65 0.2815 % 2,402.6
Deemed-Retractible 4.85 % 0.90 % 223,807 0.97 45 0.3607 % 2,336.2
Performance Highlights
Issue Index Change Notes
PWF.PR.F Perpetual-Premium 1.02 % YTW SCENARIO
Maturity Type : Call
Maturity Date : 2012-03-04
Maturity Price : 25.00
Evaluated at bid price : 25.77
Bid-YTW : -29.01 %
TRP.PR.C FixedReset 1.04 % YTW SCENARIO
Maturity Type : Limit Maturity
Maturity Date : 2042-02-03
Maturity Price : 23.59
Evaluated at bid price : 26.15
Bid-YTW : 2.75 %
CM.PR.K FixedReset 1.05 % YTW SCENARIO
Maturity Type : Call
Maturity Date : 2014-07-31
Maturity Price : 25.00
Evaluated at bid price : 27.04
Bid-YTW : 2.01 %
CM.PR.E Perpetual-Premium 1.11 % YTW SCENARIO
Maturity Type : Call
Maturity Date : 2012-03-04
Maturity Price : 25.25
Evaluated at bid price : 26.38
Bid-YTW : -42.20 %
BMO.PR.K Deemed-Retractible 1.16 % YTW SCENARIO
Maturity Type : Call
Maturity Date : 2012-11-25
Maturity Price : 26.00
Evaluated at bid price : 27.10
Bid-YTW : -0.52 %
CU.PR.C FixedReset 1.18 % YTW SCENARIO
Maturity Type : Call
Maturity Date : 2017-06-01
Maturity Price : 25.00
Evaluated at bid price : 26.24
Bid-YTW : 2.94 %
PWF.PR.K Perpetual-Premium 1.21 % YTW SCENARIO
Maturity Type : Call
Maturity Date : 2012-03-04
Maturity Price : 25.75
Evaluated at bid price : 26.01
Bid-YTW : -6.99 %
POW.PR.C Perpetual-Premium 1.27 % YTW SCENARIO
Maturity Type : Call
Maturity Date : 2012-03-04
Maturity Price : 25.00
Evaluated at bid price : 25.50
Bid-YTW : -14.15 %
CU.PR.A Perpetual-Premium 1.29 % YTW SCENARIO
Maturity Type : Call
Maturity Date : 2012-03-04
Maturity Price : 25.25
Evaluated at bid price : 25.73
Bid-YTW : -21.15 %
BAM.PR.T FixedReset 1.30 % YTW SCENARIO
Maturity Type : Limit Maturity
Maturity Date : 2042-02-03
Maturity Price : 23.38
Evaluated at bid price : 25.76
Bid-YTW : 3.56 %
PWF.PR.A Floater 1.39 % YTW SCENARIO
Maturity Type : Limit Maturity
Maturity Date : 2042-02-03
Maturity Price : 21.59
Evaluated at bid price : 21.85
Bid-YTW : 2.37 %
IAG.PR.A Deemed-Retractible 1.69 % YTW SCENARIO
Maturity Type : Hard Maturity
Maturity Date : 2022-01-31
Maturity Price : 25.00
Evaluated at bid price : 24.60
Bid-YTW : 4.89 %
PWF.PR.L Perpetual-Premium 1.73 % YTW SCENARIO
Maturity Type : Call
Maturity Date : 2012-10-31
Maturity Price : 25.75
Evaluated at bid price : 25.94
Bid-YTW : 4.01 %
CIU.PR.B FixedReset 2.05 % YTW SCENARIO
Maturity Type : Call
Maturity Date : 2014-06-01
Maturity Price : 25.00
Evaluated at bid price : 27.45
Bid-YTW : 2.16 %
Volume Highlights
Issue Index Shares
Traded
Notes
BMO.PR.N FixedReset 94,751 Nesbitt crossed 70,000 at 27.10.
YTW SCENARIO
Maturity Type : Call
Maturity Date : 2014-02-25
Maturity Price : 25.00
Evaluated at bid price : 27.13
Bid-YTW : 2.08 %
HSB.PR.C Deemed-Retractible 54,420 Scotia crossed 53,000 at 25.85.
YTW SCENARIO
Maturity Type : Call
Maturity Date : 2012-06-30
Maturity Price : 25.50
Evaluated at bid price : 25.79
Bid-YTW : 3.31 %
MFC.PR.D FixedReset 47,181 RBC crossed 22,100 at 27.50.
YTW SCENARIO
Maturity Type : Call
Maturity Date : 2014-06-19
Maturity Price : 25.00
Evaluated at bid price : 27.40
Bid-YTW : 2.79 %
RY.PR.N FixedReset 40,077 TD crossed 24,900 at 26.95.
YTW SCENARIO
Maturity Type : Call
Maturity Date : 2014-02-24
Maturity Price : 25.00
Evaluated at bid price : 26.91
Bid-YTW : 2.27 %
SLF.PR.E Deemed-Retractible 38,487 YTW SCENARIO
Maturity Type : Hard Maturity
Maturity Date : 2022-01-31
Maturity Price : 25.00
Evaluated at bid price : 23.21
Bid-YTW : 5.53 %
ENB.PR.F FixedReset 34,802 Recent new issue.
YTW SCENARIO
Maturity Type : Limit Maturity
Maturity Date : 2042-02-03
Maturity Price : 23.23
Evaluated at bid price : 25.41
Bid-YTW : 3.65 %
There were 67 other index-included issues trading in excess of 10,000 shares.
Wide Spread Highlights
Issue Index Quote Data and Yield Notes
ELF.PR.G Perpetual-Discount Quote: 23.16 – 23.63
Spot Rate : 0.4700
Average : 0.3164

YTW SCENARIO
Maturity Type : Limit Maturity
Maturity Date : 2042-02-03
Maturity Price : 22.73
Evaluated at bid price : 23.16
Bid-YTW : 5.15 %

CM.PR.P Deemed-Retractible Quote: 25.97 – 26.34
Spot Rate : 0.3700
Average : 0.2298

YTW SCENARIO
Maturity Type : Call
Maturity Date : 2012-10-29
Maturity Price : 25.00
Evaluated at bid price : 25.97
Bid-YTW : 0.28 %

BAM.PR.O OpRet Quote: 25.96 – 26.49
Spot Rate : 0.5300
Average : 0.3941

YTW SCENARIO
Maturity Type : Option Certainty
Maturity Date : 2013-06-30
Maturity Price : 25.00
Evaluated at bid price : 25.96
Bid-YTW : 2.55 %

POW.PR.D Perpetual-Premium Quote: 25.70 – 26.08
Spot Rate : 0.3800
Average : 0.2608

YTW SCENARIO
Maturity Type : Call
Maturity Date : 2013-10-31
Maturity Price : 25.25
Evaluated at bid price : 25.70
Bid-YTW : 4.06 %

TRP.PR.A FixedReset Quote: 26.72 – 27.00
Spot Rate : 0.2800
Average : 0.1805

YTW SCENARIO
Maturity Type : Call
Maturity Date : 2014-12-31
Maturity Price : 25.00
Evaluated at bid price : 26.72
Bid-YTW : 2.31 %

CIU.PR.A Perpetual-Premium Quote: 25.05 – 25.40
Spot Rate : 0.3500
Average : 0.2593

YTW SCENARIO
Maturity Type : Limit Maturity
Maturity Date : 2042-02-03
Maturity Price : 24.76
Evaluated at bid price : 25.05
Bid-YTW : 4.58 %

YLD.PR.A, YLD.PR.B: Default

Saturday, February 4th, 2012

Split Yield Corporation (run by Quadravest):

Split Yield Corporation (the “Company”) provides final redemption prices pursuant to the termination of the Company effective February 1, 2012.

As more fully described in the December 6, 2011 press release, the Company’s annual information form,
financial statements and other continuous disclosure documents, the final formula to calculate the termination payment is as follows: Each Class I Preferred share (YLD.PR.A) will be valued at the lesser of (i) $20; and (ii) the Net Assets per unit for the Company on the termination date. Each Class II Preferred share (YLD.PR.B) will be valued at the amount, if any, of the difference between the Net Assets per unit of the Company and $20 (the original issue price of the Class I Preferred shares) subject to a maximum value of $15 per share. Capital shares (YLD) will receive no payment unless the unit value was in excess of $35 per unit at termination date.

The final net asset value per unit as at February 1, 2012 was $18.6989. As a result of the final redemption formula outlined above, a payment of $18.6989 per Class I Preferred share (YLD.PR.A) will be made on February 16, 2012. No payment will be made to Class II Preferred shares (YLD.PR.B) or Capital shares (YLD) as a result of the formula above.

Class I Preferred shareholders have received total dividends of $15.17 per share since inception. The final quarterly dividend of $0.275 to Class I Preferred shareholders was made on January 31, 2012. Class II Preferred shareholders have received total dividends of $10.54 per share since inception. Capital shares have received total dividends of $7.25 per share since inception. Overall, a total of $32.96 per unit in distributions was made since inception.

Payment of the redemption prices as applicable are expected to be made on February 16, 2012 and will be paid to the beneficial holders of such shares through payment to the CDS participant through which such shares are held.

According to DBRS:

DBRS has today downgraded the rating of the 5.5% Class I Cumulative Preferred Shares (the Class I Preferred Shares) issued by Split Yield Corporation (the Company) from Pfd-5 to D and confirmed the rating of the 7.0% Class II Cumulative Preferred Shares (the Class II Preferred Shares) issued by the Company at D.

On December 6, 2011, the Company announced that all of its outstanding Class I and Class II Preferred Shares would be redeemed as scheduled on February 1, 2012 (the Redemption Date), in accordance with the redemption provisions of the shares. Quadravest Capital Management, manager of the Company, began liquidating the portfolio during the latter half of January 2012 in preparation for the final redemption.

On February 1, 2012, all outstanding Class I and Class II Preferred Shares were redeemed. The final redemption prices were $19.00 and $0.005 for the Class I and II Preferred Shares, respectively, which were less than the issue prices of the Class I and Class II Preferred Shares. As a result, the holders of the Class I and Class II Preferred Shares suffered a loss on their principals.

These issues were last mentioned on PrefBlog in the post YLD.PR.A, YLD.PR.B Redemption Announced; Default Almost Certain. YLD.PR.A and YLD.PR.B have both been tracked by HIMIPref™, but have been relegated to the Scraps index on credit concerns.

New Issue: VSN FixedReset 4.40%+292

Friday, February 3rd, 2012

Veresen Inc. has announced:

it will issue 6,000,000 Cumulative Redeemable Preferred Shares, Series A (“Series A Preferred Shares”) at a price of $25.00 per share (the “Offering”) for aggregate gross proceeds of $150 million on a bought deal basis. The Series A Preferred Shares will be offered to the public through a syndicate of underwriters co-led by Scotiabank, TD Securities Inc. and CIBC.

The holders of Series A Preferred Shares will be entitled to receive fixed cumulative dividends at an annual rate of 4.40%, payable quarterly for an initial period up to but excluding September 30, 2017, as and when declared by the Board of Directors of Veresen. The first quarterly dividend payment date is scheduled for June 30, 2012. The dividend rate will reset on September 30, 2017 and every five years thereafter at a rate equal to the sum of the then five-year Government of Canada bond yield plus 2.92%. The Series A Preferred Shares are redeemable by Veresen, at its option, on September 30, 2017 and on September 30 of every fifth year thereafter.

Holders of Series A Preferred Shares will have the right to convert all or any part of their shares into Cumulative Redeemable Preferred Shares, Series B (“Series B Preferred Shares”), subject to certain conditions, on September 30, 2017, and on September 30 of every fifth year thereafter. The holders of Series B Preferred Shares will be entitled to receive quarterly floating rate cumulative dividends, as and when declared by the Board of Directors of Veresen, at a rate equal to the sum of the then 90-day Government of Canada treasury bill rate plus 2.92%.

Veresen has granted the underwriters an option to purchase at the offering price an additional 2,000,000 Series A Preferred Shares exercisable in whole or in part at any time up to 6:30 AM (Calgary time) on the date that is two business days prior to closing. Should the option be fully exercised, the total gross proceeds of the Offering will be $200 million.

The Offering is expected to close on or about February 14, 2012. Net proceeds from the Offering will be used to reduce indebtedness, partially fund capital expenditures and for other general corporate purposes.

The Series A Preferred Shares will be issued pursuant to a prospectus supplement that will be filed with the securities regulatory authority in each of the provinces of Canada under Veresen’s short form base shelf prospectus dated August 22, 2011. An application has been made to list the Series A Preferred Shares and the Series B Preferred Shares on the Toronto Stock Exchange. The Offering is subject to receipt of all necessary regulatory and stock exchange approvals.

I have mixed feelings about this one. On the one had, it’s nice to see a new issuer. On the other hand, we already have lots of junk (it’s rated Pfd-3(high) by DBRS and the shelf prospectus was at P-3(high) by S&P). So, whatever.