Archive for July, 2013

July 3, 2013

Thursday, July 4th, 2013

Europe’s back in the news:

A broad market selloff was triggered Wednesday morning by the crumbling of the centre-right government of Portuguese prime minister Pedro Passos Coelho, which has been rocked by the resignations of its finance and foreign ministers in the last two days.

The prospect of the outright collapse of his government has triggered a fresh political crisis in Portugal that is unnerving investors across the continent. The fear is that a political vacuum, followed by polls that could elect an anti-austerity government, or another shaky coalition government, would undermine the reforms and spending cuts agreed in 2011, when the European Union and the International Monetary Fund sponsored a €78-billion Portuguese bailout package.

Lisbon’s main market index, the PSI 20 was down about 5.5 per cent in early afternoon trading, European time though it had been down almost 7 per cent in the morning.

The government of Greek prime minister Antonis Samaras last month lost one of its two coalition partners in protest of Mr. Samaras’s unilateral decision to shut the national broadcaster, ERT, eliminating almost 3,000 jobs.

In Italy, the government of prime minister Enrico Letta, in office since April, faces uncertainty because former prime minister Mario Monti is frustrated by the slow pace of economic reform and has threatened to withdraw his support.

There are some interesting changes coming in the US securities market:

U.S. securities regulators are set to vote next week to lift an 80-year-old rule that prohibits companies and private funds from advertising to raise capital outside of a public offering.

The Securities and Exchange Commission is required to remove the advertising ban under a 2012 law that sought to ease regulations on financing for startups and small businesses. In a nod to complaints from critics who say the change will open the door to more fraud, the SEC will also propose a separate rule during the July 10 meeting to add some investor protections and make it easier for the agency to monitor the change.

A third rule scheduled for a vote the same day would block felons and others found culpable of securities-law violations from marketing such deals, which are more lightly regulated than public offers of stock or debt.

Gotta have that third rule! What’s the point of being a big-shot regulator if you can’t indulge in a little extra-judicial punishment every now and then?

David Parkinson of the Globe reminds us that the economy is still shaky:

The ISM’s index, which indicates the pace of service-sector activity in the U.S. economy, slipped to 52.2 for June, its lowest level in more than three years. While any reading above 50 still indicates growth, the index indicates that the pace of growth has been in steady decline; it has fallen in three of the past four months, after hitting a one-year high of 56.0 in February.

Yet the stock market has been somewhere between dismissive and contemptuous toward this erosion in the services ISM. The S&P 500 was up slightly in mid-afternoon trading Monday; over the course of the services ISM’s four-month slide, the S&P 500 is up almost 8 per cent.

OSFI has published Capital Disclosure requirements.

It was another very nice recovery day for the Canadian preferred share market, with PerpetualDiscounts winning 40bp, FixedResets gaining 12bp and DeemedRetractibles up 24bp. There’s a very lengthy Performance Highlights table, but with no clear pattern to it. Volume was above average.

PerpetualDiscounts now yield 5.39%, equivalent to 7.01% interest at the standard conversion factor of 1.3x. Long Corporates now yield about 4.6%, so the pre-tax interest-equivalent spread is now about 240bp, down substantially from the 270bp reported June 26 but still above post-Crunch norms. Note that this week’s figure is not strictly comparable with last weeks figure due to the significant influx of former PerpetualPremiums into the PerpetualDiscount pool but, on a brighter note, is more comparable with older figures than has been the case recently.

HIMIPref™ Preferred Indices
These values reflect the December 2008 revision of the HIMIPref™ Indices

Values are provisional and are finalized monthly
Index Mean
Current
Yield
(at bid)
Median
YTW
Median
Average
Trading
Value
Median
Mod Dur
(YTW)
Issues Day’s Perf. Index Value
Ratchet 0.00 % 0.00 % 0 0.00 0 1.0068 % 2,581.6
FixedFloater 4.13 % 3.47 % 43,585 18.33 1 2.1314 % 3,977.8
Floater 2.72 % 2.90 % 79,320 20.01 4 1.0068 % 2,787.5
OpRet 4.85 % 3.45 % 67,694 0.16 5 0.0313 % 2,612.5
SplitShare 4.66 % 4.14 % 74,935 3.97 6 0.3915 % 2,974.3
Interest-Bearing 0.00 % 0.00 % 0 0.00 0 0.0313 % 2,388.9
Perpetual-Premium 5.60 % 5.34 % 104,897 3.78 12 0.2116 % 2,280.0
Perpetual-Discount 5.35 % 5.39 % 143,639 14.68 26 0.3989 % 2,400.9
FixedReset 4.95 % 3.44 % 242,688 3.59 83 0.1165 % 2,484.9
Deemed-Retractible 5.04 % 4.75 % 179,108 6.94 44 0.2388 % 2,394.3
Performance Highlights
Issue Index Change Notes
HSE.PR.A FixedReset -1.49 % YTW SCENARIO
Maturity Type : Limit Maturity
Maturity Date : 2043-07-03
Maturity Price : 23.23
Evaluated at bid price : 24.50
Bid-YTW : 3.63 %
MFC.PR.F FixedReset -1.21 % YTW SCENARIO
Maturity Type : Hard Maturity
Maturity Date : 2025-01-31
Maturity Price : 25.00
Evaluated at bid price : 24.50
Bid-YTW : 3.71 %
BAM.PF.C Perpetual-Discount -1.10 % YTW SCENARIO
Maturity Type : Limit Maturity
Maturity Date : 2043-07-03
Maturity Price : 21.34
Evaluated at bid price : 21.64
Bid-YTW : 5.63 %
POW.PR.A Perpetual-Discount 1.02 % YTW SCENARIO
Maturity Type : Limit Maturity
Maturity Date : 2043-07-03
Maturity Price : 24.50
Evaluated at bid price : 24.75
Bid-YTW : 5.67 %
GWO.PR.P Deemed-Retractible 1.03 % YTW SCENARIO
Maturity Type : Hard Maturity
Maturity Date : 2025-01-31
Maturity Price : 25.00
Evaluated at bid price : 25.41
Bid-YTW : 5.25 %
MFC.PR.B Deemed-Retractible 1.08 % YTW SCENARIO
Maturity Type : Hard Maturity
Maturity Date : 2025-01-31
Maturity Price : 25.00
Evaluated at bid price : 23.30
Bid-YTW : 5.50 %
GWO.PR.I Deemed-Retractible 1.10 % YTW SCENARIO
Maturity Type : Hard Maturity
Maturity Date : 2025-01-31
Maturity Price : 25.00
Evaluated at bid price : 23.05
Bid-YTW : 5.45 %
BAM.PR.Z FixedReset 1.13 % YTW SCENARIO
Maturity Type : Call
Maturity Date : 2017-12-31
Maturity Price : 25.00
Evaluated at bid price : 26.00
Bid-YTW : 3.85 %
NA.PR.O FixedReset 1.20 % YTW SCENARIO
Maturity Type : Call
Maturity Date : 2014-02-15
Maturity Price : 25.00
Evaluated at bid price : 25.85
Bid-YTW : 2.48 %
W.PR.H Perpetual-Discount 1.40 % YTW SCENARIO
Maturity Type : Limit Maturity
Maturity Date : 2043-07-03
Maturity Price : 24.46
Evaluated at bid price : 24.70
Bid-YTW : 5.58 %
BAM.PR.K Floater 1.48 % YTW SCENARIO
Maturity Type : Limit Maturity
Maturity Date : 2043-07-03
Maturity Price : 17.82
Evaluated at bid price : 17.82
Bid-YTW : 2.96 %
BAM.PF.B FixedReset 1.50 % YTW SCENARIO
Maturity Type : Call
Maturity Date : 2019-03-31
Maturity Price : 25.00
Evaluated at bid price : 25.07
Bid-YTW : 4.18 %
TRI.PR.B Floater 1.51 % YTW SCENARIO
Maturity Type : Limit Maturity
Maturity Date : 2043-07-03
Maturity Price : 23.20
Evaluated at bid price : 23.50
Bid-YTW : 2.21 %
IGM.PR.B Perpetual-Premium 1.56 % YTW SCENARIO
Maturity Type : Call
Maturity Date : 2017-12-31
Maturity Price : 25.25
Evaluated at bid price : 25.47
Bid-YTW : 5.54 %
IFC.PR.A FixedReset 1.61 % YTW SCENARIO
Maturity Type : Call
Maturity Date : 2017-12-31
Maturity Price : 25.00
Evaluated at bid price : 25.80
Bid-YTW : 3.45 %
FTS.PR.J Perpetual-Discount 2.09 % YTW SCENARIO
Maturity Type : Limit Maturity
Maturity Date : 2043-07-03
Maturity Price : 23.55
Evaluated at bid price : 23.89
Bid-YTW : 5.01 %
BAM.PR.G FixedFloater 2.13 % YTW SCENARIO
Maturity Type : Limit Maturity
Maturity Date : 2043-07-03
Maturity Price : 23.18
Evaluated at bid price : 23.00
Bid-YTW : 3.47 %
CIU.PR.C FixedReset 10.43 % Not real, just a correction of yesterday’s nonsensical quote.
YTW SCENARIO
Maturity Type : Limit Maturity
Maturity Date : 2043-07-03
Maturity Price : 23.14
Evaluated at bid price : 24.35
Bid-YTW : 3.24 %
Volume Highlights
Issue Index Shares
Traded
Notes
TD.PR.S FixedReset 123,942 Reset rate announced.
Nesbitt crossed 25,000 at 25.11; RBC crossed 10,000 at 25.10; Scotia crossed 25,000 at 25.13.
YTW SCENARIO
Maturity Type : Hard Maturity
Maturity Date : 2022-01-31
Maturity Price : 25.00
Evaluated at bid price : 25.12
Bid-YTW : 3.44 %
ENB.PR.Y FixedReset 47,505 Recent new issue.
YTW SCENARIO
Maturity Type : Limit Maturity
Maturity Date : 2043-07-03
Maturity Price : 23.07
Evaluated at bid price : 24.91
Bid-YTW : 4.03 %
TRP.PR.D FixedReset 39,800 YTW SCENARIO
Maturity Type : Call
Maturity Date : 2019-04-30
Maturity Price : 25.00
Evaluated at bid price : 25.31
Bid-YTW : 3.91 %
BMO.PR.M FixedReset 29,211 National crossed 25,000 at 25.20.
YTW SCENARIO
Maturity Type : Hard Maturity
Maturity Date : 2022-01-31
Maturity Price : 25.00
Evaluated at bid price : 25.18
Bid-YTW : 3.41 %
ENB.PR.T FixedReset 24,403 YTW SCENARIO
Maturity Type : Call
Maturity Date : 2019-06-01
Maturity Price : 25.00
Evaluated at bid price : 25.12
Bid-YTW : 4.00 %
ENB.PR.N FixedReset 23,185 YTW SCENARIO
Maturity Type : Call
Maturity Date : 2018-12-01
Maturity Price : 25.00
Evaluated at bid price : 25.30
Bid-YTW : 3.84 %
There were 37 other index-included issues trading in excess of 10,000 shares.
Wide Spread Highlights
Issue Index Quote Data and Yield Notes
FTS.PR.E OpRet Quote: 25.95 – 26.51
Spot Rate : 0.5600
Average : 0.3727

YTW SCENARIO
Maturity Type : Call
Maturity Date : 2013-08-02
Maturity Price : 25.75
Evaluated at bid price : 25.95
Bid-YTW : 0.37 %

PWF.PR.S Perpetual-Discount Quote: 23.64 – 24.07
Spot Rate : 0.4300
Average : 0.2608

YTW SCENARIO
Maturity Type : Limit Maturity
Maturity Date : 2043-07-03
Maturity Price : 23.33
Evaluated at bid price : 23.64
Bid-YTW : 5.15 %

MFC.PR.G FixedReset Quote: 25.55 – 26.00
Spot Rate : 0.4500
Average : 0.2995

YTW SCENARIO
Maturity Type : Call
Maturity Date : 2016-12-19
Maturity Price : 25.00
Evaluated at bid price : 25.55
Bid-YTW : 3.79 %

HSE.PR.A FixedReset Quote: 24.50 – 25.00
Spot Rate : 0.5000
Average : 0.3612

YTW SCENARIO
Maturity Type : Limit Maturity
Maturity Date : 2043-07-03
Maturity Price : 23.23
Evaluated at bid price : 24.50
Bid-YTW : 3.63 %

PWF.PR.O Perpetual-Premium Quote: 25.81 – 26.21
Spot Rate : 0.4000
Average : 0.2706

YTW SCENARIO
Maturity Type : Call
Maturity Date : 2017-10-31
Maturity Price : 25.25
Evaluated at bid price : 25.81
Bid-YTW : 5.46 %

FTS.PR.F Perpetual-Discount Quote: 23.94 – 24.45
Spot Rate : 0.5100
Average : 0.3878

YTW SCENARIO
Maturity Type : Limit Maturity
Maturity Date : 2043-07-03
Maturity Price : 23.61
Evaluated at bid price : 23.94
Bid-YTW : 5.16 %

MAPF Performance: June 2013

Wednesday, July 3rd, 2013

The fund underperformed in June, due largely to being over-weight in DeemedRetractible issues, more particularly insurance DeemedRetractibles which severely underperformed – in fact, these issues performed indistinguishably from PerpetualDiscounts.

Markets in general performed poorly in June, with long-dated fixed-income investments (such as preferred shares) being hurt badly. This was due to speculation about the possible end of Quantitative Easing (whereby the Fed is injecting $85-billion/month into the US money supply), which – according to some – were confirmed by the June 19 FOMC statement and particularly Bernanke’s press conference afterwards. The market bottomed on June 24 and has been slowly recovering since then; various Fed officials made a concerted effort to calm the market on June 27.

ZPR, is a relatively new ETF comprised of FixedResets and Floating Rate issues, with a very high proportion of junk issues, which returned -1.77% for the month, and -3.07% over the past three months (according to my calculations from the fund’s NAV data and distribution data; our regulators are hard at work protecting you from performance data since the fund has been extant for less than a year), versus returns for the TXPL index of -2.00% and -3.24%, respectively. The fund has been able to attract assets of about $843.4-million in the six and a half months since inception, adding $18.0-million in June despite the market downturn (which by itself will have reduced assets by slightly over $16-million), and I feel that has had a great effect on the prices of its targetted preferreds and their close relations.

TXPR had returns over one- and three-months of -2.21% and -3.06%, respectively

Returns for the HIMIPref™ investment grade sub-indices for May were as follows:

HIMIPref™ Indices
June, 2013 Performance
Sub-Index Total Return
Ratchet N/A
FixFloat -4.09%
Floater +1.08%
OpRet -0.33%
SplitShare -0.86%
Interest N/A
PerpetualPremium -4.15%
PerpetualDiscount -10.22%
FixedReset -1.28%
DeemedRetractible -2.82%

Malachite Aggressive Preferred Fund’s Net Asset Value per Unit as of the close June 28, 2013, was 10.3261 after a distribution of 0.132348.

Returns to June 28, 2013
Period MAPF BMO-CM “50” Index TXPR
Total Return
CPD – according to Blackrock
One Month -3.65% -1.39% -2.21% -2.25%
Three Months -4.08% -2.00% -3.06% -3.15%
One Year +6.14% +3.01% +2.49% +1.82%
Two Years (annualized) +2.95% +3.80% +3.23% N/A
Three Years (annualized) +8.25% +7.17% +5.91% +5.22%
Four Years (annualized) +11.25% +8.52% +6.84% N/A
Five Years (annualized) +16.84% +6.72% +5.47% +4.80%
Six Years (annualized) +13.00% +4.79% +3.42%  
Seven Years (annualized) +11.86% +4.05%    
Eight Years (annualized) +10.92% +3.88%    
Nine Years (annualized) +10.80% +4.17%    
Ten Years (annualized) +11.72% +4.18%    
Eleven Years (annualized) +11.29% +4.52%    
Twelve Years (annualized) +11.63% +4.41%    
MAPF returns assume reinvestment of distributions, and are shown after expenses but before fees.
CPD Returns are for the NAV and are after all fees and expenses.
* CPD does not directly report its two- or four-year returns.
Figures for Omega Preferred Equity (which are after all fees and expenses) for 1-, 3- and 12-months are -2.01%, -2.38% and +2.33%, respectively, according to Morningstar after all fees & expenses. Three year performance is +5.85%; five year is +5.54%
Figures for Jov Leon Frazer Preferred Equity Fund Class I Units (which are after all fees and expenses) for 1-, 3- and 12-months are -1.54%, -2.14% and +0.96% respectively, according to Morningstar. Three Year performance is +3.25%
Figures for Manulife Preferred Income Fund (formerly AIC Preferred Income Fund) (which are after all fees and expenses) for 1-, 3- and 12-months are -3.84%, -4.76% & +0.73%, respectively. Three Year performance is +3.91%
Figures for Horizons AlphaPro Preferred Share ETF (which are after all fees and expenses) for 1-, 3- and 12-months are -1.93%, -2.27% & +2.85%, respectively.
Figures for Altamira Preferred Equity Fund are -2.30% and -2.97% for one- and three- months, respectively.
The figure for BMO S&P/TSX Laddered Preferred Share Index ETF is -1.77% and -3.07% for one- and three-months. [calculation by JH]

MAPF returns assume reinvestment of dividends, and are shown after expenses but before fees. Past performance is not a guarantee of future performance. You can lose money investing in Malachite Aggressive Preferred Fund or any other fund. For more information, see the fund’s main page. The fund is available either directly from Hymas Investment Management or through a brokerage account at Odlum Brown Limited.

A problem that has bedevilled the market over the past two years has been the OSFI decision not to grandfather Straight Perpetuals as Tier 1 bank capital, and their continued foot-dragging regarding a decision on insurer Straight Perpetuals has segmented the market to the point where trading has become much more difficult. The fund occasionally finds an attractive opportunity to trade between GWO issues, which have a good range of annual coupons (but in which trading is now hampered by the fact that the low-coupon issues are trading near par and are callable at par in the near term), but is “stuck” in the MFC and SLF issues, which have a much narrower range of coupon, while the IAG DeemedRetractibles are quite illiquid. Until the market became so grossly segmented, this was not so much of a problem – but now banks are not available to swap into (because they are so expensive) and non-regulated companies are likewise deprecated (because they are not DeemedRetractibles; they should not participate in the increase in value that will follow the OSFI decision I anticipate and, in addition, are analyzed as perpetuals). The fund’s portfolio is, in effect ‘locked in’ to the MFC & SLF issues due to projected gains from a future OSFI decision, to the detriment of trading gains particularly in May, 2013, when the three lowest-coupon SLF DeemedRetractibles (SLF.PR.C, SLF.PR.D and SLF.PR.E) were the worst performing DeemedRetractibles in the sub-index!

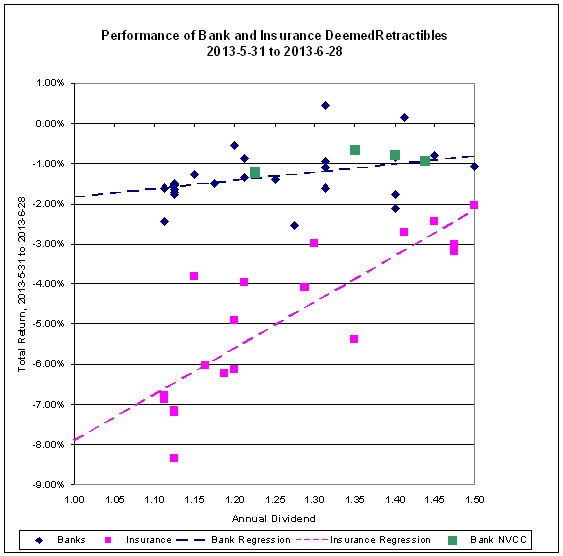
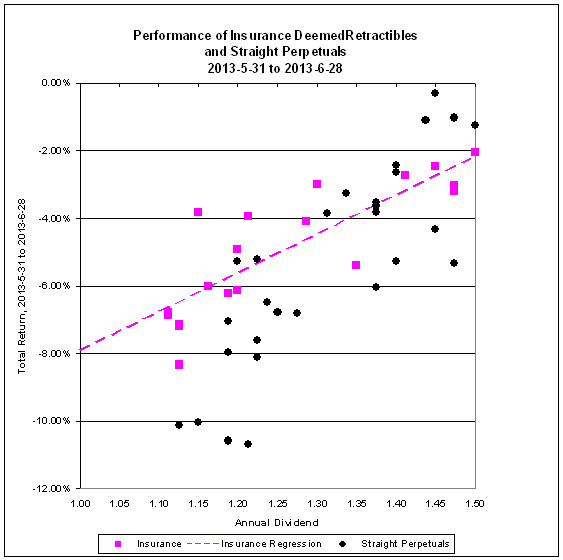
I have pointed out in the past that the market continues to treat regulated insurance issues (SLF, GWO) in much the same way unregulated issues (PWF) but there is a much more dramatic illustration of this than usual for the month of June.


Click for Big

Click for Big

As can be seen from the above two charts, DeemedRetractibles issued by insurers behaved much more like Straight Perpetuals than like Bank DeemedRetractibles. Another point worth noting is that the four bank issues which are, or can be, recognized by OSFI as having a NVCC clause (since they can be converted into common without consent by the holders) behaved more like Bank DeemedRetractibles than like the Straight Perpetuals they are.

As the fund holds a high proportion of insurer-issued DeemedRetractibles, fund performance was hurt by this phenomenon.

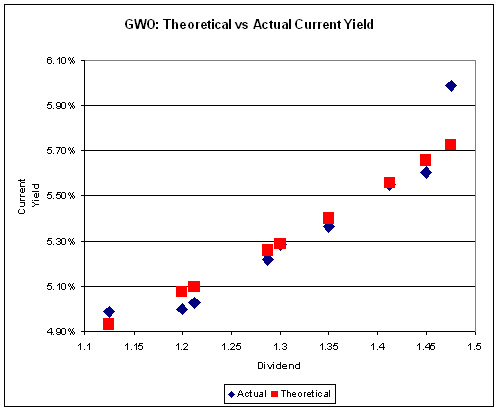
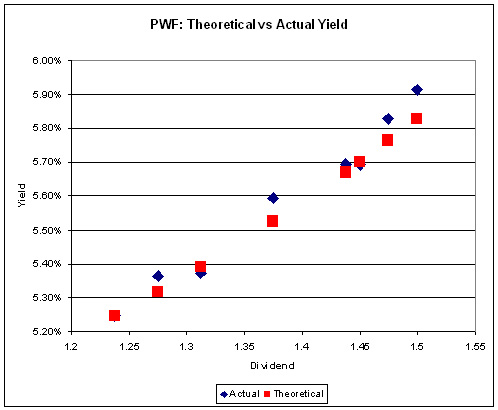
A side effect of the downdraft was the return of measurable Implied Volatility:


Click for Big

Click for Big
Implied Volatility of
Two Series of Issues
June 28, 2013
Issuer Pure Yield Implied Volatility
GWO 3.30% 28%
PWF 4.00% 25%

Those of you who have been paying attention will remember that in a “normal” market (which we have not seen in well over a year) the slope of this line is related to the implied volatility of yields in Black-Scholes theory, as discussed in the January, 2010, edition of PrefLetter. As has been previously noted, very high levels of Implied Volatility (in the 40% range) imply a very strong expectation of directionality in future prices – i.e, an expectation that all issues will be redeemed at par. The decline in Implied Volatility – which is still at very high levels – implies more uncertainty regarding this prediction.

Sometimes everything works … sometimes it’s 50-50 … sometimes nothing works. The fund seeks to earn incremental return by selling liquidity (that is, taking the other side of trades that other market participants are strongly motivated to execute), which can also be referred to as ‘trading noise’ – although for quite some time, noise trading has taken a distant second place to the sectoral play on insurance DeemedRetractibles. There were a lot of strongly motivated market participants during the Panic of 2007, generating a lot of noise! Unfortunately, the conditions of the Panic may never be repeated in my lifetime … but the fund will simply attempt to make trades when swaps seem profitable, without worrying about the level of monthly turnover.

There’s plenty of room for new money left in the fund. I have shown in recent issues of PrefLetter that market pricing for FixedResets is demonstrably stupid and I have lots of confidence – backed up by my bond portfolio management experience in the markets for Canadas and Treasuries, and equity trading on the NYSE & TSX – that there is enough demand for liquidity in any market to make the effort of providing it worthwhile (although the definition of “worthwhile” in terms of basis points of outperformance changes considerably from market to market!) I will continue to exert utmost efforts to outperform but it should be borne in mind that there will almost inevitably be periods of underperformance in the future.

The yields available on high quality preferred shares remain elevated, which is reflected in the current estimate of sustainable income.

Calculation of MAPF Sustainable Income Per Unit
Month NAVPU Portfolio
Average
YTW
Leverage
Divisor
Securities
Average
YTW
Capital
Gains
Multiplier
Sustainable
Income
per
current
Unit
June, 2007 9.3114 5.16% 1.03 5.01% 1.3240 0.3524
September 9.1489 5.35% 0.98 5.46% 1.3240 0.3773
December, 2007 9.0070 5.53% 0.942 5.87% 1.3240 0.3993
March, 2008 8.8512 6.17% 1.047 5.89% 1.3240 0.3938
June 8.3419 6.034% 0.952 6.338% 1.3240 $0.3993
September 8.1886 7.108% 0.969 7.335% 1.3240 $0.4537
December, 2008 8.0464 9.24% 1.008 9.166% 1.3240 $0.5571
March 2009 $8.8317 8.60% 0.995 8.802% 1.3240 $0.5872
June 10.9846 7.05% 0.999 7.057% 1.3240 $0.5855
September 12.3462 6.03% 0.998 6.042% 1.3240 $0.5634
December 2009 10.5662 5.74% 0.981 5.851% 1.1141 $0.5549
March 2010 10.2497 6.03% 0.992 6.079% 1.1141 $0.5593
June 10.5770 5.96% 0.996 5.984% 1.1141 $0.5681
September 11.3901 5.43% 0.980 5.540% 1.1141 $0.5664
December 2010 10.7659 5.37% 0.993 5.408% 1.0298 $0.5654
March, 2011 11.0560 6.00% 0.994 5.964% 1.0298 $0.6403
June 11.1194 5.87% 1.018 5.976% 1.0298 $0.6453
September 10.2709 6.10%
Note
1.001 6.106% 1.0298 $0.6090
December, 2011 10.0793 5.63%
Note
1.031 5.805% 1.0000 $0.5851
March, 2012 10.3944 5.13%
Note
0.996 5.109% 1.0000 $0.5310
June 10.2151 5.32%
Note
1.012 5.384% 1.0000 $0.5500
September 10.6703 4.61%
Note
0.997 4.624% 1.0000 $0.4934
December, 2012 10.8307 4.24% 0.989 4.287% 1.0000 $0.4643
March, 2013 10.9033 3.87% 0.996 3.886% 1.0000 $0.4237
June, 2013 10.3261 4.81% 0.998 4.80% 1.0000 $0.4957
NAVPU is shown after quarterly distributions of dividend income and annual distribution of capital gains.
Portfolio YTW includes cash (or margin borrowing), with an assumed interest rate of 0.00%
The Leverage Divisor indicates the level of cash in the account: if the portfolio is 1% in cash, the Leverage Divisor will be 0.99
Securities YTW divides “Portfolio YTW” by the “Leverage Divisor” to show the average YTW on the securities held; this assumes that the cash is invested in (or raised from) all securities held, in proportion to their holdings.
The Capital Gains Multiplier adjusts for the effects of Capital Gains Dividends. On 2009-12-31, there was a capital gains distribution of $1.989262 which is assumed for this purpose to have been reinvested at the final price of $10.5662. Thus, a holder of one unit pre-distribution would have held 1.1883 units post-distribution; the CG Multiplier reflects this to make the time-series comparable. Note that Dividend Distributions are not assumed to be reinvested.
Sustainable Income is the resultant estimate of the fund’s dividend income per current unit, before fees and expenses. Note that a “current unit” includes reinvestment of prior capital gains; a unitholder would have had the calculated sustainable income with only, say, 0.9 units in the past which, with reinvestment of capital gains, would become 1.0 current units.
DeemedRetractibles are comprised of all Straight Perpetuals (both PerpetualDiscount and PerpetualPremium) issued by BMO, BNS, CM, ELF, GWO, HSB, IAG, MFC, NA, RY, SLF and TD, which are not exchangable into common at the option of the company (definition refined in May, 2011). These issues are analyzed as if their prospectuses included a requirement to redeem at par on or prior to 2022-1-31 (banks) or 2025-1-31 (insurers and insurance holding companies), in addition to the call schedule explicitly defined. See OSFI Does Not Grandfather Extant Tier 1 Capital, CM.PR.D, CM.PR.E, CM.PR.G: Seeking NVCC Status and the January, February, March and June, 2011, editions of PrefLetter for the rationale behind this analysis.
Yields for September, 2011, to January, 2012, were calculated by imposing a cap of 10% on the yields of YLO issues held, in order to avoid their extremely high calculated yields distorting the calculation and to reflect the uncertainty in the marketplace that these yields will be realized. From February to September 2012, yields on these issues have been set to zero. All YLO issues held were sold in October 2012.

Significant positions were held in DeemedRetractible and FixedReset issues on April 30; all of these currently have their yields calculated with the presumption that they will be called by the issuers at par prior to 2022-1-31 (banks) or 2025-1-31 (insurers and insurance holding companies). This presents another complication in the calculation of sustainable yield. The fund also holds positions in various SplitShare issues which also have their yields calculated with the expectation of a maturity at par.

I no longer show calculations that assume the conversion of the entire portfolio into PerpetualDiscounts, as the fund has no holdings of these issues.

I will also note that the sustainable yield calculated above is not directly comparable with any yield calculation currently reported by any other preferred share fund as far as I am aware. The Sustainable Yield depends on:
i) Calculating Yield-to-Worst for each instrument and using this yield for reporting purposes;
ii) Using the contemporary value of Five-Year Canadas (set at 1.31% for the May 31 calculation) to estimate dividends after reset for FixedResets.

Most funds report Current Yield. For instance, ZPR reports a “Portfolio Yield” of 4.83% as of June 28, 2013 and notes:

Portfolio yield is calculated as the most recent income received by the ETF in the form of dividends interest and other income annualized based on the payment frequently divided by the current market value of ETFs investments.

In other words – it’s the Current Yield, a meaningless number. The Current Yield of MAPF is 5.25%, but I will neither report that with any degree of prominence nor take any great pleasure in the fact that it’s higher than the ZPR number. It’s meaningless; to accord it any prominence in portfolio reporting is misleading.

It should be noted that the concept of this Sustainable Income calculation was developed when the fund’s holdings were overwhelmingly PerpetualDiscounts – see, for instance, the bottom of the market in November 2008. It is easy to understand that for a PerpetualDiscount, the technique of multiplying yield by price will indeed result in the coupon – a PerpetualDiscount paying $1 annually will show a Sustainable Income of $1, regardless of whether the price is $24 or $17.

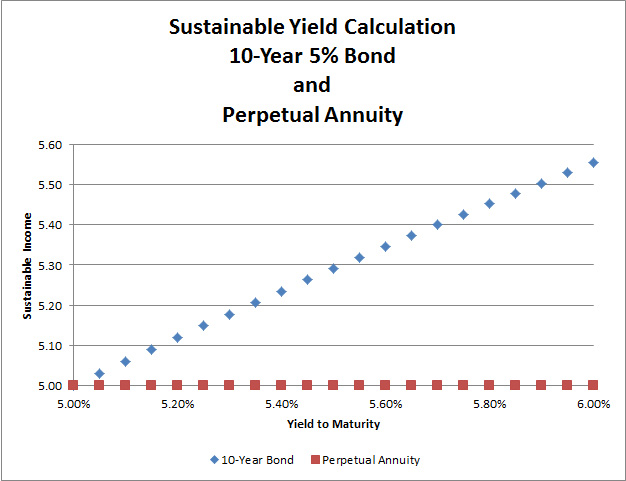
Things are not quite so neat when maturity dates and maturity prices that are different from the current price are thrown into the mix. If we take a notional Straight Perpetual paying $5 annually, the price is $100 when the yield is 5% (all this ignores option effects). As the yield increases to 6%, the price declines to 83.33; and 83.33 x 6% is the same $5. Good enough.

But a ten year bond, priced at 100 when the yield is equal to its coupon of 5%, will decline in price to 92.56; and 92.56 x 6% is 5.55; thus, the calculated Sustainable Income has increased as the price has declined as shown in the graph:


Click for Big

The difference is because the bond’s yield calculation includes the amortization of the discount; therefore, so does the Sustainable Income estimate.

Thus, the decline in the MAPF Sustainable Income from $0.5500 per unit in June, 2012, to $0.4957 per unit in June, 2013, should be looked at as a simple consequence of the fund’s holdings; virtually all of which have their yields calculated in a manner closer to bonds than to Perpetual Annuities.

Different assumptions lead to different results from the calculation, but the overall positive trend is apparent. I’m very pleased with the long-term results! It will be noted that if there was no trading in the portfolio, one would expect the sustainable yield to be constant (before fees and expenses). The success of the fund’s trading is showing up in

  • the very good performance against the index
  • the long term increases in sustainable income per unit

As has been noted, the fund has maintained a credit quality equal to or better than the index; outperformance is due to exploitation of trading anomalies.

Again, there are no predictions for the future! The fund will continue to trade between issues in an attempt to exploit market gaps in liquidity, in an effort to outperform the index and keep the sustainable income per unit – however calculated! – growing.

FCS.PR.B Retraction Results

Wednesday, July 3rd, 2013

Faircourt Asset Management has announced (although not yet on their website) that in its role as:

the Manager of Faircourt Split Trust (the “Trust”) (TSX: FCS.UN; FCS.PR.B), announced today that 53,892 Combined Units (consisting of one Trust Unit and one Preferred Security) and 899,037 Trust Units (without matching Preferred Securities) were submitted for redemption on May 31, 2013. Securityholders who tendered Combined Units for redemption will be entitled to receive $14.1890 per Combined Unit, which is equal to $4.1822, being the Net Asset Value per Trust Unit calculated using a three day volume weighted average price for exchange-traded securities held by the Trust, determined as of June 28, 2013 less costs of funding the redemption, including commissions, plus the $10.00 principal amount of the Preferred Security, plus all accrued and unpaid interest thereon to but excluding July 4, 2013 (the “Payment Date”). Securityholders who submitted unmatched Trust Units will receive $4.1822 per Trust Unit. Payment in respect of the redemptions of Combined Units and unmatched Trust Units will be made in full on the Payment Date.

As of December 31, 2012, there 3,253,623 Trust Units (FCS.UN) and 5,290,665 preferred shares (FCS.PR.B) outstanding. Assuming that there have been no intervening changes in these figures, the numbers are now 2,300,694 and 5,236,773, respectively.

Given that the June 26 NAV was $4.20 for FCS.UN and $10.00 for FCS.PR.B, this implies that the Asset Coverage Ratio is a pretty awful 1.2-:1. Faircourt has in the past occasionally reacted to low Asset Coverage by redeeming Preferred Shares, but there is no guarantee that will happen again.

FCS.PR.B was last mentioned on PrefBlog when DBRS confirmed it at Pfd-3(low) in September 2012 when the Asset Coverage ratio was 1.4-:1.

TD.PR.S To Reset To 3.371%

Wednesday, July 3rd, 2013

Toronto-Dominion Bank has announced:

the applicable dividend rates for its Non-Cumulative 5-Year Rate Reset Preferred Shares, Series S (the “Series S Shares”) and Non-Cumulative Floating Rate Preferred Shares, Series T (the “Series T Shares”).

With respect to any Series S Shares that remain outstanding after July 31, 2013, holders of the Series S Shares will be entitled to receive quarterly fixed non-cumulative preferential cash dividends, as and when declared by the Board of Directors of TD, subject to the provisions of the Bank Act (Canada). The dividend rate for the 5-year period from and including July 31, 2013 to but excluding July 31, 2018 will be 3.371%, being equal to the 5-Year Government of Canada bond yield determined as at July 2, 2013 plus 1.60%, as determined in accordance with the terms of the Series S Shares.

With respect to any Series T Shares that may be issued on July 31, 2013, holders of the Series T Shares will be entitled to receive quarterly floating rate non-cumulative preferential cash dividends, calculated on the basis of the actual number of days elapsed in such quarterly period divided by 365, as and when declared by the Board of Directors of TD, subject to the provisions of the Bank Act (Canada). The dividend rate for the floating rate period from and including July 31, 2013 to but excluding October 31, 2013 will be 2.624%, being equal to the 90-day Government of Canada Treasury Bill yield determined as of July 2, 2013 plus 1.60%, as determined in accordance with the terms of the Series T Shares.

Beneficial owners of Series S Shares who wish to exercise their conversion right should communicate as soon as possible with their broker or other nominee to obtain instructions for exercising such right on or prior to the deadline for exercise, which is 5:00 p.m. (Toronto time) on July 16, 2013.

A rate of 3.371% implies that the break-even rate on 3-month bills (the average bill yield that will result in total dividends over the next five years being equal for both series) is 1.771%, about 75bp over current levels. If we assume that hikes in the Bank of Canada overnight rate are transmitted 1:1 to the 3-month bills market (a very reasonable assumption) this means that there must be six hikes evenly spaced over the next five years in order for the break-even rate to be achieved. This strikes me as a reasonably good bet.

In addition, I suggest that surprises to the upside over the next five years are more likely than surprises to the downside; the Floaters will provide insurance against such a contingency.

Finally, as discussed in the post TD.PR.S To Remain Outstanding, the market seems to have some kind of love affair going on with the only FloatingReset issue outstanding so far, BNS.PR.A, which is currently bid at 25.95, compared to 24.85 for BNS.PR.P, its “Strong Pair” counterpart. If these numbers are input into the Pairs Equivalency Calculator, we find that the break-even three-month bill rate for the BNS P/A Strong Pair is 2.36%. If we then put in the current price of TD.PR.S of 25.11 and jiggle the presumed price of TD.PR.T until we reach the same figure (note that the increments are different!) we solve for a projected price of TD.PR.T of 25.75.

For these reasons I recommend conversion from the extant TD.PR.S to the new Series T.

July 2, 2013

Wednesday, July 3rd, 2013

Hands up who’s happy it’s not June!

Witness the record $61.7 billion of redemptions in U.S.-listed bond mutual funds and exchange-traded funds through June 24, according to TrimTabs Investment Research. That sum broke the previous monthly high of $41.8 billion, set in the scary days of October 2008.

“The unprecedented liquidation of bonds this month is a dramatic departure from recent trends,” David Santschi, chief executive officer of TrimTabs, said in a statement. “Before June, bond funds had posted inflows for 21 consecutive months.”

In May, Bill Gross’s Pimco Total Return Fund—the world’s largest—saw its first monthly withdrawals since 2011.

Also whipsawing is the otherwise sleepy $3.7 trillion municipal bond market, where the largest exchange-traded fund tracking the sector had its best two days since 2008 after falling to the cheapest price in two years. The $3.4 billion iShares S&P National AMT-Free Municipal Bond Fund, known as MUB, sold at a record 2.86 percent discount to the value of its assets on June 21 after Federal Reserve Chairman Ben Bernanke said the central bank may moderate purchases of federal and mortgage debt in 2013 and stop them around mid-2014.

The ratio of the yield of munis to those on Treasuries is about 115 percent, the highest since July 2012.

The factoids regarding US municipals is relevant to the Canadian preferred share market, since the motivation for owning them and the broad outlines of the investor base are similar.

OSC expenses are up 5.5% over last year, but revenue is up only a little more than inflation, at 2%. Some say this shows revenue isn’t growing fast enough.

Does this remind anyone of Toronto?

San Francisco’s median house price is poised to surpass $1 million this year after setting a record in May, the California Association of Realtors estimates. The county is the only one in the state with values to set a new high, said Leslie Appleton-Young, chief economist for the group. A limited supply of houses available for sale has allowed condo developers to step in and lure frustrated buyers such as Boortz.
Tishman Speyer Properties LP’s 655 luxury units in two towers south of the financial district, and the first phase of Lennar Corp. (LEN)’s Hunters Point project at a former naval shipyard with 480 studios and townhomes, are both scheduled to break ground today, according to the companies. The projects will add to 709 condos that were under way in the city at the end of May, according to Mark Co., a San Francisco-based firm specializing in condo marketing, the most since 2008.

Well – maybe this part is different:

Buyers have been making down payments of 35 percent in a market awash in wealth from tech workers and overseas investors, Mark said.

Still, SF’s condo boom is small potatoes by Toronto standards:

In March, active condo listings for sale on the MLS rose 8 per cent over last year to hit a record high for the month. At the same time, condo sales slumped 18 per cent. Compounding this growing supply-demand imbalance is the 55,000 new condo units currently under construction in the city, the majority of which are set to hit the market through the rest of the year and into 2014.

San Francisco has a population of only 800-odd thousand, but still!

Oh, boy! Nowadays an eager young kid can get a Bachelor of Boxtickingology!

York University’s business school has created a new specialty program to train business students to become financial regulators – or at least to work with them from within the banking industry.

The Schulich School of Business said Tuesday it has created a new 12-month specialty stream called regulatory affairs for financial institutions as part of its Masters of Finance program.

It was another day of solid recovery for the Canadian preferred share market, with PerpetualDiscounts (yes! They now outnumber PerpetualPremiums!) winning 36bp, FixedResets gaining 10bp and DeemedRetractibles up 18bp. The performance highlights table is suitably lengthy, markedly skewed towards winners. Volume was very low.

HIMIPref™ Preferred Indices
These values reflect the December 2008 revision of the HIMIPref™ Indices

Values are provisional and are finalized monthly
Index Mean
Current
Yield
(at bid)
Median
YTW
Median
Average
Trading
Value
Median
Mod Dur
(YTW)
Issues Day’s Perf. Index Value
Ratchet 0.00 % 0.00 % 0 0.00 0 -0.9070 % 2,555.9
FixedFloater 4.22 % 3.55 % 44,067 18.17 1 -1.0110 % 3,894.8
Floater 2.75 % 2.91 % 78,684 19.99 4 -0.9070 % 2,759.7
OpRet 4.86 % 3.34 % 68,375 0.16 5 0.0704 % 2,611.7
SplitShare 4.68 % 4.26 % 78,034 3.97 6 0.0731 % 2,962.7
Interest-Bearing 0.00 % 0.00 % 0 0.00 0 0.0704 % 2,388.2
Perpetual-Premium 5.61 % 3.53 % 106,302 0.08 12 0.0960 % 2,275.2
Perpetual-Discount 5.37 % 5.39 % 144,304 14.71 26 0.3579 % 2,391.3
FixedReset 4.95 % 3.47 % 243,020 3.60 83 0.1038 % 2,482.0
Deemed-Retractible 5.05 % 4.52 % 178,404 4.88 44 0.1852 % 2,388.6
Performance Highlights
Issue Index Change Notes
CIU.PR.C FixedReset -9.45 % A ludicrous quote since no shares traded today and the last trade was at 24.35.
YTW SCENARIO
Maturity Type : Limit Maturity
Maturity Date : 2043-07-02
Maturity Price : 21.80
Evaluated at bid price : 22.05
Bid-YTW : 3.67 %
TRI.PR.B Floater -1.66 % YTW SCENARIO
Maturity Type : Limit Maturity
Maturity Date : 2043-07-02
Maturity Price : 22.88
Evaluated at bid price : 23.15
Bid-YTW : 2.25 %
BAM.PR.G FixedFloater -1.01 % YTW SCENARIO
Maturity Type : Limit Maturity
Maturity Date : 2043-07-02
Maturity Price : 22.83
Evaluated at bid price : 22.52
Bid-YTW : 3.55 %
SLF.PR.G FixedReset 1.07 % YTW SCENARIO
Maturity Type : Hard Maturity
Maturity Date : 2025-01-31
Maturity Price : 25.00
Evaluated at bid price : 24.51
Bid-YTW : 3.62 %
GWO.PR.I Deemed-Retractible 1.11 % YTW SCENARIO
Maturity Type : Hard Maturity
Maturity Date : 2025-01-31
Maturity Price : 25.00
Evaluated at bid price : 22.80
Bid-YTW : 5.57 %
GWO.PR.R Deemed-Retractible 1.13 % YTW SCENARIO
Maturity Type : Hard Maturity
Maturity Date : 2025-01-31
Maturity Price : 25.00
Evaluated at bid price : 24.27
Bid-YTW : 5.17 %
HSE.PR.A FixedReset 1.26 % YTW SCENARIO
Maturity Type : Limit Maturity
Maturity Date : 2043-07-02
Maturity Price : 23.38
Evaluated at bid price : 24.87
Bid-YTW : 3.56 %
BAM.PF.D Perpetual-Discount 1.29 % YTW SCENARIO
Maturity Type : Limit Maturity
Maturity Date : 2043-07-02
Maturity Price : 22.42
Evaluated at bid price : 22.72
Bid-YTW : 5.43 %
VNR.PR.A FixedReset 1.39 % YTW SCENARIO
Maturity Type : Call
Maturity Date : 2017-10-15
Maturity Price : 25.00
Evaluated at bid price : 25.60
Bid-YTW : 4.00 %
CU.PR.G Perpetual-Discount 1.67 % YTW SCENARIO
Maturity Type : Limit Maturity
Maturity Date : 2043-07-02
Maturity Price : 22.17
Evaluated at bid price : 22.52
Bid-YTW : 5.05 %
BAM.PF.C Perpetual-Discount 1.67 % YTW SCENARIO
Maturity Type : Limit Maturity
Maturity Date : 2043-07-02
Maturity Price : 21.56
Evaluated at bid price : 21.88
Bid-YTW : 5.56 %
BNS.PR.K Deemed-Retractible 1.84 % YTW SCENARIO
Maturity Type : Call
Maturity Date : 2013-08-01
Maturity Price : 25.25
Evaluated at bid price : 25.50
Bid-YTW : -11.49 %
GWO.PR.F Deemed-Retractible 2.03 % YTW SCENARIO
Maturity Type : Call
Maturity Date : 2013-08-01
Maturity Price : 25.00
Evaluated at bid price : 25.13
Bid-YTW : -0.04 %
BAM.PR.X FixedReset 3.20 % YTW SCENARIO
Maturity Type : Limit Maturity
Maturity Date : 2043-07-02
Maturity Price : 22.93
Evaluated at bid price : 24.16
Bid-YTW : 3.83 %
Volume Highlights
Issue Index Shares
Traded
Notes
PWF.PR.R Perpetual-Discount 33,290 Scotia crossed 27,800 at 25.00.
YTW SCENARIO
Maturity Type : Limit Maturity
Maturity Date : 2043-07-02
Maturity Price : 24.64
Evaluated at bid price : 25.05
Bid-YTW : 5.57 %
ENB.PR.F FixedReset 30,540 National crossed 25,000 at 25.05.
YTW SCENARIO
Maturity Type : Call
Maturity Date : 2018-06-01
Maturity Price : 25.00
Evaluated at bid price : 25.03
Bid-YTW : 4.07 %
BNS.PR.R FixedReset 28,799 TD bought 10,000 from CIBC at 25.07.
YTW SCENARIO
Maturity Type : Hard Maturity
Maturity Date : 2022-01-31
Maturity Price : 25.00
Evaluated at bid price : 25.07
Bid-YTW : 3.67 %
ENB.PR.P FixedReset 19,138 YTW SCENARIO
Maturity Type : Call
Maturity Date : 2019-03-01
Maturity Price : 25.00
Evaluated at bid price : 25.08
Bid-YTW : 4.02 %
TD.PR.S FixedReset 16,705 YTW SCENARIO
Maturity Type : Hard Maturity
Maturity Date : 2022-01-31
Maturity Price : 25.00
Evaluated at bid price : 25.06
Bid-YTW : 3.47 %
BAM.PF.D Perpetual-Discount 16,445 Recent new issue.
YTW SCENARIO
Maturity Type : Limit Maturity
Maturity Date : 2043-07-02
Maturity Price : 22.42
Evaluated at bid price : 22.72
Bid-YTW : 5.43 %
There were 15 other index-included issues trading in excess of 10,000 shares.
Wide Spread Highlights
Issue Index Quote Data and Yield Notes
CIU.PR.C FixedReset Quote: 22.05 – 25.00
Spot Rate : 2.9500
Average : 1.7846

YTW SCENARIO
Maturity Type : Limit Maturity
Maturity Date : 2043-07-02
Maturity Price : 21.80
Evaluated at bid price : 22.05
Bid-YTW : 3.67 %

IAG.PR.F Deemed-Retractible Quote: 25.65 – 26.11
Spot Rate : 0.4600
Average : 0.2800

YTW SCENARIO
Maturity Type : Call
Maturity Date : 2019-03-31
Maturity Price : 25.00
Evaluated at bid price : 25.65
Bid-YTW : 5.42 %

BAM.PF.A FixedReset Quote: 25.35 – 25.85
Spot Rate : 0.5000
Average : 0.3525

YTW SCENARIO
Maturity Type : Call
Maturity Date : 2018-09-30
Maturity Price : 25.00
Evaluated at bid price : 25.35
Bid-YTW : 4.23 %

BNS.PR.T FixedReset Quote: 25.55 – 25.87
Spot Rate : 0.3200
Average : 0.2041

YTW SCENARIO
Maturity Type : Call
Maturity Date : 2014-04-25
Maturity Price : 25.00
Evaluated at bid price : 25.55
Bid-YTW : 2.85 %

TRI.PR.B Floater Quote: 23.15 – 23.60
Spot Rate : 0.4500
Average : 0.3392

YTW SCENARIO
Maturity Type : Limit Maturity
Maturity Date : 2043-07-02
Maturity Price : 22.88
Evaluated at bid price : 23.15
Bid-YTW : 2.25 %

RY.PR.C Deemed-Retractible Quote: 25.19 – 25.46
Spot Rate : 0.2700
Average : 0.1732

YTW SCENARIO
Maturity Type : Call
Maturity Date : 2015-11-24
Maturity Price : 25.00
Evaluated at bid price : 25.19
Bid-YTW : 4.50 %

MAPF Portfolio Composition: June 2013

Tuesday, July 2nd, 2013

Turnover picked up with the downturn in June, to about 11%.

There is extreme segmentation in the marketplace, with OSFI’s NVCC rule changes in February 2011 having had the effect of splitting the formerly relatively homogeneous Straight Perpetual class of preferreds into three parts:

  • Unaffected Straight Perpetuals
  • DeemedRetractibles explicitly subject to the rules (banks)
  • DeemedRetractibles considered by me, but not (yet!) by the market, to be likely to be explicitly subject to the rules in the future (insurers and insurance holding companies)

This segmentation, and the extreme valuation differences between the segments, has cut down markedly on the opportunities for trading. Another trend that hasn’t helped has been the migration of PerpetualDiscounts into PerpetualPremiums (due to price increases) – many of the PerpetualPremiums have negative Yields-to-Worst and those that don’t aren’t particularly thrilling; speaking very generally, PerpetualPremiums are to be avoided, not traded! This effect has caused the first of the three segments noted above to be untradeable for most practical purposes.

To make this more clear, it used to be that there were 70-odd Straight Perpetuals and I was more or less indifferent as to which ones I owned (subject, of course, to issuer concentration concerns and other risk management factors). Thus, if any one of these 70 were to go down in price by – say – $0.25, I would quite often have something in inventory that I’d be willing to swap for it. The segmentation means that I am no longer indifferent; in addition to checking the valuation of a potential buy to its peers, I also have to check its peer group. This cuts down on the potential for trading.

There is no real hope that this situation will be corrected in the near-term. OSFI has indicated that the long-promised “Draft Definition of Capital” for insurers will not be issued “for public consultation in late 2012 or early 2013”, as they fear that it might encourage speculation in the marketplace. It is not clear why OSFI is so afraid of informed speculation, since the constant speculation in the marketplace is currently less informed than it would be with a little bit of regulatory clarity.

As a result of this delay, I have extended the Deemed Maturity date for insurers and insurance holding companies by three years (to 2025-1-31), in the expectation that when OSFI finally does provide clarity, they will allow the same degree of lead-in time for these companies as they did for banks. This has obviously had a major effect on the durations of preferred shares subject to the change but, fortunately, not much on their calculated yields as most of these issues are either trading near par or were trading at sufficient premium that a par call was expected on economic grounds.

Sectoral distribution of the MAPF portfolio on June 28 was as follows:

MAPF Sectoral Analysis 2013-6-28
HIMI Indices Sector Weighting YTW ModDur
Ratchet 0% N/A N/A
FixFloat 0% N/A N/A
Floater 0% N/A N/A
OpRet 0% N/A N/A
SplitShare 19.3% (+8.0) 4.36% 6.42
Interest Rearing 0% N/A N/A
PerpetualPremium 0.0% (0) N/A N/A
PerpetualDiscount 0.7% (+0.7) 5.14% 15.17
Fixed-Reset 23.1% (-7.8) 2.92% 0.95
Deemed-Retractible 52.5% (+0.6) 5.57% 8.77
Scraps (Various) 4.6% (-0.9) 7.18% 9.38
Cash -0.2% (-0.7) 0.00% 0.00
Total 100% 4.81% 6.60
Totals and changes will not add precisely due to rounding. Bracketted figures represent change from April month-end. Cash is included in totals with duration and yield both equal to zero.
DeemedRetractibles are comprised of all Straight Perpetuals (both PerpetualDiscount and PerpetualPremium) issued by BMO, BNS, CM, ELF, GWO, HSB, IAG, MFC, NA, RY, SLF and TD, which are not exchangable into common at the option of the company. These issues are analyzed as if their prospectuses included a requirement to redeem at par on or prior to 2022-1-31 (banks) or 2025-1-3 (insurers and insurance holding companies), in addition to the call schedule explicitly defined. See OSFI Does Not Grandfather Extant Tier 1 Capital, CM.PR.D, CM.PR.E, CM.PR.G: NVCC Status Confirmed and the January, February, March and June, 2011, editions of PrefLetter for the rationale behind this analysis. (all recent editions have a short summary of the argument included in the “DeemedRetractible” section)

Note that the estimate for the time this will become effective for insurers and insurance holding companies was extended by three years in April 2013, due to the delays in OSFI’s providing clarity on the issue.

The “total” reflects the un-leveraged total portfolio (i.e., cash is included in the portfolio calculations and is deemed to have a duration and yield of 0.00.). MAPF will often have relatively large cash balances, both credit and debit, to facilitate trading. Figures presented in the table have been rounded to the indicated precision.

Credit distribution is:

MAPF Credit Analysis 2013-6-28
DBRS Rating Weighting
Pfd-1 0 (0)
Pfd-1(low) 43.0% (+4.7)
Pfd-2(high) 33.7% (-6.2)
Pfd-2 8.4% (-0.1)
Pfd-2(low) 10.6% (+0.2)
Pfd-3(high) 0.0% (-1.0)
Pfd-3 1.7% (+0.2)
Pfd-3(low) 0.6% (0)
Pfd-4(high) 0.4% (0)
Pfd-4 1.1% (-0.1)
Pfd-4(low) 0.8% (0)
Cash -0.2% (-0.7)
Totals will not add precisely due to rounding. Bracketted figures represent change from April month-end.

Liquidity Distribution is:

MAPF Liquidity Analysis 2013-6-28
Average Daily Trading Weighting
<$50,000 0.6% (-0.8)
$50,000 – $100,000 6.7% (-17.5)
$100,000 – $200,000 32.0% (-2.8)
$200,000 – $300,000 36.2% (+4.8)
>$300,000 24.8% (+17.0)
Cash -0.2% (-0.7)
Totals will not add precisely due to rounding. Bracketted figures represent change from April month-end.

MAPF is, of course, Malachite Aggressive Preferred Fund, a “unit trust” managed by Hymas Investment Management Inc. Further information and links to performance, audited financials and subscription information are available the fund’s web page. The fund may be purchased either directly from Hymas Investment Management or through a brokerage account at Odlum Brown Limited. A “unit trust” is like a regular mutual fund, but is sold by offering memorandum rather than prospectus. This is cheaper, but means subscription is restricted to “accredited investors” (as defined by the Ontario Securities Commission) or those who subscribe for $150,000+. Fund past performances are not a guarantee of future performance. You can lose money investing in MAPF or any other fund.

A similar portfolio composition analysis has been performed on the Claymore Preferred Share ETF (symbol CPD) (and other funds) as of August 31, 2012, and published in the October (mainly methodology), November (most funds), and December (ZPR) 2012, PrefLetter. While direct comparisons are difficult due to the introduction of the DeemedRetractible class of preferred share (see above) it is fair to say:

  • MAPF credit quality is better
  • MAPF liquidity is a lower
  • MAPF Yield is higher
  • Weightings in
    • MAPF is much more exposed to DeemedRetractibles
    • MAPF is much less exposed to Operating Retractibles
    • MAPF is much more exposed to SplitShares
    • MAPF is less exposed to FixFloat / Floater / Ratchet
    • MAPF weighting in FixedResets is much lower