Archive for November, 2013

November 5, 2013

Tuesday, November 5th, 2013

OSFI has released a letter to IASB about Insurance Contracts. Their first objection is serious – very serious indeed:

We are concerned that, if the ED is finalized as proposed, OSFI would likely need to make significant adjustments to the financial statements for regulatory capital purposes.

Oh golly! They might have to change their regulatory capital calculations!

Funny, I would have thought that the sole legitimate consideration was: do the proposed changes provide a materially better reflection of reality than the prior accounting paradigm? But I suppose I am only parading my naivety.

Their second objection is equally oblivious to the issues:

Moreover, the adjustments in question may have the effect of relaxing rather than constraining the assumptions that lie behind the requirements of the standard.

Well, that’s fine – as long as the new standards reflect reality better than the old ones, who cares whether they’re relaxing or constraining?

The meat of their letter highlights some motherhood issues, but doesn’t provide any suggestions:

In our 2010 comment letter, OSFI noted the potential for significant, inappropriate volatility if short term fluctuating market rates were used to discount very long-duration liabilities. The IASB has confirmed that either a bottom-up or top-down approach could be used to determine the discount rate. However, due to the high-level nature of a principles based standard, we understand there are a wide range of views of how the top-down approach could be interpreted for the long duration discount rates as currently drafted in the ED. We are pleased that the exposure draft allows more weight to be put on long term estimates than on short-term fluctuations when forecasting unobservable discount rates for long-duration liabilities. We believe current period fluctuations should not exaggerate the volatility of very long-dated liabilities. As such, long-duration liabilities beyond the observable period where deep and liquid markets exist should grade to a slow-moving long-term rate.

When discussing Asset Liability Management, they’re a little shy about stating their concern directly:

We believe the use of OCI for insurance contract liability measurement should be optional, rather than mandatory as currently proposed in the ED.

Asset Liability Management (ALM) practices are designed to ensure that there are sufficient assets to support insurance liabilities. This is achieved by investing in various types of assets with different attributes (e.g. yield, cash flow, risk and duration) that best fulfill various insurance liabilities obligations. Accounting standards should capture economic mismatches between assets and the insurance contract liabilities they support, but standards should not create accounting mismatches on their own. We believe the mandatory use of OCI may have an unintended consequence by reflecting both economic and accounting mismatches in the financial statements, making it difficult for users to distinguish between true economic mismatches and those created by accounting standards.

In order to fulfill various types of insurance liabilities obligations, investing in assets like mortgages, equities and derivatives instead of plain vanilla bonds could be appropriate for a portfolio that is well managed and diversified. We believe the interaction between IFRS 4 and IFRS 9 needs further consideration to take into account ALM practices of life insurers and to reduce accounting mismatches.

A very bureaucratic letter! All the substance will take place behind closed doors, to ensure opacity and non-accountability.

The latest housing bubble worry emanates from Australia:

Australia, where housing accounts for about 60 percent of average household wealth compared with a global average of 45 percent, joins countries from Canada to Sweden to China seeing rapid price gains amid low borrowing costs that are sparking fears of a housing bubble. For now, constrained housing supply and demand from investors are driving prices higher, overpowering the downdraft from slower economic growth and a rising jobless rate.

In Sydney, the nation’s most populous city, the average home price surged 13 percent in the 10 months to Oct. 31 to a record A$718,122 according to the RP Data-Rismark home value index. That compares with $806,000 in New York as of Sept. 30, according to the Real Estate Board of New York, and 331,338 pounds ($536,237) in London, according to the Nationwide Building Society.

A report to the U.S. Treasury’s Borrowing Advisory committee titled Assessing fixed income market liquidity makes some cogent points:

  • ● Market turnover has if anything increased since the financial crisis
  • ● But liquidity is about much more than turnover
    • – Tendency to disappear abruptly when really needed
  • ● Primary liquidity not really a problem; major issues all in secondary
  • ● Neither turnover nor the street have been able to keep pace with the massive expansion in markets
  • ● Regulations have created multiple constraints likely to curtail liquidity when it is really needed:
    • – Most have pushed liquidity towards Treasuries, reducing it in risky assets:
    • • Basel risk-weightings, swaps clearing, LCR requirements
      • – Now, supplementary leverage ratios risk curtailing it even in Treasuries: dealers likely to meet requirements by reducing assets rather than raising capital
    • ● Effects of regulations to date have been offset by Fed policy pushing investors in the opposite direction:
      • – Significant demand for fixed income assets in general, and risky assets in particular
    • ● Technology and shifts in market structure have added to the appearance of liquidity, but done little to add depth
    • ● Potential for significant dislocation when investor flows reverse


    Secondary trading requires risk warehouses

    Capital cost under Basel 3 … 3-5x increase in charges for corporate bonds

    Dealers can no longer afford to act as credit warehouses

There are a lot of great charts in those slides and I thoroughly recommend a full reading of the presentation. It strikes me that at some point, some large hedge fund – perhaps one that already acts as an intermediary for retail equity trades, standing between the brokerage house and the exchanges – will find it worth their while to make markets from their long positions. I think that – subject to regulatory bullshit, which is probably extremely bullshitty – the big Canadian funds should be doing that now. Why not?

It was a mixed day for the Canadian preferred share market, with PerpetualDiscounts up 5bp, FixedResets gaining 2bp and DeemedRetractibles off 8bp. Volatility was dominated by FixedResets. Volume was well above average.

HIMIPref™ Preferred Indices
These values reflect the December 2008 revision of the HIMIPref™ Indices

Values are provisional and are finalized monthly
Index Mean
Current
Yield
(at bid)
Median
YTW
Median
Average
Trading
Value
Median
Mod Dur
(YTW)
Issues Day’s Perf. Index Value
Ratchet 0.00 % 0.00 % 0 0.00 0 0.4919 % 2,502.7
FixedFloater 4.21 % 3.49 % 27,719 18.40 1 1.0753 % 3,986.0
Floater 2.96 % 2.99 % 64,160 19.72 3 0.4919 % 2,702.2
OpRet 4.63 % 3.16 % 67,451 0.56 3 0.1030 % 2,636.4
SplitShare 4.74 % 5.08 % 68,605 3.66 6 0.2154 % 2,962.9
Interest-Bearing 0.00 % 0.00 % 0 0.00 0 0.1030 % 2,410.8
Perpetual-Premium 5.58 % 4.35 % 126,215 0.30 11 -0.0611 % 2,304.4
Perpetual-Discount 5.51 % 5.53 % 181,283 14.56 27 0.0481 % 2,380.2
FixedReset 5.00 % 3.61 % 227,137 3.35 82 0.0158 % 2,460.8
Deemed-Retractible 5.08 % 4.08 % 193,768 1.65 42 -0.0822 % 2,409.8
FloatingReset 2.62 % 2.38 % 297,228 4.51 5 -0.0793 % 2,456.0
Performance Highlights
Issue Index Change Notes
TRP.PR.A FixedReset -1.83 % YTW SCENARIO
Maturity Type : Limit Maturity
Maturity Date : 2043-11-05
Maturity Price : 23.05
Evaluated at bid price : 23.56
Bid-YTW : 3.98 %
FTS.PR.H FixedReset -1.55 % YTW SCENARIO
Maturity Type : Limit Maturity
Maturity Date : 2043-11-05
Maturity Price : 21.36
Evaluated at bid price : 21.66
Bid-YTW : 3.84 %
ELF.PR.G Perpetual-Discount -1.49 % YTW SCENARIO
Maturity Type : Limit Maturity
Maturity Date : 2043-11-05
Maturity Price : 21.77
Evaluated at bid price : 21.77
Bid-YTW : 5.51 %
BAM.PR.X FixedReset -1.42 % YTW SCENARIO
Maturity Type : Limit Maturity
Maturity Date : 2043-11-05
Maturity Price : 21.82
Evaluated at bid price : 22.16
Bid-YTW : 4.26 %
BAM.PR.G FixedFloater 1.08 % YTW SCENARIO
Maturity Type : Limit Maturity
Maturity Date : 2043-11-05
Maturity Price : 22.80
Evaluated at bid price : 22.56
Bid-YTW : 3.49 %
SLF.PR.G FixedReset 1.09 % YTW SCENARIO
Maturity Type : Hard Maturity
Maturity Date : 2025-01-31
Maturity Price : 25.00
Evaluated at bid price : 23.13
Bid-YTW : 4.27 %
BAM.PR.T FixedReset 1.15 % YTW SCENARIO
Maturity Type : Limit Maturity
Maturity Date : 2043-11-05
Maturity Price : 22.83
Evaluated at bid price : 23.81
Bid-YTW : 4.34 %
Volume Highlights
Issue Index Shares
Traded
Notes
W.PR.H Perpetual-Discount 61,700 TD crossed blocks of 30,000 and 25,000, both at 24.45.
YTW SCENARIO
Maturity Type : Limit Maturity
Maturity Date : 2043-11-05
Maturity Price : 24.20
Evaluated at bid price : 24.46
Bid-YTW : 5.67 %
TRP.PR.C FixedReset 57,295 Nesbitt crossed 17,700 at 22.75.
YTW SCENARIO
Maturity Type : Limit Maturity
Maturity Date : 2043-11-05
Maturity Price : 22.20
Evaluated at bid price : 22.50
Bid-YTW : 3.79 %
NA.PR.L Deemed-Retractible 57,133 TD crossed blocks of 12,000 and 40,000 at 25.38.
YTW SCENARIO
Maturity Type : Call
Maturity Date : 2013-12-05
Maturity Price : 25.25
Evaluated at bid price : 25.27
Bid-YTW : 2.24 %
CM.PR.M FixedReset 56,870 RBC crossed 50,000 at 25.75.
YTW SCENARIO
Maturity Type : Call
Maturity Date : 2014-07-31
Maturity Price : 25.00
Evaluated at bid price : 25.71
Bid-YTW : 2.76 %
FTS.PR.E OpRet 53,600 RBC crossed 48,100 at 26.00.
YTW SCENARIO
Maturity Type : Call
Maturity Date : 2014-06-01
Maturity Price : 25.50
Evaluated at bid price : 25.96
Bid-YTW : 3.16 %
IFC.PR.C FixedReset 45,022 YTW SCENARIO
Maturity Type : Call
Maturity Date : 2016-09-30
Maturity Price : 25.00
Evaluated at bid price : 25.26
Bid-YTW : 3.99 %
There were 45 other index-included issues trading in excess of 10,000 shares.
Wide Spread Highlights
Issue Index Quote Data and Yield Notes
GWO.PR.J FixedReset Quote: 25.34 – 25.97
Spot Rate : 0.6300
Average : 0.4338

YTW SCENARIO
Maturity Type : Call
Maturity Date : 2013-12-31
Maturity Price : 25.00
Evaluated at bid price : 25.34
Bid-YTW : 1.01 %

BAM.PR.C Floater Quote: 17.65 – 18.14
Spot Rate : 0.4900
Average : 0.3065

YTW SCENARIO
Maturity Type : Limit Maturity
Maturity Date : 2043-11-05
Maturity Price : 17.65
Evaluated at bid price : 17.65
Bid-YTW : 2.99 %

RY.PR.X FixedReset Quote: 25.65 – 26.08
Spot Rate : 0.4300
Average : 0.2558

YTW SCENARIO
Maturity Type : Call
Maturity Date : 2014-08-24
Maturity Price : 25.00
Evaluated at bid price : 25.65
Bid-YTW : 2.59 %

CIU.PR.C FixedReset Quote: 21.16 – 21.93
Spot Rate : 0.7700
Average : 0.6169

YTW SCENARIO
Maturity Type : Limit Maturity
Maturity Date : 2043-11-05
Maturity Price : 21.16
Evaluated at bid price : 21.16
Bid-YTW : 3.85 %

TRP.PR.A FixedReset Quote: 23.56 – 23.99
Spot Rate : 0.4300
Average : 0.3065

YTW SCENARIO
Maturity Type : Limit Maturity
Maturity Date : 2043-11-05
Maturity Price : 23.05
Evaluated at bid price : 23.56
Bid-YTW : 3.98 %

RY.PR.C Deemed-Retractible Quote: 25.40 – 25.70
Spot Rate : 0.3000
Average : 0.1898

YTW SCENARIO
Maturity Type : Call
Maturity Date : 2015-11-24
Maturity Price : 25.00
Evaluated at bid price : 25.40
Bid-YTW : 3.69 %

November 4, 2013

Monday, November 4th, 2013

So what happens to US banks if skyrocketting interest rates cause another housing collapse? The Fed wants to know:

The Federal Reserve said it will examine how the biggest banks might react to a jump in long-term interest rates and another housing crash as it released the next round of stress-test scenarios designed to monitor the ability of the U.S. financial system to withstand economic shocks.

The central bank mentioned that as part of two adverse scenarios it will gauge bank resilience against declines in the prices of high-risk, high-yield loans and debt and some high-priced real estate markets around the country, according to a statement released in Washington today. The central bank also inserted a test for large trading and clearing banks on counterparty default.

There’s an interesting piece on Bloomberg about local government in the rural US:

Monroe is hemorrhaging residents, like rural jurisdictions across the U.S. Yet these communities operate with the same layers of government as when horse-and-buggy travel helped determine the boundaries of the nation’s more than 3,000 counties. As population drops and infrastructure decays, officials and residents concerned about the loss of jobs and identity resist shrinking their government.

“People like that eye-to-eye contact,” said Monroe County Judge Larry Taylor, the top elected official in the county of 7,800. It has lost 44 percent of its population since 1980 as its main budget grew 9 percent, even when adjusted for inflation.

In North Dakota, public costs would have fallen 2.5 percent annually by combining general government, road maintenance, public safety, and health and welfare, according to a 1996 North Dakota State University analysis of a failed proposal to merge 53 counties into 15.

Rob Carrick of the Globe writes an interesting piece on BMO’s generic advisor, titled Investing advice: How adviceDirect stakes out middle ground:

In the investing business, there’s no surer validation of a new initiative than having your competitors copy you. AdviceDirect has struck out on that count. After a full year in operation, no one else has introduced a service where clients invest online while receiving a combination of Web-based and person-to-person advice.

But adviceDirect is on to something in targeting people who gravitate to DIY investing, but need help. “The discipline adviceDirect gives a do-it-yourself investor can be very attractive for people who don’t have the time, the experience or the confidence,” says Viki Lazaris, president and CEO of BMO InvestorLine.

BMO won’t say how many people have signed up for adviceDirect, but you get an idea of how busy things are in the fact that the advice team there comprises just eight people right now. If adviceDirect manages to build its franchise, it will be a result of the work done by these investment specialists (that’s BMO’s title for them).

I’ll suggest that a good business case for adviceDirect can be made solely on the basis of insurance … insuring BMO against the risk that mutual fund trailers will be banned (see various posts and comments commencing on December 17, 2012). In such a case, they’ll be up and running with a working model of access to small investors and that head start could be quite an advantage.

Incidentally, there was a bit of an update on that situation in June:

Indeed, according to the OSC’s transcript of the event, Greg Pollock, president and CEO of Advocis, cautioned that “financial advice would become unaffordable, and therefore
inaccessible, to the average Canadian.”

There also are fears that any move away from embedded commissions could ultimately drive many advisors out of the business. Indeed, defenders of the current system point to the U.K., which introduced new rules outlawing embedded commissions, among other reforms, on Jan. 1. It was suggested at the OSC meeting that the U.K. has lost 25% of its advisory sales force due to its ban on commissions, with several large financial services institutions dropping out of the retail investment advice business altogether.

According to data from London-based Matrix Solutions Inc., since the RDR took effect on Jan. 1, the number of authorized investment intermediary firms is down by about 6% as of May; the total number of registered individuals in this sector is off by 9.5%; and the ranks of so-called “customer-facing staff” is down by 12.3%.

Those figures are much lower than was suggested at the OSC’s January meeting, and it appears that the immediate effects now are being reversed a bit. In fact, the data show that the number of registered reps rose in May month-over-month, and the number of customer-facing reps rose for the second straight month.

Ontario has a message for business – Spend, spend, spend!

In a speech at Toronto’s Empire Club Monday, Finance Minister Charles Sousa took aim at so-called “dead money” – capital that corporations have been holding onto since the global recession. The federal government has already pressed companies to invest that money in the economy, and Mr. Sousa said his government would use the tax system to encourage them to do it.

These would include a tax credit for research and development spending, and an incentive for companies that buy new equipment or technology, or spend money to train employees.

Mr. Sousa said he understands why companies have been hoarding cash, but warned that doing so is holding back Canada’s economy.

Me, I’d say that what is holding back Canada’s economy is government distortion of the free markets, but I’m not the treasurer of Ontario.

Robert Shiller is warning of another housing bubble – but this one’s in Brazil:

The government increased the price limit of houses people can buy using the unemployment insurance fund on Sept. 30 after public lending for homes increased more than four times as much as private banks in the two years through June, to 202 billion reais ($90 billion), according to central bank data.

Rousseff’s homebuilding program has propelled demand as she seeks to stimulate the economy before next year’s presidential election. Robert Shiller, six weeks before winning the Nobel Prize for economics, cautioned that such demand may be fueling a bubble as home prices grow twice as fast as rent. Mortgage debt as a percentage of disposable household income has climbed to a record 15 percent, almost double the level at the start of Rousseff’s term.

It was a strong day for the Canadian preferred share market, with PerpetualDiscounts winning 27bp, FixedResets up 26bp and DeemedRetractibles gaining 16bp. FixedResets with a low Issue Reset Spread dominated the winning side of the Performance Highlights table. Volume was average.

HIMIPref™ Preferred Indices
These values reflect the December 2008 revision of the HIMIPref™ Indices

Values are provisional and are finalized monthly
Index Mean
Current
Yield
(at bid)
Median
YTW
Median
Average
Trading
Value
Median
Mod Dur
(YTW)
Issues Day’s Perf. Index Value
Ratchet 0.00 % 0.00 % 0 0.00 0 0.9935 % 2,490.4
FixedFloater 4.26 % 3.53 % 27,848 18.32 1 -1.7173 % 3,943.6
Floater 2.98 % 3.00 % 64,920 19.70 3 0.9935 % 2,689.0
OpRet 4.63 % 3.36 % 67,876 0.61 3 -0.0900 % 2,633.7
SplitShare 4.75 % 5.15 % 64,445 3.66 6 -0.0269 % 2,956.6
Interest-Bearing 0.00 % 0.00 % 0 0.00 0 -0.0900 % 2,408.3
Perpetual-Premium 5.57 % 3.90 % 124,703 0.30 11 0.3410 % 2,305.8
Perpetual-Discount 5.52 % 5.52 % 181,505 14.56 27 0.2687 % 2,379.0
FixedReset 5.00 % 3.63 % 226,319 3.53 82 0.2576 % 2,460.5
Deemed-Retractible 5.08 % 4.07 % 192,795 1.50 42 0.0958 % 2,411.8
FloatingReset 2.62 % 2.39 % 298,417 4.52 5 0.1588 % 2,457.9
Performance Highlights
Issue Index Change Notes
BAM.PR.G FixedFloater -1.72 % YTW SCENARIO
Maturity Type : Limit Maturity
Maturity Date : 2043-11-04
Maturity Price : 22.63
Evaluated at bid price : 22.32
Bid-YTW : 3.53 %
TRP.PR.C FixedReset -1.37 % YTW SCENARIO
Maturity Type : Limit Maturity
Maturity Date : 2043-11-04
Maturity Price : 22.05
Evaluated at bid price : 22.30
Bid-YTW : 3.83 %
IFC.PR.A FixedReset -1.30 % YTW SCENARIO
Maturity Type : Hard Maturity
Maturity Date : 2025-01-31
Maturity Price : 25.00
Evaluated at bid price : 23.55
Bid-YTW : 4.52 %
TRP.PR.B FixedReset 1.00 % YTW SCENARIO
Maturity Type : Limit Maturity
Maturity Date : 2043-11-04
Maturity Price : 20.20
Evaluated at bid price : 20.20
Bid-YTW : 3.90 %
CU.PR.G Perpetual-Discount 1.04 % YTW SCENARIO
Maturity Type : Limit Maturity
Maturity Date : 2043-11-04
Maturity Price : 21.44
Evaluated at bid price : 21.44
Bid-YTW : 5.34 %
CU.PR.D Perpetual-Discount 1.07 % YTW SCENARIO
Maturity Type : Limit Maturity
Maturity Date : 2043-11-04
Maturity Price : 23.38
Evaluated at bid price : 23.72
Bid-YTW : 5.24 %
BAM.PR.B Floater 1.14 % YTW SCENARIO
Maturity Type : Limit Maturity
Maturity Date : 2043-11-04
Maturity Price : 17.70
Evaluated at bid price : 17.70
Bid-YTW : 2.99 %
BAM.PR.K Floater 1.15 % YTW SCENARIO
Maturity Type : Limit Maturity
Maturity Date : 2043-11-04
Maturity Price : 17.60
Evaluated at bid price : 17.60
Bid-YTW : 3.00 %
VNR.PR.A FixedReset 1.20 % YTW SCENARIO
Maturity Type : Call
Maturity Date : 2017-10-15
Maturity Price : 25.00
Evaluated at bid price : 25.35
Bid-YTW : 4.05 %
FTS.PR.G FixedReset 1.26 % YTW SCENARIO
Maturity Type : Limit Maturity
Maturity Date : 2043-11-04
Maturity Price : 22.83
Evaluated at bid price : 24.10
Bid-YTW : 4.00 %
W.PR.J Perpetual-Discount 1.27 % YTW SCENARIO
Maturity Type : Limit Maturity
Maturity Date : 2043-11-04
Maturity Price : 24.51
Evaluated at bid price : 24.76
Bid-YTW : 5.70 %
ENB.PR.H FixedReset 1.29 % YTW SCENARIO
Maturity Type : Limit Maturity
Maturity Date : 2043-11-04
Maturity Price : 22.58
Evaluated at bid price : 23.55
Bid-YTW : 4.14 %
MFC.PR.F FixedReset 1.44 % YTW SCENARIO
Maturity Type : Hard Maturity
Maturity Date : 2025-01-31
Maturity Price : 25.00
Evaluated at bid price : 22.52
Bid-YTW : 4.67 %
BAM.PF.B FixedReset 1.49 % YTW SCENARIO
Maturity Type : Limit Maturity
Maturity Date : 2043-11-04
Maturity Price : 22.71
Evaluated at bid price : 23.90
Bid-YTW : 4.51 %
ENB.PR.T FixedReset 1.53 % YTW SCENARIO
Maturity Type : Limit Maturity
Maturity Date : 2043-11-04
Maturity Price : 22.71
Evaluated at bid price : 23.91
Bid-YTW : 4.36 %
SLF.PR.G FixedReset 1.78 % YTW SCENARIO
Maturity Type : Hard Maturity
Maturity Date : 2025-01-31
Maturity Price : 25.00
Evaluated at bid price : 22.88
Bid-YTW : 4.39 %
Volume Highlights
Issue Index Shares
Traded
Notes
RY.PR.I FixedReset 128,500 TD crossed 125,000 at 25.09.
YTW SCENARIO
Maturity Type : Call
Maturity Date : 2014-02-24
Maturity Price : 25.00
Evaluated at bid price : 25.07
Bid-YTW : 3.20 %
BNS.PR.R FixedReset 101,510 TD crossed 100,000 at 25.11.
YTW SCENARIO
Maturity Type : Hard Maturity
Maturity Date : 2022-01-31
Maturity Price : 25.00
Evaluated at bid price : 25.09
Bid-YTW : 3.65 %
TRP.PR.B FixedReset 69,605 Scotia crossed 40,000 at 20.15; RBC crossed 10,000 at 20.20.
YTW SCENARIO
Maturity Type : Limit Maturity
Maturity Date : 2043-11-04
Maturity Price : 20.20
Evaluated at bid price : 20.20
Bid-YTW : 3.90 %
CGI.PR.D SplitShare 52,200 Desjardins crossed 51,400 at 23.90.
YTW SCENARIO
Maturity Type : Soft Maturity
Maturity Date : 2023-06-14
Maturity Price : 25.00
Evaluated at bid price : 23.90
Bid-YTW : 4.40 %
W.PR.H Perpetual-Discount 50,676 TD crossed 50,000 at 24.45.
YTW SCENARIO
Maturity Type : Limit Maturity
Maturity Date : 2043-11-04
Maturity Price : 24.15
Evaluated at bid price : 24.40
Bid-YTW : 5.68 %
HSE.PR.A FixedReset 47,318 RBC crossed 34,500 at 22.75.
YTW SCENARIO
Maturity Type : Limit Maturity
Maturity Date : 2043-11-04
Maturity Price : 22.37
Evaluated at bid price : 22.77
Bid-YTW : 3.99 %
There were 30 other index-included issues trading in excess of 10,000 shares.
Wide Spread Highlights
Issue Index Quote Data and Yield Notes
BAM.PR.G FixedFloater Quote: 22.32 – 22.91
Spot Rate : 0.5900
Average : 0.4174

YTW SCENARIO
Maturity Type : Limit Maturity
Maturity Date : 2043-11-04
Maturity Price : 22.63
Evaluated at bid price : 22.32
Bid-YTW : 3.53 %

GWO.PR.J FixedReset Quote: 25.23 – 25.59
Spot Rate : 0.3600
Average : 0.2188

YTW SCENARIO
Maturity Type : Call
Maturity Date : 2013-12-31
Maturity Price : 25.00
Evaluated at bid price : 25.23
Bid-YTW : 3.81 %

TRP.PR.C FixedReset Quote: 22.30 – 22.78
Spot Rate : 0.4800
Average : 0.3464

YTW SCENARIO
Maturity Type : Limit Maturity
Maturity Date : 2043-11-04
Maturity Price : 22.05
Evaluated at bid price : 22.30
Bid-YTW : 3.83 %

TD.PR.R Deemed-Retractible Quote: 26.17 – 26.49
Spot Rate : 0.3200
Average : 0.1972

YTW SCENARIO
Maturity Type : Call
Maturity Date : 2013-12-04
Maturity Price : 26.00
Evaluated at bid price : 26.17
Bid-YTW : -1.84 %

ELF.PR.F Perpetual-Discount Quote: 23.56 – 23.90
Spot Rate : 0.3400
Average : 0.2350

YTW SCENARIO
Maturity Type : Limit Maturity
Maturity Date : 2043-11-04
Maturity Price : 23.26
Evaluated at bid price : 23.56
Bid-YTW : 5.67 %

BNS.PR.N Deemed-Retractible Quote: 25.91 – 26.24
Spot Rate : 0.3300
Average : 0.2260

YTW SCENARIO
Maturity Type : Call
Maturity Date : 2014-01-29
Maturity Price : 25.75
Evaluated at bid price : 25.91
Bid-YTW : 2.69 %

W Downgraded to P-3(high) By S&P

Monday, November 4th, 2013

Standard & Poor’s has announced:

  • We are lowering our ratings on Westcoast Energy Inc., including our long-term corporate credit rating to ‘BBB’ from ‘BBB+’.
  • We are also removing the ratings from CreditWatch, where they were placed with negative implications June 17, 2013.
  • The ratings on Westcoast reflect those on parent Spectra Energy Corp.
  • We downgraded Spectra to ‘BBB’ from ‘BBB+’ today, reflecting the drop-down of assets to subsidiary Spectra Energy Partners L.P.


The ratings on Westcoast primarily reflect Standard & Poor’s view of parent company Spectra, as well as Westcoast’s “strong” business risk profile and “significant” financial risk profile. Furthermore, the credit profiles of both companies are very similar, in our view. Westcoast has what we believe is a diverse group of gas infrastructure assets that have a broad customer base, generate mostly fee-based revenue that reinforces stability, and benefit from regulatory protection to various degrees — all of which also support the strong business risk profile.

We have equalized our ratings on Westcoast with those on parent Spectra. We link the parent and operating company’s credit profiles based on our methodology for holding company structures. Accordingly, any rating action on Spectra would likely flow through to our ratings on Westcoast.

The stable outlook on Westcoast reflects that on Spectra.

The previous CreditWatch-Negative was reported on PrefBlog.

Westcoast is the proud issuer of two series of preferred shares, W.PR.H and W.PR.J, both Straight Perpetuals. Both are tracked by HIMIPref™ and both are currently assigned to the PerpetualDiscount subindex; both will be relegated to “Scraps” at the next index rebalancing at the end of November.

Interestingly, S&P affirmed UNG:

  • We are affirming our ratings, including our ‘BBB+’ long-term corporate credit rating, on Union Gas Ltd.
  • We are also removing the ratings from CreditWatch, where they were placed June 17, 2013.
  • The rating action follows our downgrade to Spectra Energy Corp. to ‘BBB’ from ‘BBB+’ after the drop-down of assets to subsidiary Spectra Energy Partners L.P.
  • Based on our ‘a-‘ stand-alone credit profile at Union Gas, the ‘BBB’ rating on Spectra Energy Corp., and our assessment of the regulatory insulation from the parent, we believe that a one-notch differential between the ratings on the parent and that on Union Gas is warranted.

Union Gas is the proud issuer of two preferred shares: UNG.PR.C and UNG.PR.D, which have been discussed in passing on PrefBlog, but neither is tracked by HIMIPref™. The commencement of CreditWatch-Negative status for UNG was reported on PrefBlog.

MAPF Performance, October 2013

Sunday, November 3rd, 2013

The fund outperformed in October, due to its low weighting in junk FixedResets, which underperformed (as indicated by the performance difference between TXPR (-0.07%) and TXPL (-0.78%)). The fund’s returns were also helped along by superior performance from its holdings of insurance-issued DeemedRetractibles.


Click for Big


Click for Big

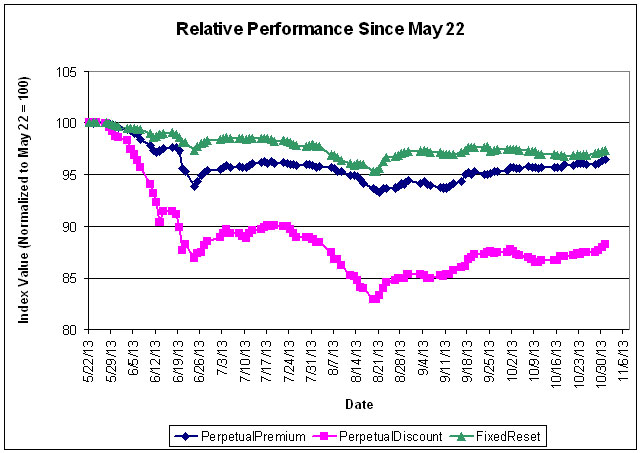
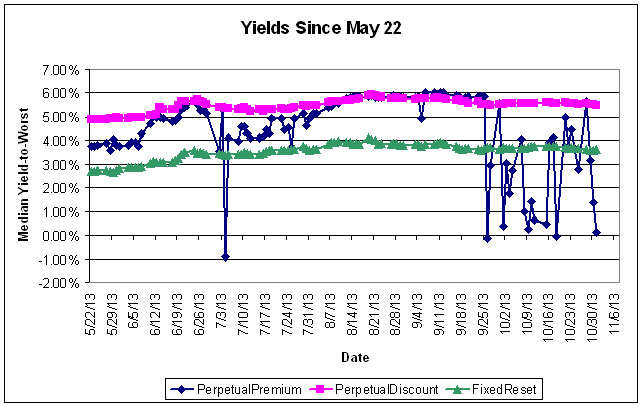
To a certain extent, the (modest, so far) recovery may reflect an acceptance of my belief that the decline in the preferred share market has been overdone; the following table shows the increase in yields since May 22 of some fixed income sectors:

Yield Changes
May 22, 2013
to
October 31, 2013
Sector Yield
May 22
Yield
October 31
Change
Five-Year Canadas 1.38% 1.71% +33bp
Long Canadas 2.57% 3.01% +44bp
Long Corporates 4.15% 4.7% +55bp
FixedResets
Investment Grade
(Interest Equivalent)
3.51% 4.74% +123bp
Perpetual-Discounts
Investment Grade
(Interest Equivalent)
6.34% 7.14% +80bp
The change in yield of PerpetualDiscounts is understated due a massive influx of issues from the PerpetualPremium sub-index over the period, which improved credit quality. When the four issues that comprised the PerpetualDiscount sub-index as of May 22 are evaluated as of October 31, the interest-equivalent yield is 7.64% and thus the change is +130bp.

ZPR, is a relatively new ETF comprised of FixedResets and Floating Rate issues, with a very high proportion of junk issues, which returned -0.75% for the month, and -1.74% over the past three months (according to my calculations from the fund’s NAV data and distribution data; our regulators are hard at work protecting you from performance data since the fund has been extant for less than a year), versus returns for the TXPL index of -0.78% and -1.67%, respectively. The fund has been able to attract assets of about $837.8-million in the eleven and a half months since inception; a gain of $11.9-million in October despite losing approximately $6.2-million due to performance. This indicates that an inflow of funds occurred in October – perhaps implying a (very modest!) return of confidence among retail investors. I feel that the flows into and out of this fund are very important in determining the performance of its constituents.

TXPR had returns over one- and three-months of +0.48% and -1.57%, respectively

Returns for the HIMIPref™ investment grade sub-indices for October were as follows:

HIMIPref™ Indices
Performance to October 31, 2013
Sub-Index 1-Month 3-month
Ratchet N/A N/A
FixFloat +4.30% -0.97%
Floater -2.70% -6.31%
OpRet +0.26% +0.31%
SplitShare +0.51% -0.03%
Interest N/A N/A
PerpetualPremium +1.16% 0.65%
PerpetualDiscount +0.95% -0.50%
FixedReset -0.10% -0.55%
DeemedRetractible +1.40% +1.88%
FloatingReset N/A N/A

Malachite Aggressive Preferred Fund’s Net Asset Value per Unit as of the close October 31, 2013, was 10.1070.

Returns to October 31, 2013
Period MAPF BMO-CM “50” Index TXPR
Total Return
CPD – according to Blackrock
One Month +0.77% +0.19% -0.07% -0.12%
Three Months +0.77% -0.15% -0.67% -0.75%
One Year -1.22% +0.32% -1.28% -1.66%
Two Years (annualized) +4.80% +3.23% +2.28% N/A
Three Years (annualized) +3.98% +4.29% +2.99% +2.49%
Four Years (annualized) +8.05% +6.70% +5.19% N/A
Five Years (annualized) +17.98% +8.82% +7.28% +6.60%
Six Years (annualized) +13.66% +5.00% +3.64%  
Seven Years (annualized) +11.11% +3.52%    
Eight Years (annualized) +10.50% +3.71%    
Nine Years (annualized) +10.04% +3.75%    
Ten Years (annualized) +10.57% +3.93%    
Eleven Years (annualized) +11.92% +4.24%    
Twelve Years (annualized) +10.77% +4.18%    
MAPF returns assume reinvestment of distributions, and are shown after expenses but before fees.
CPD Returns are for the NAV and are after all fees and expenses.
* CPD does not directly report its two- or four-year returns.
Figures for Omega Preferred Equity (which are after all fees and expenses) for 1-, 3- and 12-months are +0.29%, -0.04% and -0.06%, respectively, according to Morningstar after all fees & expenses. Three year performance is +3.49%; five year is +7.60%
Figures for Jov Leon Frazer Preferred Equity Fund Class I Units (which are after all fees and expenses) for 1-, 3- and 12-months are -0.21%, -1.60% and -2.24% respectively, according to Morningstar. Three Year performance is +0.82%
Figures for Manulife Preferred Income Fund (formerly AIC Preferred Income Fund) (which are after all fees and expenses) for 1-, 3- and 12-months are -0.70%, -2.59% & -4.74%, respectively. Three Year performance is +1.20%
Figures for Horizons AlphaPro Preferred Share ETF (which are after all fees and expenses) for 1-, 3- and 12-months are +0.77%, -0.53% & +0.43%, respectively.
Figures for Altamira Preferred Equity Fund are -0.21%, -1.09% and -2.47% for one-, three- and twelve months, respectively.
The figure for BMO S&P/TSX Laddered Preferred Share Index ETF is -0.75% and -1.74% for one- and three-months. [calculation by JH; I am happy that next month the fund will have been around for over a year and the regulators will stop protecting me from the evils of fund performance calculations]

MAPF returns assume reinvestment of dividends, and are shown after expenses but before fees. Past performance is not a guarantee of future performance. You can lose money investing in Malachite Aggressive Preferred Fund or any other fund. For more information, see the fund’s main page. The fund is available either directly from Hymas Investment Management or through a brokerage account at Odlum Brown Limited.

A problem that has bedevilled the market over the past two years has been the OSFI decision not to grandfather Straight Perpetuals as Tier 1 bank capital, and their continued foot-dragging regarding a decision on insurer Straight Perpetuals has segmented the market to the point where trading has become much more difficult. The fund occasionally finds an attractive opportunity to trade between GWO issues, which have a good range of annual coupons (but in which trading is now hampered by the fact that the low-coupon issues are trading near par and are callable at par in the near term), but is “stuck” in the MFC and SLF issues, which have a much narrower range of coupon, while the IAG DeemedRetractibles are quite illiquid. Until the market became so grossly segmented, this was not so much of a problem – but now banks are not available to swap into (because they are so expensive) and non-regulated companies are likewise deprecated (because they are not DeemedRetractibles; they should not participate in the increase in value that will follow the OSFI decision I anticipate and, in addition, are analyzed as perpetuals). The fund’s portfolio is, in effect ‘locked in’ to the MFC & SLF issues due to projected gains from a future OSFI decision, to the detriment of trading gains particularly in May, 2013, when the three lowest-coupon SLF DeemedRetractibles (SLF.PR.C, SLF.PR.D and SLF.PR.E) were the worst performing DeemedRetractibles in the sub-index, and in June, 2013, when the insurance-issued DeemedRetractibles behaved like PerpetualDiscounts in a sharply negative market.

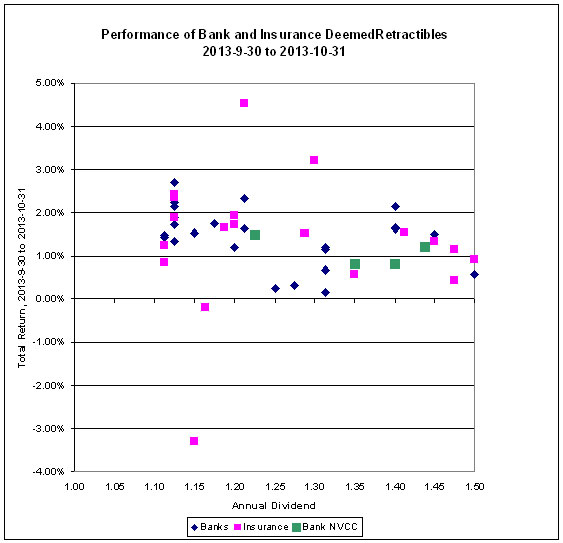
DeemedRetractibles had relatively uncorrelated performances in October:


Click for Big

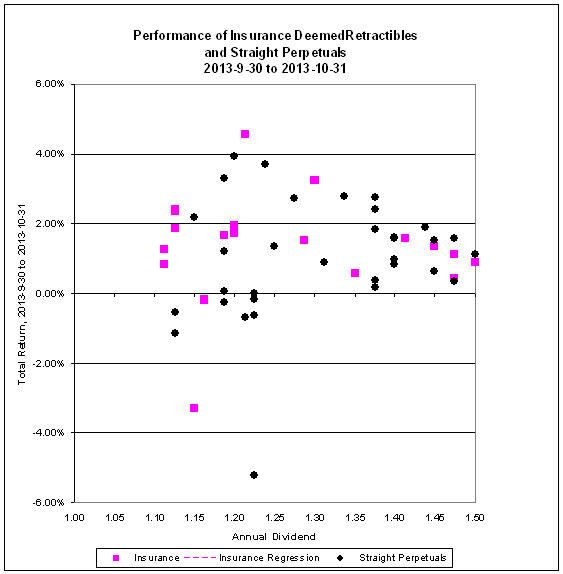
And Straight Perpetuals were indistinguishable from DeemedRetractibles:


Click for Big

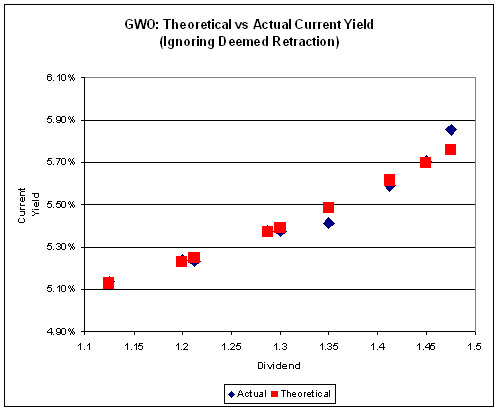
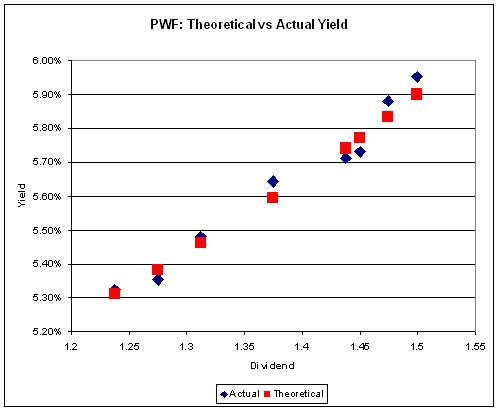
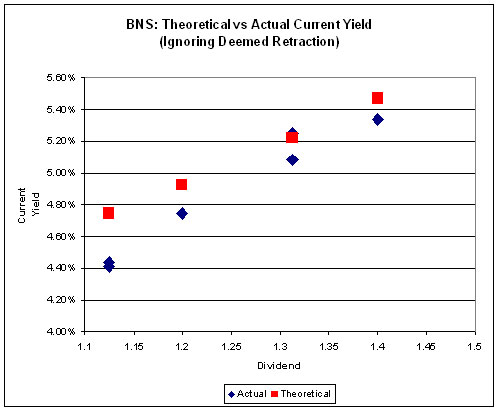
A side effect of the downdraft has been the return of measurable Implied Volatility (all Implied Volatility calculations use bids from November 1):


Click for Big


Click for Big


Click for Big

Implied Volatility of
Three Series of Straight Perpetuals
September, 2013
Issuer Pure Yield Implied Volatility
GWO 4.50% (+0.38) 21% (-6)
PWF 3.60% (-1.18) 30% (+10)
BNS 0.01% (0) 40% (0)
Bracketted figures are changes since September month-end

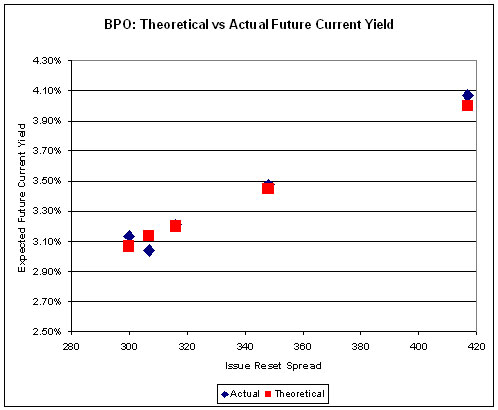
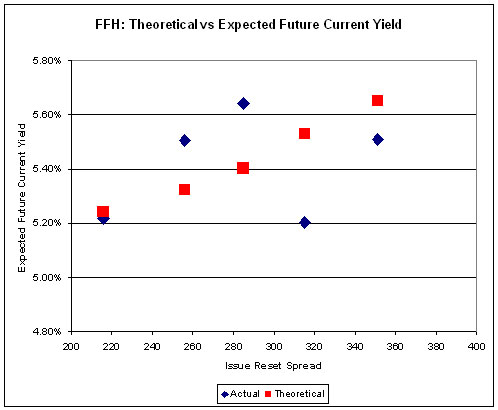
In the September, 2013, edition of PrefLetter, I extended the theory of Implied Volatility to FixedResets – relating the option feature of the Issue Reset Spreads to a theoretical non-callable Market Spread.


Click for Big


Click for Big

Implied Volatility of
Two Series of FixedResets
September, 2013
Issuer Market Reset Spread
(Non-Callable)
Implied Volatility
BPO 84bp (-104) 40% (-22)
FFH 330bp (+35) 16%
Bracketted figures are changes since September month-end

These are very interesting results: the BPO issues were, on average, flat over the month although the average concealed a lot of variance: BPO.PR.P (Issue Reset Spread = 300bp) was down 2.44% while BPO.PR.N (IRS = 307bp) gained 1.04% and BPO.PR.T (IRS = 316) was up 1.43%. The higher-IRS issues BPO.PR.L (IRS = 417; Return +0.04%) and BPO.PR.R (IRS = 348bp, Return +0.36%) merely held their own. In all, though, it appears that the BPO issues are trading as if redemption is more likely that one would think from fundamentals.

As for FFH, the two higher-IRS issues (FFH.PR.C, IRS=315bp, and FFH.PRK, IRS=351bp) are extremely expensive relative to their peers, to the point where the Implied Volatility calculation doesn’t mean much.

Those of you who have been paying attention will remember that in a “normal” market (which we have not seen in well over a year) the slope of this line is related to the implied volatility of yields in Black-Scholes theory, as discussed in the January, 2010, edition of PrefLetter. As has been previously noted, very high levels of Implied Volatility (in the 40% range) imply a very strong expectation of directionality in future prices – i.e, an expectation that all issues will be redeemed at par.

It is significant that the preferred share market knows no moderation. I suggest that a good baseline estimate for Volatility over a three year period is 15% but the observed figure is generally higher in a rising market and lower in a declining one … with, of course, a period of adjustment in between, which I suspect we are currently experiencing.

Sometimes everything works … sometimes it’s 50-50 … sometimes nothing works. The fund seeks to earn incremental return by selling liquidity (that is, taking the other side of trades that other market participants are strongly motivated to execute), which can also be referred to as ‘trading noise’ – although for quite some time, noise trading has taken a distant second place to the sectoral play on insurance DeemedRetractibles. There were a lot of strongly motivated market participants during the Panic of 2007, generating a lot of noise! Unfortunately, the conditions of the Panic may never be repeated in my lifetime … but the fund will simply attempt to make trades when swaps seem profitable, without worrying about the level of monthly turnover.

There’s plenty of room for new money left in the fund. I have shown in PrefLetter that market pricing for FixedResets is very often irrational and I have lots of confidence – backed up by my bond portfolio management experience in the markets for Canadas and Treasuries, and equity trading on the NYSE & TSX – that there is enough demand for liquidity in any market to make the effort of providing it worthwhile (although the definition of “worthwhile” in terms of basis points of outperformance changes considerably from market to market!) I will continue to exert utmost efforts to outperform but it should be borne in mind that there will almost inevitably be periods of underperformance in the future.

The yields available on high quality preferred shares remain elevated, which is reflected in the current estimate of sustainable income.

Calculation of MAPF Sustainable Income Per Unit
Month NAVPU Portfolio
Average
YTW
Leverage
Divisor
Securities
Average
YTW
Capital
Gains
Multiplier
Sustainable
Income
per
current
Unit
June, 2007 9.3114 5.16% 1.03 5.01% 1.3240 0.3524
September 9.1489 5.35% 0.98 5.46% 1.3240 0.3773
December, 2007 9.0070 5.53% 0.942 5.87% 1.3240 0.3993
March, 2008 8.8512 6.17% 1.047 5.89% 1.3240 0.3938
June 8.3419 6.034% 0.952 6.338% 1.3240 $0.3993
September 8.1886 7.108% 0.969 7.335% 1.3240 $0.4537
December, 2008 8.0464 9.24% 1.008 9.166% 1.3240 $0.5571
March 2009 $8.8317 8.60% 0.995 8.802% 1.3240 $0.5872
June 10.9846 7.05% 0.999 7.057% 1.3240 $0.5855
September 12.3462 6.03% 0.998 6.042% 1.3240 $0.5634
December 2009 10.5662 5.74% 0.981 5.851% 1.1141 $0.5549
March 2010 10.2497 6.03% 0.992 6.079% 1.1141 $0.5593
June 10.5770 5.96% 0.996 5.984% 1.1141 $0.5681
September 11.3901 5.43% 0.980 5.540% 1.1141 $0.5664
December 2010 10.7659 5.37% 0.993 5.408% 1.0298 $0.5654
March, 2011 11.0560 6.00% 0.994 5.964% 1.0298 $0.6403
June 11.1194 5.87% 1.018 5.976% 1.0298 $0.6453
September 10.2709 6.10%
Note
1.001 6.106% 1.0298 $0.6090
December, 2011 10.0793 5.63%
Note
1.031 5.805% 1.0000 $0.5851
March, 2012 10.3944 5.13%
Note
0.996 5.109% 1.0000 $0.5310
June 10.2151 5.32%
Note
1.012 5.384% 1.0000 $0.5500
September 10.6703 4.61%
Note
0.997 4.624% 1.0000 $0.4934
December, 2012 10.8307 4.24% 0.989 4.287% 1.0000 $0.4643
March, 2013 10.9033 3.87% 0.996 3.886% 1.0000 $0.4237
June 10.3261 4.81% 0.998 4.80% 1.0000 $0.4957
September 10.0296 5.62% 0.996 5.643% 1.0000 $0.5660
October, 2013 10.1070 5.62% 0.997 5.637% 1.0000 $0.5697
NAVPU is shown after quarterly distributions of dividend income and annual distribution of capital gains.
Portfolio YTW includes cash (or margin borrowing), with an assumed interest rate of 0.00%
The Leverage Divisor indicates the level of cash in the account: if the portfolio is 1% in cash, the Leverage Divisor will be 0.99
Securities YTW divides “Portfolio YTW” by the “Leverage Divisor” to show the average YTW on the securities held; this assumes that the cash is invested in (or raised from) all securities held, in proportion to their holdings.
The Capital Gains Multiplier adjusts for the effects of Capital Gains Dividends. On 2009-12-31, there was a capital gains distribution of $1.989262 which is assumed for this purpose to have been reinvested at the final price of $10.5662. Thus, a holder of one unit pre-distribution would have held 1.1883 units post-distribution; the CG Multiplier reflects this to make the time-series comparable. Note that Dividend Distributions are not assumed to be reinvested.
Sustainable Income is the resultant estimate of the fund’s dividend income per current unit, before fees and expenses. Note that a “current unit” includes reinvestment of prior capital gains; a unitholder would have had the calculated sustainable income with only, say, 0.9 units in the past which, with reinvestment of capital gains, would become 1.0 current units.
DeemedRetractibles are comprised of all Straight Perpetuals (both PerpetualDiscount and PerpetualPremium) issued by BMO, BNS, CM, ELF, GWO, HSB, IAG, MFC, NA, RY, SLF and TD, which are not exchangable into common at the option of the company (definition refined in May, 2011). These issues are analyzed as if their prospectuses included a requirement to redeem at par on or prior to 2022-1-31 (banks) or 2025-1-31 (insurers and insurance holding companies), in addition to the call schedule explicitly defined. See OSFI Does Not Grandfather Extant Tier 1 Capital, CM.PR.D, CM.PR.E, CM.PR.G: Seeking NVCC Status and the January, February, March and June, 2011, editions of PrefLetter for the rationale behind this analysis.
Yields for September, 2011, to January, 2012, were calculated by imposing a cap of 10% on the yields of YLO issues held, in order to avoid their extremely high calculated yields distorting the calculation and to reflect the uncertainty in the marketplace that these yields will be realized. From February to September 2012, yields on these issues have been set to zero. All YLO issues held were sold in October 2012.

Significant positions were held in DeemedRetractible, SplitShare and FixedReset issues on July 31; all of these currently have their yields calculated with the presumption that they will be called by the issuers at par prior to 2022-1-31 (banks) or 2025-1-31 (insurers and insurance holding companies). This presents another complication in the calculation of sustainable yield. The fund also holds positions in various SplitShare issues which also have their yields calculated with the expectation of a maturity at par.

I no longer show calculations that assume the conversion of the entire portfolio into PerpetualDiscounts, as the fund has only a very small position in these issues.

I will also note that the sustainable yield calculated above is not directly comparable with any yield calculation currently reported by any other preferred share fund as far as I am aware. The Sustainable Yield depends on:
i) Calculating Yield-to-Worst for each instrument and using this yield for reporting purposes;
ii) Using the contemporary value of Five-Year Canadas (set at 1.72% for the October 31 calculation) to estimate dividends after reset for FixedResets.

Most funds report Current Yield. For instance, ZPR reports a “Portfolio Yield” of 5.03% as of October 25, 2013 and notes:

Portfolio yield is calculated as the most recent income received by the ETF in the form of dividends interest and other income annualized based on the payment frequently divided by the current market value of ETFs investments.

In other words – it’s the Current Yield, a meaningless number. The Current Yield of MAPF is 5.08% as of September 30, but I will neither report that with any degree of prominence nor take any great pleasure in the fact that it’s a little higher than the ZPR number. It’s meaningless; to accord it any prominence in portfolio reporting is misleading.

It should be noted that the concept of this Sustainable Income calculation was developed when the fund’s holdings were overwhelmingly PerpetualDiscounts – see, for instance, the bottom of the market in November 2008. It is easy to understand that for a PerpetualDiscount, the technique of multiplying yield by price will indeed result in the coupon – a PerpetualDiscount paying $1 annually will show a Sustainable Income of $1, regardless of whether the price is $24 or $17.

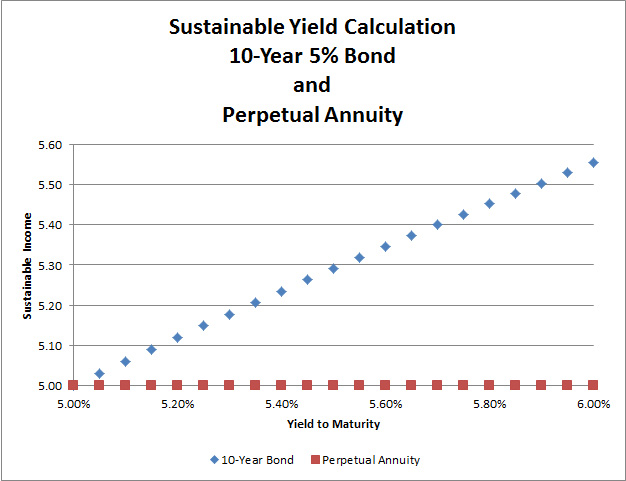
Things are not quite so neat when maturity dates and maturity prices that are different from the current price are thrown into the mix. If we take a notional Straight Perpetual paying $5 annually, the price is $100 when the yield is 5% (all this ignores option effects). As the yield increases to 6%, the price declines to 83.33; and 83.33 x 6% is the same $5. Good enough.

But a ten year bond, priced at 100 when the yield is equal to its coupon of 5%, will decline in price to 92.56; and 92.56 x 6% is 5.55; thus, the calculated Sustainable Income has increased as the price has declined as shown in the graph:


Click for Big

The difference is because the bond’s yield calculation includes the amortization of the discount; therefore, so does the Sustainable Income estimate.

Different assumptions lead to different results from the calculation, but the overall positive trend is apparent. I’m very pleased with the long-term results! It will be noted that if there was no trading in the portfolio, one would expect the sustainable yield to be constant (before fees and expenses). The success of the fund’s trading is showing up in

  • the very good performance against the index
  • the long term increases in sustainable income per unit

As has been noted, the fund has maintained a credit quality equal to or better than the index; outperformance is due to exploitation of trading anomalies.

Again, there are no predictions for the future! The fund will continue to trade between issues in an attempt to exploit market gaps in liquidity, in an effort to outperform the index and keep the sustainable income per unit – however calculated! – growing.

MAPF Portfolio Composition: October 2013

Saturday, November 2nd, 2013

Turnover remained reasonable in October, at about 10%.

There is extreme segmentation in the marketplace, with OSFI’s NVCC rule changes in February 2011 having had the effect of splitting the formerly relatively homogeneous Straight Perpetual class of preferreds into three parts:

  • Unaffected Straight Perpetuals
  • DeemedRetractibles explicitly subject to the rules (banks)
  • DeemedRetractibles considered by me, but not (yet!) by the market, to be likely to be explicitly subject to the rules in the future (insurers and insurance holding companies)

This segmentation, and the extreme valuation differences between the segments, has cut down markedly on the opportunities for trading. Another trend that hasn’t helped was the migration of PerpetualDiscounts into PerpetualPremiums (due to price increases) earlier in the year – many of the PerpetualPremiums had negative Yields-to-Worst and those that don’t aren’t particularly thrilling; speaking very generally, PerpetualPremiums are to be avoided, not traded! This effect has caused the first of the three segments noted above to be untradeable for most practical purposes. The summer’s downdraft reversed the trend and resulted in a large pool of PerpetualDiscounts, but due to their long term they are still, as a class, inferior to DeemedRetractibles. In October there was a small migration back into PerpetualPremiums.

To make this more clear, it used to be that there were 70-odd Straight Perpetuals and I was more or less indifferent as to which ones I owned (subject, of course, to issuer concentration concerns and other risk management factors). Thus, if any one of these 70 were to go down in price by – say – $0.25, I would quite often have something in inventory that I’d be willing to swap for it. The segmentation means that I am no longer indifferent; in addition to checking the valuation of a potential buy to its peers, I also have to check its peer group. This cuts down on the potential for trading.

There is no real hope that this situation will be corrected in the near-term. OSFI has indicated that the long-promised “Draft Definition of Capital” for insurers will not be issued “for public consultation in late 2012 or early 2013”, as they fear that it might encourage speculation in the marketplace. It is not clear why OSFI is so afraid of informed speculation, since the constant speculation in the marketplace is currently less informed than it would be with a little bit of regulatory clarity.

As a result of this delay, I have extended the Deemed Maturity date for insurers and insurance holding companies by three years (to 2025-1-31), in the expectation that when OSFI finally does provide clarity, they will allow the same degree of lead-in time for these companies as they did for banks. This has obviously had a major effect on the durations of preferred shares subject to the change but, fortunately, not much on their calculated yields as most of these issues are either trading near par or were trading at sufficient premium that a par call was expected on economic grounds. However, with the declines in the market over the past two months, the expected capital gain on redemption of the insurance-issued DeemedRetractibles has become an important component of the calculated yield.

Sectoral distribution of the MAPF portfolio on October 31 was as follows:

MAPF Sectoral Analysis 2013-10-31
HIMI Indices Sector Weighting YTW ModDur
Ratchet 0% N/A N/A
FixFloat 0% N/A N/A
Floater 0% N/A N/A
OpRet 0% N/A N/A
SplitShare 18.4% (0) 4.87% 6.13
Interest Rearing 0% N/A N/A
PerpetualPremium 0.0% (0) N/A N/A
PerpetualDiscount 10.1% (+0.5) 5.38% 14.81
Fixed-Reset 7.5% (-0.6) 3.99% 7.19
Deemed-Retractible 54.3% (+0.2) 6.04% 8.48
Scraps (Various) 9.4% (+0.1) 6.40% 12.76
Cash +0.3% (-0.1) 0.00% 0.00
Total 100% 5.62% 8.97
Totals and changes will not add precisely due to rounding. Bracketted figures represent change from September month-end. Cash is included in totals with duration and yield both equal to zero.
DeemedRetractibles are comprised of all Straight Perpetuals (both PerpetualDiscount and PerpetualPremium) issued by BMO, BNS, CM, ELF, GWO, HSB, IAG, MFC, NA, RY, SLF and TD, which are not exchangable into common at the option of the company. These issues are analyzed as if their prospectuses included a requirement to redeem at par on or prior to 2022-1-31 (banks) or 2025-1-3 (insurers and insurance holding companies), in addition to the call schedule explicitly defined. See OSFI Does Not Grandfather Extant Tier 1 Capital, CM.PR.D, CM.PR.E, CM.PR.G: NVCC Status Confirmed and the January, February, March and June, 2011, editions of PrefLetter for the rationale behind this analysis. (all recent editions have a short summary of the argument included in the “DeemedRetractible” section)

Note that the estimate for the time this will become effective for insurers and insurance holding companies was extended by three years in April 2013, due to the delays in OSFI’s providing clarity on the issue.

The “total” reflects the un-leveraged total portfolio (i.e., cash is included in the portfolio calculations and is deemed to have a duration and yield of 0.00.). MAPF will often have relatively large cash balances, both credit and debit, to facilitate trading. Figures presented in the table have been rounded to the indicated precision.

Credit distribution is:

MAPF Credit Analysis 2013-10-31
DBRS Rating Weighting
Pfd-1 0 (0)
Pfd-1(low) 37.5% (+1.5)
Pfd-2(high) 43.0% (+0.8)
Pfd-2 0% (-2.2)
Pfd-2(low) 9.9% (0)
Pfd-3(high) 1.0% (0)
Pfd-3 4.6% (-0.1)
Pfd-3(low) 1.6% (0)
Pfd-4(high) 0% (0)
Pfd-4 0% (0)
Pfd-4(low) 0.8% (0)
Pfd-5(high) 1.3% (+0.1)
Cash 0..3% (-0.1)
Totals will not add precisely due to rounding. Bracketted figures represent change from August month-end.
A position held in NPI.PR.A is not rated by DBRS, but has been included as “Pfd-3” in the above table on the basis of its S&P rating of P-3.

Changes in credit quality were driven largely by the swap of the position held in HSB.PR.E (FixedReset, Pfd-2) to purchase BNS.PR.Y, BNS.PR.Z (FixedReset, Pfd-1(low)) and CU.PR.G (PerpetualDiscount, Pfd-2(high)).

Liquidity Distribution is:

MAPF Liquidity Analysis 2013-10-31
Average Daily Trading Weighting
<$50,000 0.0% (-0.6)
$50,000 – $100,000 17.3% (+0.6)
$100,000 – $200,000 18.4% (-10.0)
$200,000 – $300,000 40.5% (-2.2)
>$300,000 23.4% (+12.3)
Cash 0.3% (-0.1)
Totals will not add precisely due to rounding. Bracketted figures represent change from September month-end.

MAPF is, of course, Malachite Aggressive Preferred Fund, a “unit trust” managed by Hymas Investment Management Inc. Further information and links to performance, audited financials and subscription information are available the fund’s web page. The fund may be purchased either directly from Hymas Investment Management or through a brokerage account at Odlum Brown Limited. A “unit trust” is like a regular mutual fund, but is sold by offering memorandum rather than prospectus. This is cheaper, but means subscription is restricted to “accredited investors” (as defined by the Ontario Securities Commission) or those who subscribe for $150,000+. Fund past performances are not a guarantee of future performance. You can lose money investing in MAPF or any other fund.

A similar portfolio composition analysis has been performed on the Claymore Preferred Share ETF (symbol CPD) (and other funds) as of August 31, 2012, and published in the October (mainly methodology), November (most funds), and December (ZPR) 2012, PrefLetter. While direct comparisons are difficult due to the introduction of the DeemedRetractible class of preferred share (see above) it is fair to say:

  • MAPF credit quality is better
  • MAPF liquidity is a lower
  • MAPF Yield is higher
  • Weightings in
    • MAPF is much more exposed to DeemedRetractibles
    • MAPF is much less exposed to Operating Retractibles
    • MAPF is much more exposed to SplitShares
    • MAPF is less exposed to FixFloat / Floater / Ratchet
    • MAPF weighting in FixedResets is much lower

November 1, 2013

Friday, November 1st, 2013

There was a little pop in bond yields today:

Treasury 10-year note yields (USGG10YR) rose to the highest levels in two weeks after a gauge of U.S. manufacturing expanded at a faster pace than forecast, weakening the case for the Federal Reserve to maintain stimulus.

The benchmark securities extended the first five-day drop in three weeks as Fed Bank of St. Louis President James Bullard said labor market gains in the past year could warrant a cut in the bond buying. Fed policy makers said Oct. 30 that the economy showed signs of “underlying strength” even as they maintained their $85 billion of monthly asset purchases.

Want a raise? Go west, young man!

Data released yesterday by Statistics Canada showed the difference in average hourly wages in Alberta and the rest of the country, but for Saskatchewan, widened again in August.

“Note that hourly wages are now nearly $6 less in Atlantic Canada than in Alberta, the widest gap on record, a factor that has contributed to pushing more than 11,000 migrants out of the region in the past year – a major headache for housing markets, government finances, etc.,” said senior economist Robert Kavcic of BMO Nesbitt Burns.

“Even B.C. is seeing the wage gap approach $4/hour versus Alberta, and not coincidentally is also seeing a decade-high net outflow of workers.”

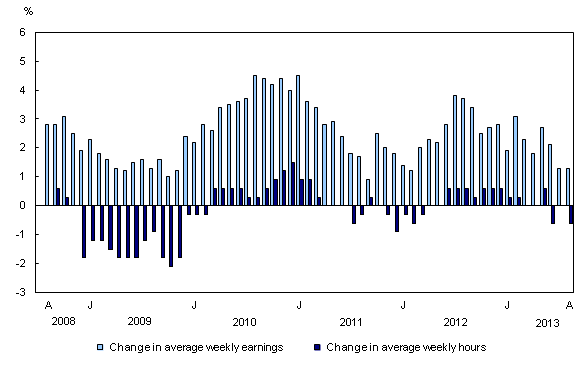
The StatsCan report indicates that a decent economy is still comfortably far away:


Click for Big

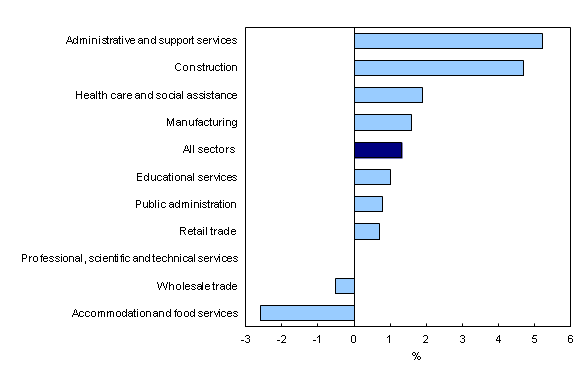
… with an implication that those who decided to earn a living filing paperwork for construction companies are getting vindicated …


Click for Big

DBRS confirmed Enbridge at Pfd-2(low):

DBRS has today confirmed the Issuer Rating of Enbridge Inc. (ENB or the Company) at A (low) and ratings on ENB’s Medium-Term Notes & Unsecured Debentures, Commercial Paper and Cumulative Redeemable Preferred Shares ratings at A (low), R-1 (low) and Pfd-2 (low), respectively, all with Stable trends. The ratings reflect (1) a relatively strong business risk profile, (2) pressure on ENB’s near-to-medium-term credit metrics and (3) results under the ten-year Competitive Tolling Settlement (CTS), effective July 1, 2011.

Enbridge is the proud issuer of ENB.PR.A, ENB.PR.B, ENB.PR.D, ENB.PR.F, ENB.PR.H, ENB.PR.N, ENB.PR.P, ENB.PR.T and ENB.PR.Y, as well as some US-Pay stuff that I don’t track.

It was a negative day for the Canadian preferred share market, with PerpetualDiscounts down 11bp, FixedResets off 3bp and DeemedRetractibles losing 18bp. The Performance Highlights table is longer than one might expect given the modest overall moves, with a preponderance of Straight losers. Volume was on the low side of average.

HIMIPref™ Preferred Indices
These values reflect the December 2008 revision of the HIMIPref™ Indices

Values are provisional and are finalized monthly
Index Mean
Current
Yield
(at bid)
Median
YTW
Median
Average
Trading
Value
Median
Mod Dur
(YTW)
Issues Day’s Perf. Index Value
Ratchet 0.00 % 0.00 % 0 0.00 0 0.2682 % 2,465.9
FixedFloater 4.18 % 3.46 % 27,003 18.46 1 0.1323 % 4,012.5
Floater 3.01 % 3.03 % 62,859 19.64 3 0.2682 % 2,662.5
OpRet 4.63 % 3.38 % 67,802 0.57 3 -0.1541 % 2,636.1
SplitShare 4.74 % 4.90 % 63,167 3.68 6 0.0202 % 2,957.4
Interest-Bearing 0.00 % 0.00 % 0 0.00 0 -0.1541 % 2,410.4
Perpetual-Premium 5.59 % 3.68 % 126,485 0.31 11 -0.0613 % 2,298.0
Perpetual-Discount 5.53 % 5.52 % 183,016 14.55 27 -0.1093 % 2,372.7
FixedReset 5.01 % 3.59 % 227,630 3.37 82 -0.0277 % 2,454.1
Deemed-Retractible 5.08 % 4.20 % 195,601 1.50 42 -0.1802 % 2,409.5
FloatingReset 2.62 % 2.37 % 310,113 4.53 5 -0.0317 % 2,454.0
Performance Highlights
Issue Index Change Notes
BAM.PF.B FixedReset -2.08 % YTW SCENARIO
Maturity Type : Limit Maturity
Maturity Date : 2043-11-01
Maturity Price : 22.55
Evaluated at bid price : 23.55
Bid-YTW : 4.55 %
GWO.PR.N FixedReset -1.99 % YTW SCENARIO
Maturity Type : Hard Maturity
Maturity Date : 2025-01-31
Maturity Price : 25.00
Evaluated at bid price : 21.71
Bid-YTW : 4.75 %
MFC.PR.C Deemed-Retractible -1.66 % YTW SCENARIO
Maturity Type : Hard Maturity
Maturity Date : 2025-01-31
Maturity Price : 25.00
Evaluated at bid price : 21.30
Bid-YTW : 6.48 %
VNR.PR.A FixedReset -1.38 % YTW SCENARIO
Maturity Type : Call
Maturity Date : 2017-10-15
Maturity Price : 25.00
Evaluated at bid price : 25.05
Bid-YTW : 4.38 %
ELF.PR.F Perpetual-Discount -1.26 % YTW SCENARIO
Maturity Type : Limit Maturity
Maturity Date : 2043-11-01
Maturity Price : 23.22
Evaluated at bid price : 23.52
Bid-YTW : 5.67 %
BAM.PF.C Perpetual-Discount -1.04 % YTW SCENARIO
Maturity Type : Limit Maturity
Maturity Date : 2043-11-01
Maturity Price : 20.01
Evaluated at bid price : 20.01
Bid-YTW : 6.14 %
SLF.PR.C Deemed-Retractible -1.01 % YTW SCENARIO
Maturity Type : Hard Maturity
Maturity Date : 2025-01-31
Maturity Price : 25.00
Evaluated at bid price : 21.53
Bid-YTW : 6.27 %
BAM.PR.T FixedReset 1.13 % YTW SCENARIO
Maturity Type : Limit Maturity
Maturity Date : 2043-11-01
Maturity Price : 22.57
Evaluated at bid price : 23.31
Bid-YTW : 4.42 %
TRP.PR.C FixedReset 1.25 % YTW SCENARIO
Maturity Type : Limit Maturity
Maturity Date : 2043-11-01
Maturity Price : 22.28
Evaluated at bid price : 22.61
Bid-YTW : 3.73 %
PWF.PR.L Perpetual-Discount 1.49 % YTW SCENARIO
Maturity Type : Limit Maturity
Maturity Date : 2043-11-01
Maturity Price : 23.51
Evaluated at bid price : 23.81
Bid-YTW : 5.37 %
CIU.PR.C FixedReset 2.33 % YTW SCENARIO
Maturity Type : Limit Maturity
Maturity Date : 2043-11-01
Maturity Price : 21.09
Evaluated at bid price : 21.09
Bid-YTW : 3.82 %
Volume Highlights
Issue Index Shares
Traded
Notes
FTS.PR.J Perpetual-Discount 53,435 RBC crossed two blocks of 25,000 each, both at 23.26.
YTW SCENARIO
Maturity Type : Limit Maturity
Maturity Date : 2043-11-01
Maturity Price : 22.76
Evaluated at bid price : 23.16
Bid-YTW : 5.19 %
CM.PR.G Perpetual-Premium 32,900 Desjardins crossed 21,000 at 25.03.
YTW SCENARIO
Maturity Type : Call
Maturity Date : 2014-05-01
Maturity Price : 25.00
Evaluated at bid price : 25.02
Bid-YTW : 5.35 %
CU.PR.C FixedReset 29,800 Scotia crossed 24,700 at 25.25.
YTW SCENARIO
Maturity Type : Call
Maturity Date : 2017-06-01
Maturity Price : 25.00
Evaluated at bid price : 25.25
Bid-YTW : 3.92 %
MFC.PR.C Deemed-Retractible 21,353 YTW SCENARIO
Maturity Type : Hard Maturity
Maturity Date : 2025-01-31
Maturity Price : 25.00
Evaluated at bid price : 21.30
Bid-YTW : 6.48 %
CM.PR.E Perpetual-Premium 18,616 YTW SCENARIO
Maturity Type : Call
Maturity Date : 2013-12-01
Maturity Price : 25.00
Evaluated at bid price : 25.13
Bid-YTW : -0.36 %
CM.PR.K FixedReset 18,360 YTW SCENARIO
Maturity Type : Call
Maturity Date : 2014-07-31
Maturity Price : 25.00
Evaluated at bid price : 25.50
Bid-YTW : 2.70 %
There were 28 other index-included issues trading in excess of 10,000 shares.
Wide Spread Highlights
Issue Index Quote Data and Yield Notes
CIU.PR.C FixedReset Quote: 21.09 – 21.75
Spot Rate : 0.6600
Average : 0.5245

YTW SCENARIO
Maturity Type : Limit Maturity
Maturity Date : 2043-11-01
Maturity Price : 21.09
Evaluated at bid price : 21.09
Bid-YTW : 3.82 %

BNS.PR.O Deemed-Retractible Quote: 26.24 – 26.61
Spot Rate : 0.3700
Average : 0.2458

YTW SCENARIO
Maturity Type : Call
Maturity Date : 2013-12-01
Maturity Price : 26.00
Evaluated at bid price : 26.24
Bid-YTW : -5.56 %

IAG.PR.G FixedReset Quote: 25.56 – 25.83
Spot Rate : 0.2700
Average : 0.1857

YTW SCENARIO
Maturity Type : Call
Maturity Date : 2017-06-30
Maturity Price : 25.00
Evaluated at bid price : 25.56
Bid-YTW : 3.77 %

PWF.PR.I Perpetual-Premium Quote: 25.20 – 25.50
Spot Rate : 0.3000
Average : 0.2286

YTW SCENARIO
Maturity Type : Call
Maturity Date : 2013-12-01
Maturity Price : 25.00
Evaluated at bid price : 25.20
Bid-YTW : -3.49 %

SLF.PR.G FixedReset Quote: 22.48 – 22.67
Spot Rate : 0.1900
Average : 0.1225

YTW SCENARIO
Maturity Type : Hard Maturity
Maturity Date : 2025-01-31
Maturity Price : 25.00
Evaluated at bid price : 22.48
Bid-YTW : 4.54 %

GWO.PR.M Deemed-Retractible Quote: 25.41 – 25.58
Spot Rate : 0.1700
Average : 0.1047

YTW SCENARIO
Maturity Type : Hard Maturity
Maturity Date : 2025-01-31
Maturity Price : 25.00
Evaluated at bid price : 25.41
Bid-YTW : 5.70 %

October 31, 2013

Friday, November 1st, 2013

Nothing happened today.

It was a mixed day for the Canadian preferred share market, with PerpetualDiscounts up 37bp, FixedResets gaining 11bp and DeemedRetractibles off 3bp. The Performance Highlights table is notable on the downside for domination by BAM Floating Rate issues, while the upside has a surprisingly large population of FixedResets. Volume was high.

PerpetualDiscounts now yield 5.49%, equivalent to 7.14% interest at the standard equivalency factor of 1.3x. Long corporates now yield about 4.7%, so the pre-tax interest-equivalent spread (in this context, the “Seniority Spread”) is now about 245bp, unchanged from October 23.

And that’s it for another month!

HIMIPref™ Preferred Indices
These values reflect the December 2008 revision of the HIMIPref™ Indices

Values are provisional and are finalized monthly
Index Mean
Current
Yield
(at bid)
Median
YTW
Median
Average
Trading
Value
Median
Mod Dur
(YTW)
Issues Day’s Perf. Index Value
Ratchet 0.00 % 0.00 % 0 0.00 0 -0.9452 % 2,459.3
FixedFloater 4.19 % 3.47 % 28,099 18.46 1 2.0702 % 4,007.2
Floater 2.75 % 3.03 % 63,356 19.65 5 -0.9452 % 2,655.4
OpRet 4.62 % 3.16 % 68,248 0.57 3 0.0900 % 2,640.2
SplitShare 4.75 % 4.90 % 63,647 3.68 6 0.1314 % 2,956.8
Interest-Bearing 0.00 % 0.00 % 0 0.00 0 0.0900 % 2,414.2
Perpetual-Premium 5.78 % 0.13 % 105,812 0.08 7 0.1586 % 2,299.4
Perpetual-Discount 5.49 % 5.49 % 186,112 14.46 30 0.3678 % 2,375.3
FixedReset 5.01 % 3.65 % 227,423 3.37 82 0.1110 % 2,454.8
Deemed-Retractible 5.08 % 4.15 % 195,475 1.51 43 -0.0330 % 2,413.8
FloatingReset 0.00 % 0.00 % 0 0.00 5 0.1110 % 2,454.8
Performance Highlights
Issue Index Change Notes
MFC.PR.B Deemed-Retractible -2.43 % YTW SCENARIO
Maturity Type : Hard Maturity
Maturity Date : 2025-01-31
Maturity Price : 25.00
Evaluated at bid price : 21.71
Bid-YTW : 6.41 %
BAM.PR.C Floater -1.69 % YTW SCENARIO
Maturity Type : Limit Maturity
Maturity Date : 2043-10-31
Maturity Price : 17.40
Evaluated at bid price : 17.40
Bid-YTW : 3.04 %
BAM.PR.K Floater -1.64 % YTW SCENARIO
Maturity Type : Limit Maturity
Maturity Date : 2043-10-31
Maturity Price : 17.34
Evaluated at bid price : 17.34
Bid-YTW : 3.05 %
BAM.PR.B Floater -1.52 % YTW SCENARIO
Maturity Type : Limit Maturity
Maturity Date : 2043-10-31
Maturity Price : 17.46
Evaluated at bid price : 17.46
Bid-YTW : 3.03 %
BAM.PR.R FixedReset -1.30 % YTW SCENARIO
Maturity Type : Limit Maturity
Maturity Date : 2043-10-31
Maturity Price : 23.46
Evaluated at bid price : 25.07
Bid-YTW : 4.13 %
TRP.PR.A FixedReset -1.23 % YTW SCENARIO
Maturity Type : Limit Maturity
Maturity Date : 2043-10-31
Maturity Price : 23.63
Evaluated at bid price : 24.11
Bid-YTW : 3.84 %
PWF.PR.S Perpetual-Discount 1.06 % YTW SCENARIO
Maturity Type : Limit Maturity
Maturity Date : 2043-10-31
Maturity Price : 22.60
Evaluated at bid price : 22.96
Bid-YTW : 5.24 %
GWO.PR.H Deemed-Retractible 1.09 % YTW SCENARIO
Maturity Type : Hard Maturity
Maturity Date : 2025-01-31
Maturity Price : 25.00
Evaluated at bid price : 23.27
Bid-YTW : 5.78 %
PWF.PR.F Perpetual-Discount 1.10 % YTW SCENARIO
Maturity Type : Limit Maturity
Maturity Date : 2043-10-31
Maturity Price : 23.70
Evaluated at bid price : 23.97
Bid-YTW : 5.50 %
VNR.PR.A FixedReset 1.20 % YTW SCENARIO
Maturity Type : Call
Maturity Date : 2017-10-15
Maturity Price : 25.00
Evaluated at bid price : 25.40
Bid-YTW : 3.98 %
POW.PR.D Perpetual-Discount 1.36 % YTW SCENARIO
Maturity Type : Limit Maturity
Maturity Date : 2043-10-31
Maturity Price : 22.87
Evaluated at bid price : 23.16
Bid-YTW : 5.43 %
CIU.PR.C FixedReset 1.38 % YTW SCENARIO
Maturity Type : Limit Maturity
Maturity Date : 2043-10-31
Maturity Price : 20.61
Evaluated at bid price : 20.61
Bid-YTW : 3.91 %
BAM.PR.X FixedReset 1.41 % YTW SCENARIO
Maturity Type : Limit Maturity
Maturity Date : 2043-10-31
Maturity Price : 21.96
Evaluated at bid price : 22.36
Bid-YTW : 4.18 %
ENB.PR.D FixedReset 1.43 % YTW SCENARIO
Maturity Type : Limit Maturity
Maturity Date : 2043-10-31
Maturity Price : 22.89
Evaluated at bid price : 24.14
Bid-YTW : 4.19 %
FTS.PR.H FixedReset 1.48 % YTW SCENARIO
Maturity Type : Limit Maturity
Maturity Date : 2043-10-31
Maturity Price : 21.60
Evaluated at bid price : 22.00
Bid-YTW : 3.72 %
ENB.PR.Y FixedReset 1.52 % YTW SCENARIO
Maturity Type : Limit Maturity
Maturity Date : 2043-10-31
Maturity Price : 22.45
Evaluated at bid price : 23.40
Bid-YTW : 4.35 %
FTS.PR.J Perpetual-Discount 1.76 % YTW SCENARIO
Maturity Type : Limit Maturity
Maturity Date : 2043-10-31
Maturity Price : 22.75
Evaluated at bid price : 23.15
Bid-YTW : 5.19 %
ENB.PR.H FixedReset 1.83 % YTW SCENARIO
Maturity Type : Limit Maturity
Maturity Date : 2043-10-31
Maturity Price : 22.46
Evaluated at bid price : 23.32
Bid-YTW : 4.16 %
BAM.PR.G FixedFloater 2.07 % YTW SCENARIO
Maturity Type : Limit Maturity
Maturity Date : 2043-10-31
Maturity Price : 22.89
Evaluated at bid price : 22.68
Bid-YTW : 3.47 %
POW.PR.B Perpetual-Discount 2.08 % YTW SCENARIO
Maturity Type : Limit Maturity
Maturity Date : 2043-10-31
Maturity Price : 23.69
Evaluated at bid price : 24.00
Bid-YTW : 5.61 %
PWF.PR.K Perpetual-Discount 2.15 % YTW SCENARIO
Maturity Type : Limit Maturity
Maturity Date : 2043-10-31
Maturity Price : 23.04
Evaluated at bid price : 23.33
Bid-YTW : 5.32 %
TD.PR.Y FixedReset Not Calc! YTW SCENARIO
Maturity Type : Hard Maturity
Maturity Date : 2022-01-31
Maturity Price : 25.00
Evaluated at bid price : 24.86
Bid-YTW : 3.60 %
Volume Highlights
Issue Index Shares
Traded
Notes
SLF.PR.A Deemed-Retractible 99,266 RBC crossed 80,200 at 22.75.
YTW SCENARIO
Maturity Type : Hard Maturity
Maturity Date : 2025-01-31
Maturity Price : 25.00
Evaluated at bid price : 22.71
Bid-YTW : 5.96 %
SLF.PR.E Deemed-Retractible 97,747 RBC crossed 82,000 at 22.36.
YTW SCENARIO
Maturity Type : Hard Maturity
Maturity Date : 2025-01-31
Maturity Price : 25.00
Evaluated at bid price : 22.13
Bid-YTW : 6.00 %
CU.PR.G Perpetual-Discount 53,571 RBC crossed 24,900 at 21.39.
YTW SCENARIO
Maturity Type : Limit Maturity
Maturity Date : 2043-10-31
Maturity Price : 21.30
Evaluated at bid price : 21.30
Bid-YTW : 5.38 %
GWO.PR.H Deemed-Retractible 49,176 TD crossed 30,000 at 23.38.
YTW SCENARIO
Maturity Type : Hard Maturity
Maturity Date : 2025-01-31
Maturity Price : 25.00
Evaluated at bid price : 23.27
Bid-YTW : 5.78 %
CU.PR.F Perpetual-Discount 34,460 RBC crossed 25,000 at 21.39.
YTW SCENARIO
Maturity Type : Limit Maturity
Maturity Date : 2043-10-31
Maturity Price : 21.30
Evaluated at bid price : 21.30
Bid-YTW : 5.38 %
BAM.PR.M Perpetual-Discount 31,638 YTW SCENARIO
Maturity Type : Limit Maturity
Maturity Date : 2043-10-31
Maturity Price : 20.15
Evaluated at bid price : 20.15
Bid-YTW : 5.97 %
There were 51 other index-included issues trading in excess of 10,000 shares.
Wide Spread Highlights
Issue Index Quote Data and Yield Notes
MFC.PR.B Deemed-Retractible Quote: 21.71 – 22.20
Spot Rate : 0.4900
Average : 0.3070

YTW SCENARIO
Maturity Type : Hard Maturity
Maturity Date : 2025-01-31
Maturity Price : 25.00
Evaluated at bid price : 21.71
Bid-YTW : 6.41 %

PWF.PR.L Perpetual-Discount Quote: 23.46 – 23.90
Spot Rate : 0.4400
Average : 0.3165

YTW SCENARIO
Maturity Type : Limit Maturity
Maturity Date : 2043-10-31
Maturity Price : 23.17
Evaluated at bid price : 23.46
Bid-YTW : 5.45 %

CGI.PR.D SplitShare Quote: 23.81 – 24.26
Spot Rate : 0.4500
Average : 0.3354

YTW SCENARIO
Maturity Type : Soft Maturity
Maturity Date : 2023-06-14
Maturity Price : 25.00
Evaluated at bid price : 23.81
Bid-YTW : 4.45 %

FTS.PR.F Perpetual-Discount Quote: 23.50 – 23.89
Spot Rate : 0.3900
Average : 0.2887

YTW SCENARIO
Maturity Type : Limit Maturity
Maturity Date : 2043-10-31
Maturity Price : 23.21
Evaluated at bid price : 23.50
Bid-YTW : 5.29 %

GWO.PR.P Deemed-Retractible Quote: 24.90 – 25.24
Spot Rate : 0.3400
Average : 0.2476

YTW SCENARIO
Maturity Type : Hard Maturity
Maturity Date : 2025-01-31
Maturity Price : 25.00
Evaluated at bid price : 24.90
Bid-YTW : 5.54 %

BAM.PR.K Floater Quote: 17.34 – 17.75
Spot Rate : 0.4100
Average : 0.3222

YTW SCENARIO
Maturity Type : Limit Maturity
Maturity Date : 2043-10-31
Maturity Price : 17.34
Evaluated at bid price : 17.34
Bid-YTW : 3.05 %

TD.PR.Z: Tiny Premium on Commencement

Friday, November 1st, 2013

TD.PR.Z, a FloatingReset +168 just converted from TD.PR.Y, reached only a very small premium over TD.PR.Y on its debut today.

The issue traded 8,500 shares in a range of 25.00-09 before settling at 25.00-08, 15×5.

TD.PR.Z will be tracked by HIMIPref™ and is assigned to the brand-new FloatingReset subindex.

We can examine the comparables with the help of the Pairs Equivalency Calculator:

FixedReset / FloatingReset Strong Pairs
FixedReset FloatingReset Next
Exchange
Date
Implied
3-Month
Bill Rate
BNS.PR.P BNS.PR.A 2018-4-26 2.54%
TD.PR.S TD.PR.T 2018-7-31 2.29%
BMO.PR.M BMO.PR.R 2018-8-25 2.13%
BNS.PR.Q BNS.PR.B 2018-10-25 2.03%
TD.PR.Y TD.PR.Z 2018-10-31 2.01%

So TD.PR.Y has the smallest premium of the lot, eclipsed even by the previous low of BNS.PR.Q/BNS.PR.B Is the bloom is off the rose as far as FloatingResets are concerned?

Vital Statistics are:

TD.PR.Z FloatingReset YTW SCENARIO
Maturity Type : Hard Maturity
Maturity Date : 2022-01-31
Maturity Price : 25.00
Evaluated at bid price : 25.00
Bid-YTW : 2.52 %