Archive for January, 2014

January 7, 2014

Wednesday, January 8th, 2014

Bloomberg’s Matt Levine pens a good review of JPMorgan’s $1.7-billion Madoff fine:

If you think of JPMorgan’s businesses as operating more or less independently, but occasionally making each other money by cross-selling, then this mess makes more sense. A London investment bank that considered and rejected a derivative-linked investment in Madoff would have no obligations to report its suspicions to U.S. regulators. A boring custody bank that ran Madoff’s checking accounts but had no derivatives traders to get suspicious about him also probably wouldn’t be in trouble for missing the Madoff red flags. Combine the two businesses and the same behavior gets you in trouble. In that sense, JPMorgan’s $1.7 billion forfeiture here looks a bit like a tax on bigness and integration: You can grow huge, offer a loosely integrated set of every conceivable financial product, and bask in the cross-selling opportunities, but every now and then it’ll cost you a couple of billion dollars. So far that trade-off still seems to be worth it for JPMorgan.

It was a mixed day for the Canadian preferred share market, with PerpetualDiscounts gaining 8bp, FixedResets up 16bp and DeemedRetractibles off 11bp. The Performance Highlights table is heavily skewed towards winners. Volume was well above average.

Today’s new issue from PPL is the second this week (too bad they’re both junk), so I win the nickel I bet last Friday. Now let’s go for #3!

HIMIPref™ Preferred Indices
These values reflect the December 2008 revision of the HIMIPref™ Indices

Values are provisional and are finalized monthly
Index Mean
Current
Yield
(at bid)
Median
YTW
Median
Average
Trading
Value
Median
Mod Dur
(YTW)
Issues Day’s Perf. Index Value
Ratchet 0.00 % 0.00 % 0 0.00 0 -0.2419 % 2,544.8
FixedFloater 4.47 % 3.76 % 34,467 17.76 1 0.0471 % 3,756.3
Floater 2.94 % 2.95 % 66,918 19.88 3 -0.2419 % 2,747.7
OpRet 4.63 % 1.80 % 76,771 0.39 3 -0.0515 % 2,663.9
SplitShare 4.86 % 4.81 % 69,916 4.44 5 -0.0241 % 3,016.2
Interest-Bearing 0.00 % 0.00 % 0 0.00 0 -0.0515 % 2,435.9
Perpetual-Premium 5.62 % 4.92 % 128,767 0.31 13 0.0781 % 2,316.5
Perpetual-Discount 5.62 % 5.63 % 169,206 14.38 25 0.0750 % 2,354.9
FixedReset 4.96 % 3.56 % 212,700 3.40 82 0.1576 % 2,481.2
Deemed-Retractible 5.13 % 4.38 % 169,093 2.01 42 -0.1064 % 2,408.6
FloatingReset 2.60 % 2.32 % 241,288 4.34 5 0.1190 % 2,471.4
Performance Highlights
Issue Index Change Notes
IAG.PR.A Deemed-Retractible -1.91 % YTW SCENARIO
Maturity Type : Hard Maturity
Maturity Date : 2025-01-31
Maturity Price : 25.00
Evaluated at bid price : 21.61
Bid-YTW : 6.37 %
CU.PR.D Perpetual-Discount -1.13 % YTW SCENARIO
Maturity Type : Limit Maturity
Maturity Date : 2044-01-07
Maturity Price : 22.32
Evaluated at bid price : 22.66
Bid-YTW : 5.46 %
BNS.PR.O Deemed-Retractible 1.01 % YTW SCENARIO
Maturity Type : Call
Maturity Date : 2014-02-06
Maturity Price : 26.00
Evaluated at bid price : 26.11
Bid-YTW : -4.20 %
PWF.PR.L Perpetual-Discount 1.03 % YTW SCENARIO
Maturity Type : Limit Maturity
Maturity Date : 2044-01-07
Maturity Price : 23.07
Evaluated at bid price : 23.47
Bid-YTW : 5.52 %
CIU.PR.C FixedReset 1.06 % YTW SCENARIO
Maturity Type : Limit Maturity
Maturity Date : 2044-01-07
Maturity Price : 20.07
Evaluated at bid price : 20.07
Bid-YTW : 4.24 %
ELF.PR.F Perpetual-Discount 1.28 % YTW SCENARIO
Maturity Type : Limit Maturity
Maturity Date : 2044-01-07
Maturity Price : 22.69
Evaluated at bid price : 22.98
Bid-YTW : 5.78 %
PWF.PR.P FixedReset 1.29 % YTW SCENARIO
Maturity Type : Limit Maturity
Maturity Date : 2044-01-07
Maturity Price : 22.49
Evaluated at bid price : 22.80
Bid-YTW : 4.03 %
Volume Highlights
Issue Index Shares
Traded
Notes
TRP.PR.D FixedReset 110,755 TD crossed two blocks of 50,000 each, both at 25.20.
YTW SCENARIO
Maturity Type : Call
Maturity Date : 2019-04-30
Maturity Price : 25.00
Evaluated at bid price : 25.13
Bid-YTW : 3.86 %
TRP.PR.A FixedReset 100,542 Desjardins crossed 76,200 at 24.00.
YTW SCENARIO
Maturity Type : Limit Maturity
Maturity Date : 2044-01-07
Maturity Price : 23.46
Evaluated at bid price : 24.01
Bid-YTW : 4.04 %
TD.PR.I FixedReset 76,510 Scotia crossed 75,000 at 25.45.
YTW SCENARIO
Maturity Type : Call
Maturity Date : 2014-07-31
Maturity Price : 25.00
Evaluated at bid price : 25.43
Bid-YTW : 2.47 %
BNS.PR.R FixedReset 58,695 Will reset at 3.83%. Yield to Deemed Maturity 2022-1-31 is 3.71%.
YTW SCENARIO
Maturity Type : Call
Maturity Date : 2014-02-25
Maturity Price : 25.00
Evaluated at bid price : 25.21
Bid-YTW : -3.76 %
CM.PR.M FixedReset 55,525 Scotia crossed 50,000 at 25.46.
YTW SCENARIO
Maturity Type : Call
Maturity Date : 2014-07-31
Maturity Price : 25.00
Evaluated at bid price : 25.47
Bid-YTW : 2.44 %
BAM.PR.P FixedReset 46,672 Scotia crossed 30,000 at 25.63.
YTW SCENARIO
Maturity Type : Call
Maturity Date : 2014-09-30
Maturity Price : 25.00
Evaluated at bid price : 25.60
Bid-YTW : 3.86 %
There were 43 other index-included issues trading in excess of 10,000 shares.
Wide Spread Highlights
Issue Index Quote Data and Yield Notes
TCA.PR.Y Perpetual-Premium Quote: 50.00 – 50.37
Spot Rate : 0.3700
Average : 0.2308

YTW SCENARIO
Maturity Type : Call
Maturity Date : 2014-03-05
Maturity Price : 50.00
Evaluated at bid price : 50.00
Bid-YTW : 3.16 %

PWF.PR.T FixedReset Quote: 25.48 – 25.84
Spot Rate : 0.3600
Average : 0.2261

YTW SCENARIO
Maturity Type : Call
Maturity Date : 2019-01-31
Maturity Price : 25.00
Evaluated at bid price : 25.48
Bid-YTW : 3.86 %

CU.PR.E Perpetual-Discount Quote: 22.69 – 23.03
Spot Rate : 0.3400
Average : 0.2662

YTW SCENARIO
Maturity Type : Limit Maturity
Maturity Date : 2044-01-07
Maturity Price : 22.35
Evaluated at bid price : 22.69
Bid-YTW : 5.45 %

PWF.PR.H Perpetual-Premium Quote: 25.08 – 25.31
Spot Rate : 0.2300
Average : 0.1574

YTW SCENARIO
Maturity Type : Limit Maturity
Maturity Date : 2044-01-07
Maturity Price : 24.86
Evaluated at bid price : 25.08
Bid-YTW : 5.84 %

TRP.PR.D FixedReset Quote: 25.13 – 25.31
Spot Rate : 0.1800
Average : 0.1119

YTW SCENARIO
Maturity Type : Call
Maturity Date : 2019-04-30
Maturity Price : 25.00
Evaluated at bid price : 25.13
Bid-YTW : 3.86 %

HSB.PR.C Deemed-Retractible Quote: 25.14 – 25.35
Spot Rate : 0.2100
Average : 0.1463

YTW SCENARIO
Maturity Type : Call
Maturity Date : 2014-06-30
Maturity Price : 25.00
Evaluated at bid price : 25.14
Bid-YTW : 4.15 %

New Issue: PPL FixedReset, 5.00%+300

Tuesday, January 7th, 2014

Pembina Pipeline Corporation has announced:

that it has entered into an agreement with a syndicate of underwriters, led by Scotiabank and RBC Capital Markets, pursuant to which the underwriters have agreed to purchase from Pembina 6,000,000 cumulative redeemable rate reset class A preferred shares, Series 5 (the “Series 5 Preferred Shares”) at a price of $25.00 per share for distribution to the public.

The holders of Series 5 Preferred Shares will be entitled to receive fixed cumulative dividends at an annual rate of $1.25 per share, payable quarterly on the 1st day of March, June, September and December, as and when declared by the Board of Directors of Pembina, yielding 5.00 per cent per annum, for the initial fixed rate period to but excluding June 1, 2019. The first quarterly dividend payment date is scheduled for March 1, 2014. The dividend rate will reset on June 1, 2019 and every five years thereafter at a rate equal to the sum of the then five-year Government of Canada bond yield plus 3.00 per cent. The Series 5 Preferred Shares are redeemable by Pembina, at its option, on June 1, 2019 and on June 1 of every fifth year thereafter at a price of $25.00 per share plus accrued and unpaid dividends.

The holders of Series 5 Preferred Shares will have the right to convert their shares into cumulative redeemable floating rate class A preferred shares, Series 6 (the “Series 6 Preferred Shares”), subject to certain conditions, on June 1, 2019 and on June 1 of every fifth year thereafter. The holders of Series 6 Preferred Shares will be entitled to receive quarterly floating rate cumulative dividends, as and when declared by the Board of Directors of Pembina, at a rate equal to the sum of the then 90-day Government of Canada treasury bill rate plus 3.00 per cent.

Pembina has granted to the underwriters an option, exercisable at any time up to 48 hours prior to the closing of the offering, to purchase up to an additional 2,000,000 Series 5 Preferred Shares at a price of $25.00 per share.

Proceeds from the offering will be used to partially fund Pembina’s 2014 capital expenditure program, including capital expenditures relating to Pembina’s current expansion and growth projects, to reduce indebtedness under the Corporation’s credit facilities and for general corporate purposes of the Corporation and its affiliates.

Closing of the offering is expected on January 16, 2014, subject to customary closing conditions.

The offering is being made by means of a prospectus supplement under the short form base shelf prospectus filed by the Corporation on February 22, 2013 in each of the provinces of Canada.

The offering must have gone well – they later announced:

that as a result of strong investor demand for its previously announced offering of cumulative redeemable rate reset class A preferred shares, Series 5 (the “Series 5 Preferred Shares”), the size of the offering has been increased to 10 million shares. The offering no longer includes the previously granted underwriters’ option. The aggregate gross proceeds will be $250 million.

Understandable … there was a pretty good new issue concession on this offering compared to the extant issues:

PPL FixedResets
Ticker Initial Dividend Issue Reset Spread Exchange Date Quote 2014-1-6
PPL.PR.A 1.0625 247 2018-12-1 24.61-65
PPL.PR.C 1.175 260 2019-3-1 25.11-40
PPL.PR.? 1.25 300 2019-6-1 25.00 Issue Price

The extant issues got whacked today, down 40-50 cents each.

Update: Pfd-3 from DBRS.

January 6, 2014

Tuesday, January 7th, 2014

Eric Rosengrun of the Boston Fed urges a restrained approach to tapering:

Federal Reserve Bank of Boston President Eric Rosengren, who cast the lone dissent last month against a Fed decision to taper bond buying, said policy makers shouldn’t rush to cut stimulus with inflation below 2 percent.

“With the inflation rate below target and the unemployment rate significantly above target, we believe strongly that monetary policy makers have the opportunity to be patient in removing accommodation,” Rosengren said today on a panel discussion at the American Economic Association’s annual meeting in Philadelphia. “This was one of the motivations for my dissenting vote.”

Consumer prices rose 0.9 percent in November from a year earlier, according to an inflation measure watched by the Fed. The central bank aims for inflation of about 2 percent.

That should get him into the good books of the new chairman!

Yellen, 67, was confirmed today by a 56-26 vote, with 11 Republicans supporting her. She’ll replace Ben S. Bernanke, whose second term as chairman expires Jan. 31, as the Fed trims monthly bond purchases in a first step toward lessening the unprecedented stimulus.

Spend-Every-Penny commented directly on interest rates, rather than getting his puppet to do it:

Finance Minister Jim Flaherty says Canada will be under pressure to raise interest rates in 2014, something Bank of Canada Governor Stephen Poloz has signaled won’t happen soon.

In an interview with CTV aired Sunday, Mr. Flaherty said clawed-back stimulus spending by United States’ Federal Reserve will, along with calls by the Organisation for Economic Co-operation and Development (OECD) and International Monetary Fund (IMF), leave Canada under pressure to raise its rates.

“I think the pressure will be there, because the Fed in the U.S. should stop printing money, and taper off as they say. And that should help,” he said, referring to the dialing back of U.S. bond-buying, or quantitative easing. “The OECD and the IMF have both said to Canada we ought to let our interest rates go up a bit. So there’ll be some pressure there for that to happen.”

There’s some interesting commentary on tenure on Bloomberg:

The proximate cause of the most recent explosion is a letter that University of California at Riverside sent to applicants for tenure-track positions in the English department, informing them that five days hence, they would have the opportunity to interview at the annual meeting of the Modern Languages Association. Rebecca Schulman reasonably, if somewhat intemperately, pointed out that for people living on the paltry wages of a grad student, a last-minute plane ticket is a pretty expensive entry fee for a slim chance of a tenure-track job.

Karen at The Professor Is In blog followed up with a long, angry post about the blind eye that tenured faculty turn to the travails of adjuncts and grad students. The title, “How the Tenured are to the Job Market as White People are to Racism” drew more than a little anger, understandably. But her broader point is sound: academia is now one of the most exploitative labor markets in the world. It’s not quite up there with Hollywood and Broadway in taking kids with a dream and encouraging them to waste the formative decade(s) of their work life chasing after a brass ring that they’re vanishingly unlikely to get, then dumping them on the job market with fewer employment prospects than they had at 22. But it certainly seems to be trying to catch up.

Professional sports also runs on the tournament model, but with one key difference: athletes find out pretty early that they’re not going to make it — early enough to still have a basically normal life doing something else. As the time it takes to get a PhD has stretched out, academia is looking less and less like athletics, and more and more like the theater. The students would be much better off if they were weeded out earlier, in the application process for PhD programs. A substantial fraction — maybe the majority — of PhD programs really shouldn’t exist.

One thing that’s interesting is the assertion that job prospects for the losers of the tenure competition are worse than they would have been had they not done a PhD. That does not speak well for the concept of a liberal arts education, if true. But all in all, my worry is research standards: there’s a lot of dumb research done and a certain amount of it is fabricated.

It was another good day for the Canadian preferred share market, with PerpetualDiscounts winning 17bp, FixedResets gaining 5bp and DeemedRetractibles up 14bp. A good-sized Performance Highlights table is heavily skewed towards winning Straight Perpetuals. Volume was low.

There was a new issue announced today, so the dime I bet on Friday is safe. Now let’s look for #2!

HIMIPref™ Preferred Indices
These values reflect the December 2008 revision of the HIMIPref™ Indices

Values are provisional and are finalized monthly
Index Mean
Current
Yield
(at bid)
Median
YTW
Median
Average
Trading
Value
Median
Mod Dur
(YTW)
Issues Day’s Perf. Index Value
Ratchet 0.00 % 0.00 % 0 0.00 0 -0.4445 % 2,551.0
FixedFloater 4.47 % 3.76 % 33,511 17.76 1 0.1886 % 3,754.6
Floater 2.93 % 2.95 % 61,958 19.89 3 -0.4445 % 2,754.4
OpRet 4.63 % 2.15 % 77,723 0.39 3 0.1288 % 2,665.3
SplitShare 4.86 % 4.87 % 69,987 4.45 5 -0.1844 % 3,016.9
Interest-Bearing 0.00 % 0.00 % 0 0.00 0 0.1288 % 2,437.2
Perpetual-Premium 5.63 % 5.26 % 130,626 4.14 13 0.0628 % 2,314.7
Perpetual-Discount 5.62 % 5.68 % 175,114 14.38 25 0.1717 % 2,353.1
FixedReset 4.97 % 3.51 % 212,812 3.40 82 0.0544 % 2,477.2
Deemed-Retractible 5.13 % 4.38 % 174,783 2.02 42 0.1398 % 2,411.2
FloatingReset 2.60 % 2.33 % 242,649 4.35 5 -0.0409 % 2,468.4
Performance Highlights
Issue Index Change Notes
CU.PR.F Perpetual-Discount -1.45 % YTW SCENARIO
Maturity Type : Limit Maturity
Maturity Date : 2044-01-06
Maturity Price : 21.14
Evaluated at bid price : 21.14
Bid-YTW : 5.39 %
ELF.PR.H Perpetual-Discount 1.06 % YTW SCENARIO
Maturity Type : Limit Maturity
Maturity Date : 2044-01-06
Maturity Price : 23.49
Evaluated at bid price : 23.85
Bid-YTW : 5.78 %
BAM.PR.N Perpetual-Discount 1.17 % YTW SCENARIO
Maturity Type : Limit Maturity
Maturity Date : 2044-01-06
Maturity Price : 19.07
Evaluated at bid price : 19.07
Bid-YTW : 6.28 %
CIU.PR.A Perpetual-Discount 1.23 % YTW SCENARIO
Maturity Type : Limit Maturity
Maturity Date : 2044-01-06
Maturity Price : 21.39
Evaluated at bid price : 21.39
Bid-YTW : 5.45 %
ENB.PR.H FixedReset 1.24 % YTW SCENARIO
Maturity Type : Limit Maturity
Maturity Date : 2044-01-06
Maturity Price : 22.21
Evaluated at bid price : 22.85
Bid-YTW : 4.43 %
MFC.PR.C Deemed-Retractible 1.29 % YTW SCENARIO
Maturity Type : Hard Maturity
Maturity Date : 2025-01-31
Maturity Price : 25.00
Evaluated at bid price : 21.15
Bid-YTW : 6.54 %
SLF.PR.A Deemed-Retractible 1.50 % YTW SCENARIO
Maturity Type : Hard Maturity
Maturity Date : 2025-01-31
Maturity Price : 25.00
Evaluated at bid price : 22.36
Bid-YTW : 6.12 %
BAM.PF.D Perpetual-Discount 1.52 % YTW SCENARIO
Maturity Type : Limit Maturity
Maturity Date : 2044-01-06
Maturity Price : 20.09
Evaluated at bid price : 20.09
Bid-YTW : 6.15 %
GWO.PR.N FixedReset 1.87 % YTW SCENARIO
Maturity Type : Hard Maturity
Maturity Date : 2025-01-31
Maturity Price : 25.00
Evaluated at bid price : 21.80
Bid-YTW : 4.86 %
Volume Highlights
Issue Index Shares
Traded
Notes
TRP.PR.D FixedReset 122,725 RBC crossed blocks of 49,400 and 49,700, both at 25.20.
YTW SCENARIO
Maturity Type : Call
Maturity Date : 2019-04-30
Maturity Price : 25.00
Evaluated at bid price : 25.17
Bid-YTW : 3.82 %
IGM.PR.B Perpetual-Premium 105,839 Desjardins crossed 100,000 at 25.35.
YTW SCENARIO
Maturity Type : Call
Maturity Date : 2018-12-31
Maturity Price : 25.00
Evaluated at bid price : 25.30
Bid-YTW : 5.57 %
CU.PR.C FixedReset 80,780 RBC crossed 74,600 at 25.65.
YTW SCENARIO
Maturity Type : Call
Maturity Date : 2017-06-01
Maturity Price : 25.00
Evaluated at bid price : 25.59
Bid-YTW : 3.40 %
BNS.PR.Z FixedReset 76,387 RBC crossed blocks of 25,000 and 34,900, both at 24.00.
YTW SCENARIO
Maturity Type : Hard Maturity
Maturity Date : 2022-01-31
Maturity Price : 25.00
Evaluated at bid price : 24.08
Bid-YTW : 3.91 %
BNS.PR.R FixedReset 62,980 Will reset at 3.83%.
YTW SCENARIO
Maturity Type : Call
Maturity Date : 2014-02-25
Maturity Price : 25.00
Evaluated at bid price : 25.16
Bid-YTW : -2.25 %
BAM.PF.D Perpetual-Discount 30,268 YTW SCENARIO
Maturity Type : Limit Maturity
Maturity Date : 2044-01-06
Maturity Price : 20.09
Evaluated at bid price : 20.09
Bid-YTW : 6.15 %
There were 19 other index-included issues trading in excess of 10,000 shares.
Wide Spread Highlights
Issue Index Quote Data and Yield Notes
CIU.PR.C FixedReset Quote: 19.86 – 20.64
Spot Rate : 0.7800
Average : 0.5991

YTW SCENARIO
Maturity Type : Limit Maturity
Maturity Date : 2044-01-06
Maturity Price : 19.86
Evaluated at bid price : 19.86
Bid-YTW : 4.28 %

TD.PR.G FixedReset Quote: 25.23 – 25.69
Spot Rate : 0.4600
Average : 0.3114

YTW SCENARIO
Maturity Type : Call
Maturity Date : 2014-04-30
Maturity Price : 25.00
Evaluated at bid price : 25.23
Bid-YTW : 1.86 %

CU.PR.F Perpetual-Discount Quote: 21.14 – 21.53
Spot Rate : 0.3900
Average : 0.2608

YTW SCENARIO
Maturity Type : Limit Maturity
Maturity Date : 2044-01-06
Maturity Price : 21.14
Evaluated at bid price : 21.14
Bid-YTW : 5.39 %

RY.PR.B Deemed-Retractible Quote: 25.35 – 25.64
Spot Rate : 0.2900
Average : 0.1764

YTW SCENARIO
Maturity Type : Call
Maturity Date : 2015-08-24
Maturity Price : 25.00
Evaluated at bid price : 25.35
Bid-YTW : 4.19 %

BNS.PR.O Deemed-Retractible Quote: 25.85 – 26.17
Spot Rate : 0.3200
Average : 0.2133

YTW SCENARIO
Maturity Type : Call
Maturity Date : 2014-04-28
Maturity Price : 25.75
Evaluated at bid price : 25.85
Bid-YTW : 2.90 %

TD.PR.Q Deemed-Retractible Quote: 25.91 – 26.19
Spot Rate : 0.2800
Average : 0.1879

YTW SCENARIO
Maturity Type : Call
Maturity Date : 2014-03-02
Maturity Price : 25.75
Evaluated at bid price : 25.91
Bid-YTW : -1.25 %

New Issue: AIM FixedReset, 6.25%+420

Monday, January 6th, 2014

Aimia Inc. has announced:

that it has agreed to issue to a syndicate of underwriters led by CIBC, TD Securities Inc., RBC Capital Markets and BMO Capital Markets for distribution to the public, 5,000,000 Cumulative Rate Reset Preferred Shares, Series 3 (the “Series 3 Preferred Shares”). The Series 3 Preferred Shares will be issued at a price of C$25.00 per share, for aggregate gross proceeds of C$125 million.

Holders of the Series 3 Preferred Shares will be entitled to receive a cumulative quarterly fixed dividend yielding 6.25% annually for the initial five-year period ending March 31, 2019. The dividend rate will be reset on March 31, 2019 and every five years thereafter at a rate equal to the 5-year Government of Canada bond yield plus 4.20%. The Series 3 Preferred Shares will be redeemable by Aimia on March 31, 2019, and every five years thereafter in accordance with their terms. Holders of Series 3 Preferred Shares will have the right, at their option, to convert their shares into Cumulative Floating Rate Preferred Shares, Series 4 (the “Series 4 Preferred Shares”), subject to certain conditions, on March 31, 2019 and on March 31 every five years thereafter. Holders of the Series 4 Preferred Shares will be entitled to receive cumulative quarterly floating dividends at a rate equal to the three-month Government of Canada Treasury Bill yield plus 4.20%.

Aimia has granted the underwriters an option, exercisable in whole or in part anytime up to 48 hours prior to the closing of the offering, to purchase an additional 1,000,000 Series 3 Preferred Shares at the same offering price. Should the option be fully exercised, the total gross proceeds of the financing will be C$150 million.

The Series 3 Preferred Shares will be offered by way of a prospectus supplement to the short form base shelf prospectus dated April 12, 2013 filed with the securities regulatory authorities in all provinces and territories of Canada.

The net proceeds of the issue will be used by Aimia to supplement its financial resources and for general corporate purposes.

The offering is expected to close on or about January 15, 2014, subject to certain conditions, including conditions set forth in the underwriting agreement.

This issue looks extraordinarily cheap compared to AIM.PR.A, which commenced trading after a ticker change from AER.PR.A, which commenced trading in January, 2010 after being announced earlier that month. It is a 6.50%+375 FixedReset.

AIM.PR.A closed at 25.73-85 on January 3 to yield 4.12% at the bid price to a call on its first Exchange Date, 2015-3-31. It got whacked today after the new issue announcement, closing at 25.41-50, but this is still very, very expensive to the new issue for as long as the new issue is available at par. The new issue has a reset 45bp higher! There’s still a lot of adjustment in store for these two issues.

MAPF Performance: December, 2013

Sunday, January 5th, 2014

The fund performed approximately equal to the indices in December, helped by its low weighting in junk FixedResets, which outperformed (as indicated by the performance difference between TXPR (-1.50%) and TXPL (-1.61%)), but hurt by its holdings in insurance DeemedRetractibles.
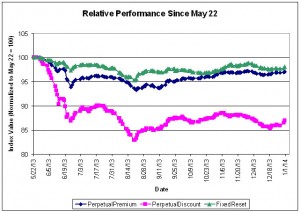
relPerf_131231
Click for Big

relYield_131231
Click for Big

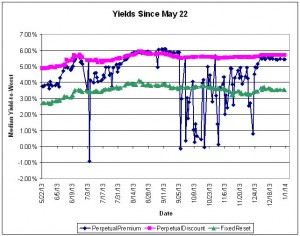
I continue to believe that the decline in the preferred share market has been overdone; the following table shows the increase in yields since May 22 of some fixed income sectors:

Yield Changes
May 22, 2013
to
December 31, 2013
Sector Yield
May 22
Yield
December 31
Change
Five-Year Canadas 1.38% 1.95% +57bp
Long Canadas 2.57% 3.24% +67bp
Long Corporates 4.15% 4.80% +65bp
FixedResets
Investment Grade
(Interest Equivalent)
3.51% 4.56% +105bp
Perpetual-Discounts
Investment Grade
(Interest Equivalent)
6.34% 7.38% +104bp
The change in yield of PerpetualDiscounts is understated due a massive influx of issues from the PerpetualPremium sub-index over the period, which improved credit quality. When the four issues that comprised the PerpetualDiscount sub-index as of May 22 are evaluated as of December 31, the interest-equivalent yield is 8.03% and thus the change is +169bp.

ZPR, is a relatively new ETF comprised of FixedResets and Floating Rate issues and a very high proportion of junk issues, returned XXX%, XXX% and XXX% over the past one-, three- and twelve-month periods, respectively (according to the fund’s data), versus returns for the TXPL index of -1.61%, -0.76% and -3.06%, respectively. The fund has been able to attract assets of about $909.4-million since inception in November 2012; AUM declined in December, but by about 1% less than the index return, indicating that money is still flowing into the fund. I feel that the flows into and out of this fund are very important in determining the performance of its constituents.

The apparent tracking error for ZPR / TXPL discussed at length last month appears to have been a calculation error on the part of the fund’s web production team – it has now disappeared, without any explanation of the change.

TXPR had returns over one- and three-months of -1.50% and -0.33%, respectively with CPD performance within expectations.

Returns for the HIMIPref™ investment grade sub-indices for October were as follows:

HIMIPref™ Indices
Performance to November, 2013
Sub-Index 1-Month 3-month
Ratchet N/A N/A
FixFloat -6.56% -4.34%
Floater -0.29% -0.16%
OpRet -0.15% +1.04%
SplitShare +1.04% +2.70%
Interest N/A N/A
PerpetualPremium -0.04% +1.73%
PerpetualDiscount -0.77% -0.56%
FixedReset -0.83% +0.64%
DeemedRetractible -1.37% +0.72%
FloatingReset +0.16% N/A

It is clear that the HIMIPref™ indices strongly outperformed the broad indices. Some of this will be due to a normalization of the relationship between closing bids and closing prices, which was discussed with respect to November 29.

Malachite Aggressive Preferred Fund’s Net Asset Value per Unit as of the close December 31, 2013, was 9.8717 after a dividend distribution of 0.123904.

Returns to December 31, 2013
Period MAPF BMO-CM “50” Index TXPR
Total Return
CPD – according to Blackrock
One Month -1.62% -1.64% -1.50% -1.52%
Three Months -0.34% -0.18% -0.33% -0.46%
One Year -4.12% -1.23% -2.64% -3.01%
Two Years (annualized) +3.98% +2.08% +1.35% N/A
Three Years (annualized) +3.24% +3.95% +2.80% +2.30%
Four Years (annualized) +6.36% +5.46% +4.01% N/A
Five Years (annualized) +16.31% +9.86% +8.25% +7.57%
Six Years (annualized) +12.68% +4.97% +3.59%  
Seven Years (annualized) +10.51% +3.30%    
Eight Years (annualized) +10.05% +3.42%    
Nine Years (annualized) +9.59% +3.47%    
Ten Years (annualized) +9.96% +3.72%    
Eleven Years (annualized) +11.92% +4.04%    
Twelve Years (annualized) +10.98% +4.07%    
MAPF returns assume reinvestment of distributions, and are shown after expenses but before fees.
CPD Returns are for the NAV and are after all fees and expenses.
* CPD does not directly report its two- or four-year returns.
Figures for Omega Preferred Equity (which are after all fees and expenses) for 1-, 3- and 12-months are -1.13%, +0.31% and -0.77%, respectively, according to Morningstar after all fees & expenses. Three year performance is +3.33%; five year is +8.76%
Figures for Jov Leon Frazer Preferred Equity Fund Class I Units (which are after all fees and expenses) for 1-, 3- and 12-months are -3.04%, -2.06% and -4.45% respectively, according to Morningstar. Three Year performance is +0.28%
Figures for Manulife Preferred Income Fund (formerly AIC Preferred Income Fund) (which are after all fees and expenses) for 1-, 3- and 12-months are -2.52%, -2.43% & -7.24%, respectively. Three Year performance is +0.57%
Figures for Horizons AlphaPro Preferred Share ETF (which are after all fees and expenses) for 1-, 3- and 12-months are -1.28%, +0.16% & -0.73%, respectively. Three year performance is +3.95%
Figures for Altamira Preferred Equity Fund are -1.69%, -0.87% and -3.55% for one-, three- and twelve months, respectively.
The figure for BMO S&P/TSX Laddered Preferred Share Index ETF is -1.64%, -0.86% and -3.47% for one-, three- and twelve-months, respectively.
Figures for NexGen Canadian Preferred Share Tax Managed Fund are not available since our wise regulators are protecting you from inappropriate knowledge.

MAPF returns assume reinvestment of dividends, and are shown after expenses but before fees. Past performance is not a guarantee of future performance. You can lose money investing in Malachite Aggressive Preferred Fund or any other fund. For more information, see the fund’s main page. The fund is available either directly from Hymas Investment Management or through a brokerage account at Odlum Brown Limited.

Those investors who receive their distributions as cash will undoubtedly notice that the current distribution of 0.123904 is about 8% below the 0.133256 average of the past three distributions. Some of this is simply the normal ebb and flow of dividend amounts earned by the fund as ex-Date holdings change, but there are two major contributors to the decline this month:

  • BNS did not pay a dividend this quarter: the 2013 ex-dates were 3/28, 6/27 and 9/27; the dividend payable in January, 2014, was only earned on 2014-1-3. Had this been earned prior to year-end, the fund’s 13Q4 distribution would have been $0.005826 greater, representing about 62% of the shortfall, and
  • As mentioned in the October, 2013 and September, 2013, Portfolio Composition Reviews, the purchase of these issues, and of two CU PerpetualDiscounts, was funded in large part by the sale of HSB.PR.E, which pays a dividend of $1.65 and was sold at prices of about 25.60, implying a Current Yield on the sale of about 6.44%, while BNS.PR.Y was purchased at around 23.50, implying a Current Yield on the purchase of about 4.10% and CU.PR.G was purchased at about 20.65, implying a Current Yield on that purchase of about 5.45%. It is difficult to be precise regarding the distribution reduction that resulted from this effect due to subsequent trading, but the effect is substantial in the context of the distribution reduction.

HSB.PR.E is virtually certain to be called on its first Exchange Date of 2014-6-30, so the fat dividend would be disappearing soon even had the issue not been sold; this is simply another illustration of why Current Yield is a bad metric, even though it is vital when considering short term cash distributions. It will be noted that on the trades mentioned above, Yield-to-Worst increased while Current Yield decreased; implying that the immediate effect on distributions was negative while the effect on Sustainable Yield was positive.

A problem that has bedevilled the market over the past two years has been the OSFI decision not to grandfather Straight Perpetuals as Tier 1 bank capital, and their continued foot-dragging regarding a decision on insurer Straight Perpetuals has segmented the market to the point where trading has become much more difficult. The fund occasionally finds an attractive opportunity to trade between GWO issues, which have a good range of annual coupons (but in which trading is now hampered by the fact that the low-coupon issues are trading near par and are callable at par in the near term), but is “stuck” in the MFC and SLF issues, which have a much narrower range of coupon, while the IAG DeemedRetractibles are quite illiquid. Until the market became so grossly segmented, this was not so much of a problem – but now banks are not available to swap into (because they are so expensive) and non-regulated companies are likewise deprecated (because they are not DeemedRetractibles; they should not participate in the increase in value that will follow the OSFI decision I anticipate and, in addition, are analyzed as perpetuals). The fund’s portfolio is, in effect ‘locked in’ to the MFC & SLF issues due to projected gains from a future OSFI decision, to the detriment of trading gains particularly in May, 2013, when the three lowest-coupon SLF DeemedRetractibles (SLF.PR.C, SLF.PR.D and SLF.PR.E) were the worst performing DeemedRetractibles in the sub-index, and in June, 2013, when the insurance-issued DeemedRetractibles behaved like PerpetualDiscounts in a sharply negative market.

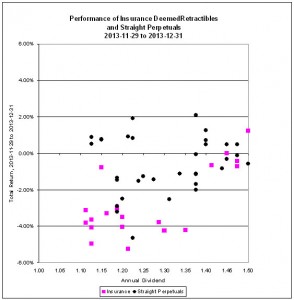
December was another month when insurance DeemedRetractibles significantly underperformed bank DeemedRetractibles:
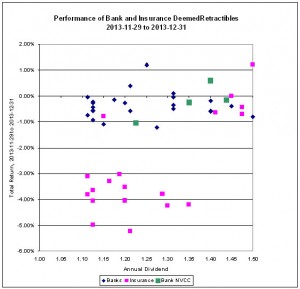
DRRelPerf
Click for Big

… behaving more like Straight Perpetuals:
straightRelPerf
Click for Big

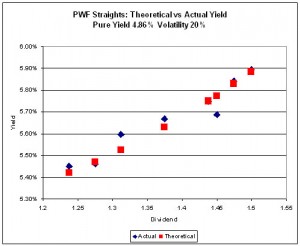
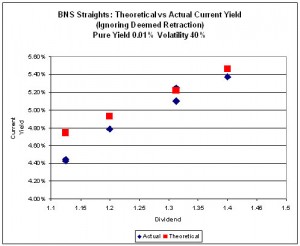
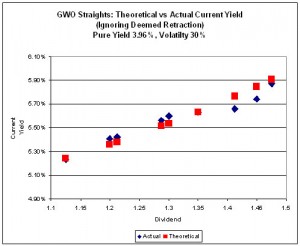
A side effect of the downdraft has been the return of measurable Implied Volatility (all Implied Volatility calculations use bids from January 3):
impVol_GWO_140103
Click for Big

impVol_PWF_140103
Click for Big

impVol_BNS_140103
Click for Big

Implied Volatility of
Three Series of Straight Perpetuals
September, 2013
Issuer Pure Yield Implied Volatility
GWO 3.96% (+0.78) 30% (-2)
PWF 4.86% (+0.52) 20% (-4)
BNS 0.01% (0) 40% (0)
Bracketted figures are changes since November month-end

So we are now seeing a market evaluation of call probabilities such that GWO is now considered to have more of a directional bias than PWF.

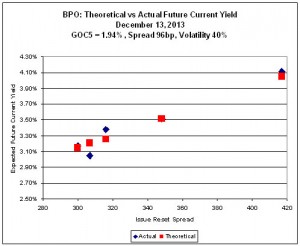
In the September, 2013, edition of PrefLetter, I extended the theory of Implied Volatility to FixedResets – relating the option feature of the Issue Reset Spreads to a theoretical non-callable Market Spread.
impVol_BPO_140103
Click for Big

impVol_FFH_140103
Click for Big

Implied Volatility of
Two Series of FixedResets
November 29, 2013
Issuer Market Reset Spread
(Non-Callable)
Implied Volatility
BPO 96bp (+21) 40% (0)
FFH 344bp (+3) 0%
Bracketted figures are changes since November month-end

These are very interesting results: The BPO issues are trading as if calls are a certainty, while FFH issues are trading as if calls are nonexistent.

Those of you who have been paying attention will remember that in a “normal” market (which we have not seen in well over a year) the slope of this line is related to the implied volatility of yields in Black-Scholes theory, as discussed in the January, 2010, edition of PrefLetter. As has been previously noted, very high levels of Implied Volatility (in the 40% range, at which point the calculation may be considered virtually meaningless) imply a very strong expectation of directionality in future prices – i.e, an expectation that all issues will be redeemed at par.

It is significant that the preferred share market knows no moderation. I suggest that a good baseline estimate for Volatility over a three year period is 15% but the observed figure is generally higher in a rising market and lower in a declining one … with, of course, a period of adjustment in between, which I suspect we are currently experiencing.

Sometimes everything works … sometimes it’s 50-50 … sometimes nothing works. The fund seeks to earn incremental return by selling liquidity (that is, taking the other side of trades that other market participants are strongly motivated to execute), which can also be referred to as ‘trading noise’ – although for quite some time, noise trading has taken a distant second place to the sectoral play on insurance DeemedRetractibles; something that dismays me, particularly given that the market does not yet agree with me regarding the insurance issues! There were a lot of strongly motivated market participants during the Panic of 2007, generating a lot of noise! Unfortunately, the conditions of the Panic may never be repeated in my lifetime … but the fund will simply attempt to make trades when swaps seem profitable, without worrying about the level of monthly turnover.

There’s plenty of room for new money left in the fund. I have shown in PrefLetter that market pricing for FixedResets is very often irrational and I have lots of confidence – backed up by my bond portfolio management experience in the markets for Canadas and Treasuries, and equity trading on the NYSE & TSX – that there is enough demand for liquidity in any market to make the effort of providing it worthwhile (although the definition of “worthwhile” in terms of basis points of outperformance changes considerably from market to market!) I will continue to exert utmost efforts to outperform but it should be borne in mind that there will almost inevitably be periods of underperformance in the future.

The yields available on high quality preferred shares remain elevated, which is reflected in the current estimate of sustainable income.

Calculation of MAPF Sustainable Income Per Unit
Month NAVPU Portfolio
Average
YTW
Leverage
Divisor
Securities
Average
YTW
Capital
Gains
Multiplier
Sustainable
Income
per
current
Unit
June, 2007 9.3114 5.16% 1.03 5.01% 1.3240 0.3524
September 9.1489 5.35% 0.98 5.46% 1.3240 0.3773
December, 2007 9.0070 5.53% 0.942 5.87% 1.3240 0.3993
March, 2008 8.8512 6.17% 1.047 5.89% 1.3240 0.3938
June 8.3419 6.034% 0.952 6.338% 1.3240 $0.3993
September 8.1886 7.108% 0.969 7.335% 1.3240 $0.4537
December, 2008 8.0464 9.24% 1.008 9.166% 1.3240 $0.5571
March 2009 $8.8317 8.60% 0.995 8.802% 1.3240 $0.5872
June 10.9846 7.05% 0.999 7.057% 1.3240 $0.5855
September 12.3462 6.03% 0.998 6.042% 1.3240 $0.5634
December 2009 10.5662 5.74% 0.981 5.851% 1.1141 $0.5549
March 2010 10.2497 6.03% 0.992 6.079% 1.1141 $0.5593
June 10.5770 5.96% 0.996 5.984% 1.1141 $0.5681
September 11.3901 5.43% 0.980 5.540% 1.1141 $0.5664
December 2010 10.7659 5.37% 0.993 5.408% 1.0298 $0.5654
March, 2011 11.0560 6.00% 0.994 5.964% 1.0298 $0.6403
June 11.1194 5.87% 1.018 5.976% 1.0298 $0.6453
September 10.2709 6.10%
Note
1.001 6.106% 1.0298 $0.6090
December, 2011 10.0793 5.63%
Note
1.031 5.805% 1.0000 $0.5851
March, 2012 10.3944 5.13%
Note
0.996 5.109% 1.0000 $0.5310
June 10.2151 5.32%
Note
1.012 5.384% 1.0000 $0.5500
September 10.6703 4.61%
Note
0.997 4.624% 1.0000 $0.4934
December, 2012 10.8307 4.24% 0.989 4.287% 1.0000 $0.4643
March, 2013 10.9033 3.87% 0.996 3.886% 1.0000 $0.4237
June 10.3261 4.81% 0.998 4.80% 1.0000 $0.4957
September 10.0296 5.62% 0.996 5.643% 1.0000 $0.5660
December, 2013 9.8717 6.02% 1.008 5.972% 1.0000 $0.5895
NAVPU is shown after quarterly distributions of dividend income and annual distribution of capital gains.
Portfolio YTW includes cash (or margin borrowing), with an assumed interest rate of 0.00%
The Leverage Divisor indicates the level of cash in the account: if the portfolio is 1% in cash, the Leverage Divisor will be 0.99
Securities YTW divides “Portfolio YTW” by the “Leverage Divisor” to show the average YTW on the securities held; this assumes that the cash is invested in (or raised from) all securities held, in proportion to their holdings.
The Capital Gains Multiplier adjusts for the effects of Capital Gains Dividends. On 2009-12-31, there was a capital gains distribution of $1.989262 which is assumed for this purpose to have been reinvested at the final price of $10.5662. Thus, a holder of one unit pre-distribution would have held 1.1883 units post-distribution; the CG Multiplier reflects this to make the time-series comparable. Note that Dividend Distributions are not assumed to be reinvested.
Sustainable Income is the resultant estimate of the fund’s dividend income per current unit, before fees and expenses. Note that a “current unit” includes reinvestment of prior capital gains; a unitholder would have had the calculated sustainable income with only, say, 0.9 units in the past which, with reinvestment of capital gains, would become 1.0 current units.
DeemedRetractibles are comprised of all Straight Perpetuals (both PerpetualDiscount and PerpetualPremium) issued by BMO, BNS, CM, ELF, GWO, HSB, IAG, MFC, NA, RY, SLF and TD, which are not exchangable into common at the option of the company (definition refined in May, 2011). These issues are analyzed as if their prospectuses included a requirement to redeem at par on or prior to 2022-1-31 (banks) or 2025-1-31 (insurers and insurance holding companies), in addition to the call schedule explicitly defined. See OSFI Does Not Grandfather Extant Tier 1 Capital, CM.PR.D, CM.PR.E, CM.PR.G: Seeking NVCC Status and the January, February, March and June, 2011, editions of PrefLetter for the rationale behind this analysis.
Yields for September, 2011, to January, 2012, were calculated by imposing a cap of 10% on the yields of YLO issues held, in order to avoid their extremely high calculated yields distorting the calculation and to reflect the uncertainty in the marketplace that these yields will be realized. From February to September 2012, yields on these issues have been set to zero. All YLO issues held were sold in October 2012.

Significant positions were held in DeemedRetractible, SplitShare and FixedReset issues on July 31; all of these currently have their yields calculated with the presumption that they will be called by the issuers at par prior to 2022-1-31 (banks) or 2025-1-31 (insurers and insurance holding companies). This presents another complication in the calculation of sustainable yield. The fund also holds positions in various SplitShare issues which also have their yields calculated with the expectation of a maturity at par.

I no longer show calculations that assume the conversion of the entire portfolio into PerpetualDiscounts, as the fund has only a very small position in these issues.

I will also note that the sustainable yield calculated above is not directly comparable with any yield calculation currently reported by any other preferred share fund as far as I am aware. The Sustainable Yield depends on:
i) Calculating Yield-to-Worst for each instrument and using this yield for reporting purposes;
ii) Using the contemporary value of Five-Year Canadas (set at 1.94% for the December 31 calculation) to estimate dividends after reset for FixedResets.

Most funds report Current Yield. For instance, ZPR reports a “Portfolio Yield” of 5.04% as of December 27, 2013 and notes:

Portfolio yield is calculated as the most recent income received by the ETF in the form of dividends interest and other income annualized based on the payment frequently divided by the current market value of ETFs investments.

In other words – it’s the Current Yield, a meaningless number. The Current Yield of MAPF is 5.27% as of December 31, but I will neither report that with any degree of prominence nor take any great pleasure in the fact that it’s a little higher than the ZPR number. It’s meaningless; to accord it any prominence in portfolio reporting is misleading.

It should be noted that the concept of this Sustainable Income calculation was developed when the fund’s holdings were overwhelmingly PerpetualDiscounts – see, for instance, the bottom of the market in November 2008. It is easy to understand that for a PerpetualDiscount, the technique of multiplying yield by price will indeed result in the coupon – a PerpetualDiscount paying $1 annually will show a Sustainable Income of $1, regardless of whether the price is $24 or $17.

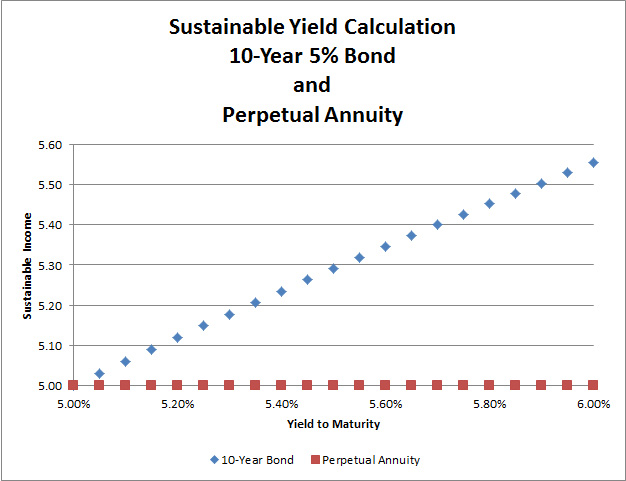
Things are not quite so neat when maturity dates and maturity prices that are different from the current price are thrown into the mix. If we take a notional Straight Perpetual paying $5 annually, the price is $100 when the yield is 5% (all this ignores option effects). As the yield increases to 6%, the price declines to 83.33; and 83.33 x 6% is the same $5. Good enough.

But a ten year bond, priced at 100 when the yield is equal to its coupon of 5%, will decline in price to 92.56; and 92.56 x 6% is 5.55; thus, the calculated Sustainable Income has increased as the price has declined as shown in the graph:

Click for Big

The difference is because the bond’s yield calculation includes the amortization of the discount; therefore, so does the Sustainable Income estimate.

Different assumptions lead to different results from the calculation, but the overall positive trend is apparent. I’m very pleased with the long-term results! It will be noted that if there was no trading in the portfolio, one would expect the sustainable yield to be constant (before fees and expenses). The success of the fund’s trading is showing up in

  • the very good performance against the index
  • the long term increases in sustainable income per unit

As has been noted, the fund has maintained a credit quality equal to or better than the index; outperformance has generally been due to exploitation of trading anomalies.

Again, there are no predictions for the future! The fund will continue to trade between issues in an attempt to exploit market gaps in liquidity, in an effort to outperform the index and keep the sustainable income per unit – however calculated! – growing.

MAPF Portfolio Compostion: December 2013

Saturday, January 4th, 2014

Turnover declined dramatically in December, to about 1%.

There is extreme segmentation in the marketplace, with OSFI’s NVCC rule changes in February 2011 having had the effect of splitting the formerly relatively homogeneous Straight Perpetual class of preferreds into three parts:

  • Unaffected Straight Perpetuals
  • DeemedRetractibles explicitly subject to the rules (banks)
  • DeemedRetractibles considered by me, but not (yet!) by the market, to be likely to be explicitly subject to the rules in the future (insurers and insurance holding companies)

This segmentation, and the extreme valuation differences between the segments, has cut down markedly on the opportunities for trading. Another trend that hasn’t helped was the migration of PerpetualDiscounts into PerpetualPremiums (due to price increases) in early 2013 – many of the PerpetualPremiums had negative Yields-to-Worst and those that don’t aren’t particularly thrilling; speaking very generally, PerpetualPremiums are to be avoided, not traded! This effect has caused the first of the three segments noted above to be untradeable for most practical purposes. The summer’s downdraft reversed the trend and resulted in a large pool of PerpetualDiscounts, but due to their long term they are still, as a class, inferior to DeemedRetractibles.

To make this more clear, it used to be that there were 70-odd Straight Perpetuals and I was more or less indifferent as to which ones I owned (subject, of course, to issuer concentration concerns and other risk management factors). Thus, if any one of these 70 were to go down in price by – say – $0.25, I would quite often have something in inventory that I’d be willing to swap for it. The segmentation means that I am no longer indifferent; in addition to checking the valuation of a potential buy to other Straights, I also have to check its peer group. This cuts down on the potential for trading.

There is no real hope that this situation will be corrected in the near-term. OSFI has indicated that the long-promised “Draft Definition of Capital” for insurers will not be issued “for public consultation in late 2012 or early 2013”, as they fear that it might encourage speculation in the marketplace. It is not clear why OSFI is so afraid of informed speculation, since the constant speculation in the marketplace is currently less informed than it would be with a little bit of regulatory clarity.

As a result of this delay, I have extended the Deemed Maturity date for insurers and insurance holding companies by three years (to 2025-1-31), in the expectation that when OSFI finally does provide clarity, they will allow the same degree of lead-in time for these companies as they did for banks. This has obviously had a major effect on the durations of preferred shares subject to the change but, fortunately, not much on their calculated yields as most of these issues are either trading near par or were trading at sufficient premium that a par call was expected on economic grounds. However, with the declines in the market over the past two months, the expected capital gain on redemption of the insurance-issued DeemedRetractibles has become an important component of the calculated yield.

Due to further footdragging by OSFI, I will be extending the DeemedMaturity date for insurance issues by another two years in the near future.

Sectoral distribution of the MAPF portfolio on December 31 was as follows:

MAPF Sectoral Analysis 2013-12-31
HIMI Indices Sector Weighting YTW ModDur
Ratchet 0% N/A N/A
FixFloat 0% N/A N/A
Floater 0% N/A N/A
OpRet 0% N/A N/A
SplitShare 18.1% (-0.8) 4.57% 5.89
Interest Rearing 0% N/A N/A
PerpetualPremium 0% N/A N/A
PerpetualDiscount 10.7% (+0.6) 5.41% 14.80
Fixed-Reset 6.2% (-0.1) 4.16% 6.99
Deemed-Retractible 55.9% (+0.7) 6.55% 8.36
Scraps (Various) 10.0% (+0.6) 7.04% 11.35
Cash -0.8% (-0.9) 0.00% 0.00
Total 100% 6.02% 8.88
Totals and changes will not add precisely due to rounding. Bracketted figures represent change from November month-end. Cash is included in totals with duration and yield both equal to zero.
DeemedRetractibles are comprised of all Straight Perpetuals (both PerpetualDiscount and PerpetualPremium) issued by BMO, BNS, CM, ELF, GWO, HSB, IAG, MFC, NA, RY, SLF and TD, which are not exchangable into common at the option of the company. These issues are analyzed as if their prospectuses included a requirement to redeem at par on or prior to 2022-1-31 (banks) or 2025-1-3 (insurers and insurance holding companies), in addition to the call schedule explicitly defined. See OSFI Does Not Grandfather Extant Tier 1 Capital, CM.PR.D, CM.PR.E, CM.PR.G: NVCC Status Confirmed and the January, February, March and June, 2011, editions of PrefLetter for the rationale behind this analysis. (all recent editions have a short summary of the argument included in the “DeemedRetractible” section)

Note that the estimate for the time this will become effective for insurers and insurance holding companies was extended by three years in April 2013, due to the delays in OSFI’s providing clarity on the issue.

The “total” reflects the un-leveraged total portfolio (i.e., cash is included in the portfolio calculations and is deemed to have a duration and yield of 0.00.). MAPF will often have relatively large cash balances, both credit and debit, to facilitate trading. Figures presented in the table have been rounded to the indicated precision.

Readers will notice that the changes in sectoral composition exceed the stated turnover of about 1%. This is because some trading was done to offset fund cash flows; such trading does not count in the calculation of turnover.

Credit distribution is:

MAPF Credit Analysis 2013-12-31
DBRS Rating Weighting
Pfd-1 0 (0)
Pfd-1(low) 29.6% (-7.4)
Pfd-2(high) 50.6% (+7.2)
Pfd-2 0%
Pfd-2(low) 10.6% (+0.5)
Pfd-3(high) 1.3% (+0.3)
Pfd-3 4.4% (+0.1)
Pfd-3(low) 2.2% (+0.1)
Pfd-4(high) 0%
Pfd-4 0%
Pfd-4(low) 0.9% (+0.1)
Pfd-5(high) 1.2% (0)
Cash -0.8% (-0.9)
Totals will not add precisely due to rounding. Bracketted figures represent change from October month-end.
A position held in NPI.PR.A is not rated by DBRS, but has been included as “Pfd-3(high)” in the above table on the basis of its S&P rating of P-3(high).

The apparent shift in weight from Pfd-1(low) to Pfd-2(high) is mostly due to the DBRS downgrade of BNS from the former category to the latter.

Liquidity Distribution is:

MAPF Liquidity Analysis 2013-12-31
Average Daily Trading Weighting
<$50,000 0.0% (0)
$50,000 – $100,000 25.9% (-0.5)
$100,000 – $200,000 1.2% (-13.3)
$200,000 – $300,000 48.0% (+5.9)
>$300,000 25.7% (+8.8)
Cash -0.8% (-0.9)
Totals will not add precisely due to rounding. Bracketted figures represent change from November month-end.

Changes in liquidity were driven largely by migration of issues between classes; e.g., both GWO.PR.Q and SLF.PR.C moved from the 100-200 group to 200-300, while GWO.PR.R moved from 200-300 to 300+.

MAPF is, of course, Malachite Aggressive Preferred Fund, a “unit trust” managed by Hymas Investment Management Inc. Further information and links to performance, audited financials and subscription information are available the fund’s web page. The fund may be purchased either directly from Hymas Investment Management or through a brokerage account at Odlum Brown Limited. A “unit trust” is like a regular mutual fund, but is sold by offering memorandum rather than prospectus. This is cheaper, but means subscription is restricted to “accredited investors” (as defined by the Ontario Securities Commission) or those who subscribe for $150,000+. Fund past performances are not a guarantee of future performance. You can lose money investing in MAPF or any other fund.

A similar portfolio composition analysis has been performed on the Claymore Preferred Share ETF (symbol CPD) (and other funds) as of August 31, 2012, and published in the October (mainly methodology), November (most funds), and December (ZPR) 2012, PrefLetter. While direct comparisons are difficult due to the introduction of the DeemedRetractible class of preferred share (see above) it is fair to say:

  • MAPF credit quality is better
  • MAPF liquidity is a lower
  • MAPF Yield is higher
  • Weightings
    • MAPF is much more exposed to DeemedRetractibles
    • MAPF is much less exposed to Operating Retractibles
    • MAPF is much more exposed to SplitShares
    • MAPF is less exposed to FixFloat / Floater / Ratchet
    • MAPF weighting in FixedResets is much lower

January 3, 2013

Friday, January 3rd, 2014

Bernanke gave himself a little pat on the back:

“The combination of financial healing, greater balance in the housing market, less fiscal restraint, and, of course, continued monetary policy accommodation bodes well for U.S. economic growth in coming quarters,” Bernanke said today in remarks prepared for a speech in Philadelphia. “Of course, if the experience of the past few years teaches us anything, it is that we should be cautious in our forecasts.”

He said the decision to taper bond purchases “did not indicate any diminution of its commitment to maintain a highly accommodative monetary policy for as long as needed.”

Bernanke cited payroll employment rising by 7.5 million since 2010 and the economy growing in 16 of the 17 quarters after the recession ended as evidence the Fed’s policies, which also included providing more information on the likely future path of interest rates, have succeeded.

“The economy has made considerable progress since the recovery officially began some four and a half years ago,” the 60-year-old former Princeton University professor said to the annual meeting of the American Economic Association. His tenure ends Jan. 31.

“When the economy was in free fall in late 2008 and early 2009, such improvement was far from certain, as indicated at the time by stock prices that were nearly 60 percent below current levels and very wide credit spreads,” Bernanke said.

Could it be that even Spain and Italy are on the mend?

Spain’s government bonds advanced, pushing 10-year yields to the lowest since May 2010, as a report showing unemployment fell the most in six months in December added to signs the region’s economy is gaining momentum.

The extra yield investors demand to hold Spanish 10-year debt instead of similar-maturity German bonds shrank below 2 percentage points for the first time since May 2011. Spanish unemployment fell 107,570 last month, the biggest decline since June, the Ministry of Labor said. Italy’s bonds also rallied, with 10-year yields dropping to the lowest since May. Germany’s benchmark 10-year bund yield was about three basis points from the highest level since September.

But bank crises take a long time to heal:

It takes eight years on average for economies to regain the level of income lost in a banking crisis, and the U.S. and Germany are alone among 12 in having already done so since the 2008 turmoil, according to Harvard University professors Carmen Reinhart and Kenneth Rogoff.

Their study of 100 banking crises over two centuries, scheduled to be presented today at the conference of the American Economic Association in Philadelphia, found part of the costs of banking difficulties relate to how long it takes economies to recover.

Of the 12 economies examined since 2008, the per-capita gross domestic product of Greece, Italy, Netherlands, Portugal and Spain kept contracting through 2013, according to a draft of the paper. Other than the U.S. or Germany, the rest either didn’t grow or didn’t grow enough to attain their previous income peaks.

In 43 percent of the historical cases studied, economies double-dipped back into recession. The paper covered 63 crises in advanced economies and 37 in larger emerging markets.

The recent rally in the Canadian preferred share continued, with PerpetualDiscounts up 13bp, FixedResets gaining 12bp and DeemedRetractibles winning 30bp. The Performance Highlights table is heavily skewed towards winners, with insurance DeemedRetractibles notable among the winners. Volume picked up a little from its seasonal depths, but remains very low; but as a change of pace, two SplitShare issues made the list.

We can now look forward to next week: I’ll bet a dime that at least one new issue is announced, and a full nickel that there’s at least two.

HIMIPref™ Preferred Indices
These values reflect the December 2008 revision of the HIMIPref™ Indices

Values are provisional and are finalized monthly
Index Mean
Current
Yield
(at bid)
Median
YTW
Median
Average
Trading
Value
Median
Mod Dur
(YTW)
Issues Day’s Perf. Index Value
Ratchet 0.00 % 0.00 % 0 0.00 0 0.4465 % 2,562.4
FixedFloater 4.48 % 3.77 % 34,924 17.76 1 0.7601 % 3,747.5
Floater 2.92 % 2.93 % 61,065 19.94 3 0.4465 % 2,766.7
OpRet 4.64 % 2.11 % 80,747 0.40 3 -0.0515 % 2,661.9
SplitShare 4.85 % 4.73 % 68,595 4.45 5 -0.0240 % 3,022.5
Interest-Bearing 0.00 % 0.00 % 0 0.00 0 -0.0515 % 2,434.0
Perpetual-Premium 5.63 % 5.43 % 128,523 4.33 13 0.0889 % 2,313.2
Perpetual-Discount 5.63 % 5.69 % 181,793 14.38 25 0.1325 % 2,349.1
FixedReset 4.96 % 3.49 % 214,299 3.41 82 0.1239 % 2,475.9
Deemed-Retractible 5.13 % 4.15 % 177,618 1.79 42 0.3042 % 2,407.8
FloatingReset 2.62 % 2.35 % 245,624 4.35 5 0.2359 % 2,469.4
Performance Highlights
Issue Index Change Notes
GWO.PR.P Deemed-Retractible -1.28 % YTW SCENARIO
Maturity Type : Hard Maturity
Maturity Date : 2025-01-31
Maturity Price : 25.00
Evaluated at bid price : 23.97
Bid-YTW : 5.96 %
CU.PR.D Perpetual-Discount -1.24 % YTW SCENARIO
Maturity Type : Limit Maturity
Maturity Date : 2044-01-03
Maturity Price : 22.63
Evaluated at bid price : 23.03
Bid-YTW : 5.36 %
CU.PR.E Perpetual-Discount -1.16 % YTW SCENARIO
Maturity Type : Limit Maturity
Maturity Date : 2044-01-03
Maturity Price : 22.60
Evaluated at bid price : 22.99
Bid-YTW : 5.37 %
PWF.PR.S Perpetual-Discount 1.04 % YTW SCENARIO
Maturity Type : Limit Maturity
Maturity Date : 2044-01-03
Maturity Price : 21.90
Evaluated at bid price : 22.25
Bid-YTW : 5.47 %
GWO.PR.Q Deemed-Retractible 1.05 % YTW SCENARIO
Maturity Type : Hard Maturity
Maturity Date : 2025-01-31
Maturity Price : 25.00
Evaluated at bid price : 23.15
Bid-YTW : 6.12 %
BAM.PR.X FixedReset 1.14 % YTW SCENARIO
Maturity Type : Limit Maturity
Maturity Date : 2044-01-03
Maturity Price : 21.33
Evaluated at bid price : 21.33
Bid-YTW : 4.61 %
SLF.PR.D Deemed-Retractible 1.34 % YTW SCENARIO
Maturity Type : Hard Maturity
Maturity Date : 2025-01-31
Maturity Price : 25.00
Evaluated at bid price : 21.23
Bid-YTW : 6.41 %
SLF.PR.C Deemed-Retractible 1.43 % YTW SCENARIO
Maturity Type : Hard Maturity
Maturity Date : 2025-01-31
Maturity Price : 25.00
Evaluated at bid price : 21.21
Bid-YTW : 6.42 %
FTS.PR.F Perpetual-Discount 1.48 % YTW SCENARIO
Maturity Type : Limit Maturity
Maturity Date : 2044-01-03
Maturity Price : 22.28
Evaluated at bid price : 22.56
Bid-YTW : 5.48 %
GWO.PR.N FixedReset 1.52 % YTW SCENARIO
Maturity Type : Hard Maturity
Maturity Date : 2025-01-31
Maturity Price : 25.00
Evaluated at bid price : 21.40
Bid-YTW : 5.07 %
BAM.PF.B FixedReset 1.56 % YTW SCENARIO
Maturity Type : Call
Maturity Date : 2019-03-31
Maturity Price : 25.00
Evaluated at bid price : 24.76
Bid-YTW : 4.44 %
SLF.PR.B Deemed-Retractible 1.59 % YTW SCENARIO
Maturity Type : Hard Maturity
Maturity Date : 2025-01-31
Maturity Price : 25.00
Evaluated at bid price : 22.40
Bid-YTW : 6.15 %
Volume Highlights
Issue Index Shares
Traded
Notes
TRP.PR.D FixedReset 84,463 RBC crossed blocks of 50,000 and 20,000, both at 25.20.
YTW SCENARIO
Maturity Type : Call
Maturity Date : 2019-04-30
Maturity Price : 25.00
Evaluated at bid price : 25.15
Bid-YTW : 3.83 %
TD.PR.T FloatingReset 83,111 Nesbit crossed 67,500 at 25.17.
YTW SCENARIO
Maturity Type : Call
Maturity Date : 2018-07-31
Maturity Price : 25.00
Evaluated at bid price : 25.15
Bid-YTW : 2.35 %
NA.PR.O FixedReset 41,183 Called for redemption.
YTW SCENARIO
Maturity Type : Call
Maturity Date : 2014-02-15
Maturity Price : 25.00
Evaluated at bid price : 25.38
Bid-YTW : 1.19 %
BNA.PR.C SplitShare 40,300 RBC crossed blocks of 20,000 and 15,600, both at 24.26.
YTW SCENARIO
Maturity Type : Hard Maturity
Maturity Date : 2019-01-10
Maturity Price : 25.00
Evaluated at bid price : 24.27
Bid-YTW : 5.12 %
CGI.PR.D SplitShare 28,300 TD crossed 18,900 at 25.09.
YTW SCENARIO
Maturity Type : Soft Maturity
Maturity Date : 2023-06-14
Maturity Price : 25.00
Evaluated at bid price : 25.00
Bid-YTW : 3.79 %
BNS.PR.R FixedReset 26,280 Will reset at 3.83%.
YTW SCENARIO
Maturity Type : Call
Maturity Date : 2014-02-25
Maturity Price : 25.00
Evaluated at bid price : 25.12
Bid-YTW : -1.04 %
There were 13 other index-included issues trading in excess of 10,000 shares.
Wide Spread Highlights
Issue Index Quote Data and Yield Notes
GWO.PR.P Deemed-Retractible Quote: 23.97 – 24.53
Spot Rate : 0.5600
Average : 0.3715

YTW SCENARIO
Maturity Type : Hard Maturity
Maturity Date : 2025-01-31
Maturity Price : 25.00
Evaluated at bid price : 23.97
Bid-YTW : 5.96 %

BNS.PR.N Deemed-Retractible Quote: 25.72 – 26.10
Spot Rate : 0.3800
Average : 0.2284

YTW SCENARIO
Maturity Type : Call
Maturity Date : 2014-02-28
Maturity Price : 25.75
Evaluated at bid price : 25.72
Bid-YTW : 3.24 %

RY.PR.X FixedReset Quote: 25.76 – 26.00
Spot Rate : 0.2400
Average : 0.1503

YTW SCENARIO
Maturity Type : Call
Maturity Date : 2014-08-24
Maturity Price : 25.00
Evaluated at bid price : 25.76
Bid-YTW : 2.56 %

GWO.PR.I Deemed-Retractible Quote: 21.50 – 21.82
Spot Rate : 0.3200
Average : 0.2327

YTW SCENARIO
Maturity Type : Hard Maturity
Maturity Date : 2025-01-31
Maturity Price : 25.00
Evaluated at bid price : 21.50
Bid-YTW : 6.32 %

ENB.PR.H FixedReset Quote: 22.57 – 22.93
Spot Rate : 0.3600
Average : 0.2732

YTW SCENARIO
Maturity Type : Limit Maturity
Maturity Date : 2044-01-03
Maturity Price : 22.04
Evaluated at bid price : 22.57
Bid-YTW : 4.50 %

SLF.PR.A Deemed-Retractible Quote: 22.03 – 22.32
Spot Rate : 0.2900
Average : 0.2039

YTW SCENARIO
Maturity Type : Hard Maturity
Maturity Date : 2025-01-31
Maturity Price : 25.00
Evaluated at bid price : 22.03
Bid-YTW : 6.30 %

January 2, 2014

Thursday, January 2nd, 2014

Nothing happened today, either.

It was a mixed day for the Canadian preferred share market, with PerpetualDiscounts up 27bp, FixedResets off 1bp and DeemedRetractibles gaining 12bp. The Performance Highlights table is heavily skewed towards winners, with Floating Rate issues notable on the plus side. Volume was abysmally low – will the current rally in Straight Perpetuals survive the return of trading activity?

HIMIPref™ Preferred Indices
These values reflect the December 2008 revision of the HIMIPref™ Indices

Values are provisional and are finalized monthly
Index Mean
Current
Yield
(at bid)
Median
YTW
Median
Average
Trading
Value
Median
Mod Dur
(YTW)
Issues Day’s Perf. Index Value
Ratchet 0.00 % 0.00 % 0 0.00 0 1.0908 % 2,551.0
FixedFloater 4.51 % 3.81 % 35,449 17.70 1 1.2019 % 3,719.2
Floater 2.93 % 2.94 % 61,607 19.90 3 1.0908 % 2,754.4
OpRet 4.64 % 2.80 % 81,188 0.40 3 0.0902 % 2,663.3
SplitShare 4.85 % 4.65 % 71,105 4.45 5 0.0722 % 3,023.2
Interest-Bearing 0.00 % 0.00 % 0 0.00 0 0.0902 % 2,435.3
Perpetual-Premium 5.63 % 4.98 % 129,259 4.15 13 -0.0536 % 2,311.2
Perpetual-Discount 5.64 % 5.69 % 182,321 14.40 25 0.2658 % 2,346.0
FixedReset 4.96 % 3.52 % 216,606 3.41 82 -0.0111 % 2,472.8
Deemed-Retractible 5.13 % 4.28 % 184,381 2.03 42 0.1224 % 2,400.5
FloatingReset 2.62 % 2.36 % 246,400 4.36 5 -0.1897 % 2,463.6
Performance Highlights
Issue Index Change Notes
PWF.PR.P FixedReset -1.06 % YTW SCENARIO
Maturity Type : Limit Maturity
Maturity Date : 2044-01-02
Maturity Price : 22.16
Evaluated at bid price : 22.42
Bid-YTW : 4.11 %
SLF.PR.C Deemed-Retractible 1.01 % YTW SCENARIO
Maturity Type : Hard Maturity
Maturity Date : 2025-01-31
Maturity Price : 25.00
Evaluated at bid price : 20.91
Bid-YTW : 6.59 %
CU.PR.G Perpetual-Discount 1.09 % YTW SCENARIO
Maturity Type : Limit Maturity
Maturity Date : 2044-01-02
Maturity Price : 21.26
Evaluated at bid price : 21.26
Bid-YTW : 5.36 %
BAM.PR.C Floater 1.19 % YTW SCENARIO
Maturity Type : Limit Maturity
Maturity Date : 2044-01-02
Maturity Price : 17.85
Evaluated at bid price : 17.85
Bid-YTW : 2.95 %
BAM.PR.G FixedFloater 1.20 % YTW SCENARIO
Maturity Type : Limit Maturity
Maturity Date : 2044-01-02
Maturity Price : 21.65
Evaluated at bid price : 21.05
Bid-YTW : 3.81 %
BAM.PR.B Floater 1.24 % YTW SCENARIO
Maturity Type : Limit Maturity
Maturity Date : 2044-01-02
Maturity Price : 18.00
Evaluated at bid price : 18.00
Bid-YTW : 2.93 %
CU.PR.D Perpetual-Discount 1.39 % YTW SCENARIO
Maturity Type : Limit Maturity
Maturity Date : 2044-01-02
Maturity Price : 23.02
Evaluated at bid price : 23.32
Bid-YTW : 5.30 %
CU.PR.E Perpetual-Discount 1.39 % YTW SCENARIO
Maturity Type : Limit Maturity
Maturity Date : 2044-01-02
Maturity Price : 22.96
Evaluated at bid price : 23.26
Bid-YTW : 5.32 %
GWO.PR.P Deemed-Retractible 2.40 % YTW SCENARIO
Maturity Type : Hard Maturity
Maturity Date : 2025-01-31
Maturity Price : 25.00
Evaluated at bid price : 24.28
Bid-YTW : 5.80 %
Volume Highlights
Issue Index Shares
Traded
Notes
ENB.PR.N FixedReset 26,187 Scotia bought 13,200 from anonymous at 24.45.
YTW SCENARIO
Maturity Type : Call
Maturity Date : 2018-12-01
Maturity Price : 25.00
Evaluated at bid price : 24.62
Bid-YTW : 4.45 %
TD.PR.G FixedReset 21,825 YTW SCENARIO
Maturity Type : Call
Maturity Date : 2014-04-30
Maturity Price : 25.00
Evaluated at bid price : 25.62
Bid-YTW : 1.80 %
SLF.PR.A Deemed-Retractible 18,538 RBC crossed 15,000 at 22.00.
YTW SCENARIO
Maturity Type : Hard Maturity
Maturity Date : 2025-01-31
Maturity Price : 25.00
Evaluated at bid price : 21.91
Bid-YTW : 6.36 %
TRP.PR.D FixedReset 17,403 YTW SCENARIO
Maturity Type : Call
Maturity Date : 2019-04-30
Maturity Price : 25.00
Evaluated at bid price : 25.29
Bid-YTW : 3.71 %
BNS.PR.R FixedReset 14,917 Will reset with 3.83% coupon.
YTW SCENARIO
Maturity Type : Call
Maturity Date : 2014-02-25
Maturity Price : 25.00
Evaluated at bid price : 25.30
Bid-YTW : 0.58 %
NA.PR.O FixedReset 14,385 Called for redemption.
YTW SCENARIO
Maturity Type : Call
Maturity Date : 2014-02-15
Maturity Price : 25.00
Evaluated at bid price : 25.38
Bid-YTW : 1.17 %
There were 1 other index-included issues trading in excess of 10,000 shares.
Wide Spread Highlights
Issue Index Quote Data and Yield Notes
BAM.PR.J OpRet Quote: 26.40 – 26.94
Spot Rate : 0.5400
Average : 0.3000

YTW SCENARIO
Maturity Type : Call
Maturity Date : 2014-03-31
Maturity Price : 26.00
Evaluated at bid price : 26.40
Bid-YTW : -1.06 %

RY.PR.F Deemed-Retractible Quote: 25.30 – 25.67
Spot Rate : 0.3700
Average : 0.2199

YTW SCENARIO
Maturity Type : Hard Maturity
Maturity Date : 2022-01-31
Maturity Price : 25.00
Evaluated at bid price : 25.30
Bid-YTW : 4.37 %

BAM.PR.T FixedReset Quote: 24.10 – 24.49
Spot Rate : 0.3900
Average : 0.2464

YTW SCENARIO
Maturity Type : Limit Maturity
Maturity Date : 2044-01-02
Maturity Price : 22.99
Evaluated at bid price : 24.10
Bid-YTW : 4.41 %

BMO.PR.K Deemed-Retractible Quote: 25.81 – 26.10
Spot Rate : 0.2900
Average : 0.1745

YTW SCENARIO
Maturity Type : Call
Maturity Date : 2016-11-25
Maturity Price : 25.00
Evaluated at bid price : 25.81
Bid-YTW : 4.28 %

ELF.PR.H Perpetual-Discount Quote: 23.41 – 23.78
Spot Rate : 0.3700
Average : 0.2577

YTW SCENARIO
Maturity Type : Limit Maturity
Maturity Date : 2044-01-02
Maturity Price : 23.09
Evaluated at bid price : 23.41
Bid-YTW : 5.88 %

TRP.PR.A FixedReset Quote: 23.58 – 23.99
Spot Rate : 0.4100
Average : 0.3026

YTW SCENARIO
Maturity Type : Limit Maturity
Maturity Date : 2044-01-02
Maturity Price : 23.02
Evaluated at bid price : 23.58
Bid-YTW : 4.12 %