Assiduous Reader JP, who often sends me interesting snippets, unlike youse other bums, brings to my attention a small preferred share issue from China:
Industrial and Commercial Bank of China will issue US$5.7 billion worth of preferred shares in three currencies in what will be the largest offshore issuance of hybrid securities from a mainland firm.
ICBC proposed issuing US$2.94 billion in dollar-denominated shares, €600 million (HK$5.73 billion) and 12 billion yuan (HK$15.13 billion) all priced at 6 per cent, according to a regulatory filing.
The shares will count as additional tier-1 capital, boosting the bank’s capital adequacy ratio as defined by Basel III, an international accord aimed at raising the viability of banks and avoiding public bailouts.
The record deal also marked the first time a mainland bank issued offshore preferred shares denominated in three currencies.
ICBC International was the sole global coordinator and UBS, Bank of America Merrill Lynch and Goldman Sachs were joint book-runners on the deal.
It’s nice to see some real progress on solar power efficiency:
UNSW’s solar researchers have converted over 40% of the sunlight hitting a solar system into electricity, the highest efficiency ever reported.
The world-beating efficiency was achieved in outdoor tests in Sydney, before being independently confirmed by the National Renewable Energy Laboratory (NREL) at their outdoor test facility in the United States.
The work was funded by the Australian Renewable Energy Agency (ARENA) and supported by the Australia–US Institute for Advanced Photovoltaics (AUSIAPV).
“This is the highest efficiency ever reported for sunlight conversion into electricity,” UNSW Scientia Professor and Director of the Australian Centre for Advanced Photovoltaics (ACAP) Professor Martin Green said.
The price wasn’t mentioned, but the basic idea comes first, right? Then give it to the engineers to make it cheap. Too bad this research wasn’t done in Ontari-ari-ari-owe, but we blew our solar budget on political grandstanding.
After posting the MAPF November statements, I posted the following on the Canada Post Facebook Page:
I just sent a batch of letters with Madonna & Child stamps when a thought struck me and caused me to check your website.
I see your “Holiday 2014” collection is dominated by Santa Claus – rather childish in my view, but the important thing is that they are stamps and you stick them on letters and they get delivered.
But why are there no stamps with an Islamic theme? No Jewish stamps? No stamps for Kwanzai, Bohdi Day, Pancha Ganapati or Yule? It would make things more interesting.
It was an awful day for equities:
Oil, bank and raw-materials are the biggest laggards in Canada for the first time since at least 1988, fueling concern the nation’s economy is fading just as the U.S. is taking off.
The three industries, which collectively account for two-thirds of the Standard & Poor’s/TSX Composite Index, are the worst performers among 10 groups this year, according to data compiled by Bloomberg. The nation’s largest banks joined oil and materials in a rout that erased 4.1 percent from the benchmark index in three days, including the biggest one-day retreat since June 2013.
The selloff in the biggest pillars of the Canadian equity market comes as data showing a weaker jobs market coupled with slowing exports suggest a tentative economic recovery. Banks have slumped as earnings last week collectively missed estimates amid declining trading revenue and sluggish consumer borrowing. Meanwhile, the S&P 500 Index has reached all-time highs on signs of accelerating growth.
…
The S&P 500/TSX tumbled 329.53 points, or 2.3 percent, to 14,144.17 yesterday as the selloff in oil accelerated, with energy companies plunging the most since August 2011 as crude dropped to a five-year low.
…
The Canadian benchmark equity gauge has plunged 9.7 percent since reaching a record on Sept. 3, wiping out more than C$270 billion in market value and reducing its gain for the year to 3.8 percent. The S&P/TSX, which was the second-best performing market among developed nations through the first half of the year, now ranks 16th.
Happy crowds of preferred share investors held parades for their portfolios today.

Click for Big
And with TXPR and TXPL down 0.76% and 0.96%, why not?
It was an appallingly poor day for the Canadian preferred share market, with PerpetualDiscounts off 24bp, FixedResets losing 85bp and DeemedRetractibles down 36bp. There is a very lengthy list of losers, dominated by FixedResets. Volume was high.
And given these massive changes, let’s have another look at some pictures of Implied Volatility. Remember that all rich /cheap assessments are
- based on Implied Volatility Theory only
- are relative only to other FixedResets from the same issuer
- assume constant GOC-5 yield
- assume constant Implied Volatility
- assume constant spread
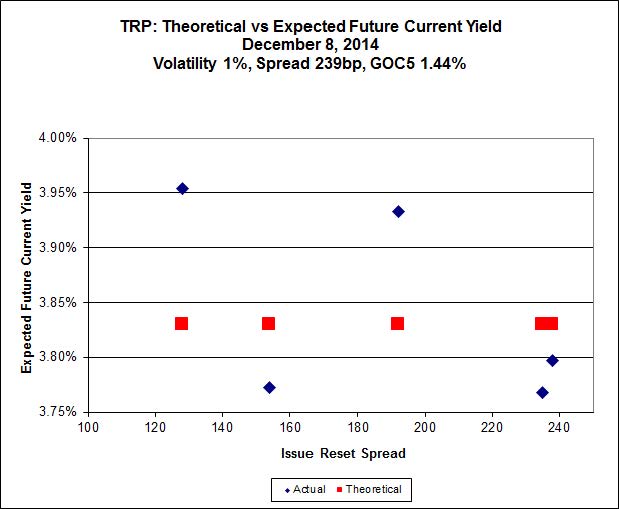
Here’s TRP:
Click for Big
So according to this, TRP.PR.A, bid at 21.36, is $0.57 cheap, but it has already reset. TRP.PR.B, bid at 17.20, is $0.55 cheap, but it resets 2015-6-30. TRP.PR.C, bid at 19.75, is $0.30 expensive, but it resets 2016-1-30. It looks like the market is beginning to realize that TRP.PR.C is overpriced.

Click for Big
MFC implied volatility is still very high. The low-spread MFC.PR.F looks a little cheap … and it doesn’t reset until 2016-6-19.

Click for Big
BAM.PR.X, with a +180bp spread, bid at 21.15, looks $0.79 cheap and doesn’t reset until 2017-6-30 – but Implied Volatility is still a little high and is dropping rapidly (a reduction in Implied Volatility flattens the curve and causes low-spread issues to underperform). BAM.PR.R, with a +230bp spread, bid at 25.51, looks $1.56 rich and resets 2016-6-30. So go figure that one out, wise guy.
Click for Big
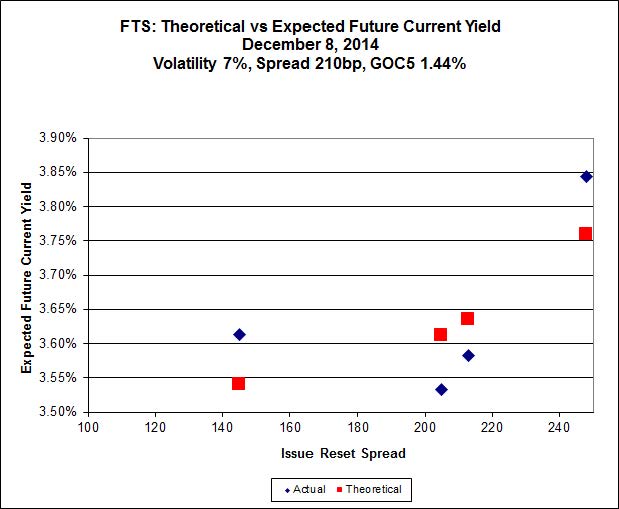
This is just weird because the middle is expensive and the ends are cheap but anyway … FTS.PR.H, with a spread of +145bp, and bid at 20.00, looks $0.41 cheap and resets 2015-6-1. FTS.PR.K, with a spread of +205bp, and bid at 24.70, looks $0.54 expensive and resets 2019-3-1
| HIMIPref™ Preferred Indices These values reflect the December 2008 revision of the HIMIPref™ Indices Values are provisional and are finalized monthly |
|||||||
| Index | Mean Current Yield (at bid) |
Median YTW |
Median Average Trading Value |
Median Mod Dur (YTW) |
Issues | Day’s Perf. | Index Value |
| Ratchet | 0.00 % | 0.00 % | 0 | 0.00 | 0 | -0.3254 % | 2,528.6 |
| FixedFloater | 0.00 % | 0.00 % | 0 | 0.00 | 0 | -0.3254 % | 4,003.2 |
| Floater | 2.98 % | 3.09 % | 62,509 | 19.42 | 4 | -0.3254 % | 2,688.0 |
| OpRet | 4.40 % | -11.74 % | 26,639 | 0.08 | 2 | -0.0195 % | 2,758.5 |
| SplitShare | 4.30 % | 3.92 % | 40,711 | 3.73 | 5 | -0.2697 % | 3,177.9 |
| Interest-Bearing | 0.00 % | 0.00 % | 0 | 0.00 | 0 | -0.0195 % | 2,522.4 |
| Perpetual-Premium | 5.44 % | -1.70 % | 70,645 | 0.08 | 20 | -0.4542 % | 2,476.4 |
| Perpetual-Discount | 5.17 % | 5.11 % | 113,618 | 15.27 | 15 | -0.2392 % | 2,650.5 |
| FixedReset | 4.25 % | 3.71 % | 182,150 | 16.54 | 74 | -0.8512 % | 2,530.6 |
| Deemed-Retractible | 4.99 % | 0.67 % | 103,056 | 0.14 | 40 | -0.3755 % | 2,603.5 |
| FloatingReset | 2.54 % | 1.89 % | 60,065 | 0.08 | 5 | -0.0861 % | 2,550.6 |
| Performance Highlights | |||
| Issue | Index | Change | Notes |
| TRP.PR.C | FixedReset | -3.51 % | YTW SCENARIO Maturity Type : Limit Maturity Maturity Date : 2044-12-08 Maturity Price : 19.80 Evaluated at bid price : 19.80 Bid-YTW : 3.92 % |
| ENB.PR.T | FixedReset | -3.49 % | YTW SCENARIO Maturity Type : Limit Maturity Maturity Date : 2044-12-08 Maturity Price : 22.28 Evaluated at bid price : 22.95 Bid-YTW : 4.30 % |
| PWF.PR.P | FixedReset | -3.36 % | YTW SCENARIO Maturity Type : Limit Maturity Maturity Date : 2044-12-08 Maturity Price : 20.40 Evaluated at bid price : 20.40 Bid-YTW : 3.87 % |
| MFC.PR.F | FixedReset | -3.35 % | YTW SCENARIO Maturity Type : Hard Maturity Maturity Date : 2025-01-31 Maturity Price : 25.00 Evaluated at bid price : 20.75 Bid-YTW : 5.27 % |
| SLF.PR.G | FixedReset | -3.05 % | YTW SCENARIO Maturity Type : Hard Maturity Maturity Date : 2025-01-31 Maturity Price : 25.00 Evaluated at bid price : 19.10 Bid-YTW : 6.06 % |
| ENB.PR.P | FixedReset | -2.49 % | YTW SCENARIO Maturity Type : Limit Maturity Maturity Date : 2044-12-08 Maturity Price : 22.39 Evaluated at bid price : 23.12 Bid-YTW : 4.26 % |
| MFC.PR.I | FixedReset | -2.38 % | YTW SCENARIO Maturity Type : Call Maturity Date : 2017-09-19 Maturity Price : 25.00 Evaluated at bid price : 25.42 Bid-YTW : 3.73 % |
| GWO.PR.N | FixedReset | -2.37 % | YTW SCENARIO Maturity Type : Hard Maturity Maturity Date : 2025-01-31 Maturity Price : 25.00 Evaluated at bid price : 19.33 Bid-YTW : 5.83 % |
| HSE.PR.A | FixedReset | -2.27 % | YTW SCENARIO Maturity Type : Limit Maturity Maturity Date : 2044-12-08 Maturity Price : 19.35 Evaluated at bid price : 19.35 Bid-YTW : 4.21 % |
| ENB.PR.J | FixedReset | -2.16 % | YTW SCENARIO Maturity Type : Limit Maturity Maturity Date : 2044-12-08 Maturity Price : 22.84 Evaluated at bid price : 24.02 Bid-YTW : 4.21 % |
| ENB.PR.F | FixedReset | -1.87 % | YTW SCENARIO Maturity Type : Limit Maturity Maturity Date : 2044-12-08 Maturity Price : 22.72 Evaluated at bid price : 23.60 Bid-YTW : 4.17 % |
| ENB.PF.E | FixedReset | -1.86 % | YTW SCENARIO Maturity Type : Limit Maturity Maturity Date : 2044-12-08 Maturity Price : 22.88 Evaluated at bid price : 24.31 Bid-YTW : 4.24 % |
| ENB.PF.G | FixedReset | -1.85 % | YTW SCENARIO Maturity Type : Limit Maturity Maturity Date : 2044-12-08 Maturity Price : 22.88 Evaluated at bid price : 24.35 Bid-YTW : 4.25 % |
| ENB.PF.A | FixedReset | -1.81 % | YTW SCENARIO Maturity Type : Limit Maturity Maturity Date : 2044-12-08 Maturity Price : 22.92 Evaluated at bid price : 24.35 Bid-YTW : 4.22 % |
| MFC.PR.M | FixedReset | -1.74 % | YTW SCENARIO Maturity Type : Hard Maturity Maturity Date : 2025-01-31 Maturity Price : 25.00 Evaluated at bid price : 24.81 Bid-YTW : 3.95 % |
| MFC.PR.C | Deemed-Retractible | -1.67 % | YTW SCENARIO Maturity Type : Hard Maturity Maturity Date : 2025-01-31 Maturity Price : 25.00 Evaluated at bid price : 22.41 Bid-YTW : 5.89 % |
| BNS.PR.Y | FixedReset | -1.62 % | YTW SCENARIO Maturity Type : Hard Maturity Maturity Date : 2022-01-31 Maturity Price : 25.00 Evaluated at bid price : 23.67 Bid-YTW : 3.44 % |
| IGM.PR.B | Perpetual-Premium | -1.52 % | YTW SCENARIO Maturity Type : Call Maturity Date : 2018-12-31 Maturity Price : 25.00 Evaluated at bid price : 26.00 Bid-YTW : 5.00 % |
| ENB.PF.C | FixedReset | -1.45 % | YTW SCENARIO Maturity Type : Limit Maturity Maturity Date : 2044-12-08 Maturity Price : 22.94 Evaluated at bid price : 24.44 Bid-YTW : 4.19 % |
| SLF.PR.A | Deemed-Retractible | -1.39 % | YTW SCENARIO Maturity Type : Hard Maturity Maturity Date : 2025-01-31 Maturity Price : 25.00 Evaluated at bid price : 24.11 Bid-YTW : 5.20 % |
| GWO.PR.Q | Deemed-Retractible | -1.37 % | YTW SCENARIO Maturity Type : Hard Maturity Maturity Date : 2025-01-31 Maturity Price : 25.00 Evaluated at bid price : 25.15 Bid-YTW : 5.06 % |
| BAM.PR.T | FixedReset | -1.36 % | YTW SCENARIO Maturity Type : Limit Maturity Maturity Date : 2044-12-08 Maturity Price : 23.36 Evaluated at bid price : 24.61 Bid-YTW : 3.88 % |
| SLF.PR.E | Deemed-Retractible | -1.34 % | YTW SCENARIO Maturity Type : Hard Maturity Maturity Date : 2025-01-31 Maturity Price : 25.00 Evaluated at bid price : 22.77 Bid-YTW : 5.66 % |
| ENB.PR.D | FixedReset | -1.33 % | YTW SCENARIO Maturity Type : Limit Maturity Maturity Date : 2044-12-08 Maturity Price : 22.44 Evaluated at bid price : 23.05 Bid-YTW : 4.16 % |
| POW.PR.G | Perpetual-Premium | -1.30 % | YTW SCENARIO Maturity Type : Call Maturity Date : 2021-04-15 Maturity Price : 25.00 Evaluated at bid price : 26.65 Bid-YTW : 4.57 % |
| ENB.PR.H | FixedReset | -1.25 % | YTW SCENARIO Maturity Type : Limit Maturity Maturity Date : 2044-12-08 Maturity Price : 21.36 Evaluated at bid price : 21.36 Bid-YTW : 4.30 % |
| ELF.PR.H | Perpetual-Premium | -1.17 % | YTW SCENARIO Maturity Type : Limit Maturity Maturity Date : 2044-12-08 Maturity Price : 24.83 Evaluated at bid price : 25.30 Bid-YTW : 5.50 % |
| PWF.PR.T | FixedReset | -1.16 % | YTW SCENARIO Maturity Type : Limit Maturity Maturity Date : 2044-12-08 Maturity Price : 23.39 Evaluated at bid price : 25.50 Bid-YTW : 3.71 % |
| SLF.PR.B | Deemed-Retractible | -1.14 % | YTW SCENARIO Maturity Type : Hard Maturity Maturity Date : 2025-01-31 Maturity Price : 25.00 Evaluated at bid price : 24.21 Bid-YTW : 5.20 % |
| PWF.PR.R | Perpetual-Premium | -1.10 % | YTW SCENARIO Maturity Type : Call Maturity Date : 2021-04-30 Maturity Price : 25.00 Evaluated at bid price : 26.06 Bid-YTW : 4.85 % |
| GWO.PR.I | Deemed-Retractible | -1.08 % | YTW SCENARIO Maturity Type : Hard Maturity Maturity Date : 2025-01-31 Maturity Price : 25.00 Evaluated at bid price : 23.00 Bid-YTW : 5.53 % |
| SLF.PR.I | FixedReset | -1.04 % | YTW SCENARIO Maturity Type : Call Maturity Date : 2016-12-31 Maturity Price : 25.00 Evaluated at bid price : 25.78 Bid-YTW : 2.56 % |
| BAM.PF.C | Perpetual-Discount | -1.01 % | YTW SCENARIO Maturity Type : Limit Maturity Maturity Date : 2044-12-08 Maturity Price : 21.27 Evaluated at bid price : 21.56 Bid-YTW : 5.72 % |
| Volume Highlights | |||
| Issue | Index | Shares Traded |
Notes |
| BMO.PR.P | FixedReset | 259,575 | Desjardins crossed 200,000 at 25.32. TD crossed 53,600 at the same price. YTW SCENARIO Maturity Type : Call Maturity Date : 2015-02-25 Maturity Price : 25.00 Evaluated at bid price : 25.30 Bid-YTW : 0.73 % |
| TRP.PR.A | FixedReset | 182,016 | Will reset to 3.266% effective December 31. Nesbitt crossed 30,000 at 21.36. TD crossed 25,000 at the same price and Scotia crossed 30,000 at the same price again. YTW SCENARIO Maturity Type : Limit Maturity Maturity Date : 2044-12-08 Maturity Price : 21.36 Evaluated at bid price : 21.36 Bid-YTW : 3.95 % |
| ENB.PR.T | FixedReset | 102,709 | RBC crossed 50,700 at 23.15 and 21,800 at 23.00. YTW SCENARIO Maturity Type : Limit Maturity Maturity Date : 2044-12-08 Maturity Price : 22.28 Evaluated at bid price : 22.95 Bid-YTW : 4.30 % |
| BAM.PF.F | FixedReset | 87,304 | Desjardins crossed 75,000 at 25.70. YTW SCENARIO Maturity Type : Call Maturity Date : 2019-09-30 Maturity Price : 25.00 Evaluated at bid price : 25.68 Bid-YTW : 4.09 % |
| FTS.PR.M | FixedReset | 73,932 | RBC crossed 70,000 at 25.60. YTW SCENARIO Maturity Type : Call Maturity Date : 2019-12-01 Maturity Price : 25.00 Evaluated at bid price : 25.50 Bid-YTW : 3.69 % |
| MFC.PR.M | FixedReset | 54,843 | Scotia crossed 35,000 at 25.25. YTW SCENARIO Maturity Type : Hard Maturity Maturity Date : 2025-01-31 Maturity Price : 25.00 Evaluated at bid price : 24.81 Bid-YTW : 3.95 % |
| There were 41 other index-included issues trading in excess of 10,000 shares. | |||
| Wide Spread Highlights | ||
| Issue | Index | Quote Data and Yield Notes |
| PWF.PR.A | Floater | Quote: 19.20 – 20.20 Spot Rate : 1.0000 Average : 0.6772 YTW SCENARIO |
| MFC.PR.I | FixedReset | Quote: 25.42 – 25.95 Spot Rate : 0.5300 Average : 0.3221 YTW SCENARIO |
| IGM.PR.B | Perpetual-Premium | Quote: 26.00 – 26.46 Spot Rate : 0.4600 Average : 0.2744 YTW SCENARIO |
| MFC.PR.M | FixedReset | Quote: 24.81 – 25.23 Spot Rate : 0.4200 Average : 0.2506 YTW SCENARIO |
| MFC.PR.F | FixedReset | Quote: 20.75 – 21.20 Spot Rate : 0.4500 Average : 0.2812 YTW SCENARIO |
| MFC.PR.C | Deemed-Retractible | Quote: 22.41 – 23.10 Spot Rate : 0.6900 Average : 0.5286 YTW SCENARIO |