The American jobs machine has produced a spring spurt to banish the winter weakness.
Employers added 280,000 jobs in May, the most in five months, further dispelling fears that a first-quarter slowdown would take hold, figures from the Labor Department showed Friday. That followed a revised 221,000 April advance.
Hourly earnings climbed from a year ago by the most since August 2013, while an increase in the number of people entering the labor force caused the unemployment rate to creep up to 5.5 percent from 5.4 percent
…
The Bloomberg Dollar Spot Index added 0.8 percent, with the greenback rising to 125.64 yen at 4:03 p.m. in New York. The yield on the 10-year Treasury note climbed to 2.40 percent from 2.31 percent late Thursday. The Standard & Poor’s 500 Index fell 0.1 percent at the close.The world’s largest economy shrank at a 0.7 percent annualized rate in the first quarter, according to the Commerce Department’s latest report on gross domestic product.
…
The Labor Department said average hourly earnings increased 0.3 percent in May from the prior month, the biggest gain since January. They were up 2.3 percent from May 2014, exceeding the 2 percent gain on average since the current expansion began six years ago.The agency’s survey of households, used to derive the unemployment figure, showed the participation rate, which indicates the share of working-age people in the labor force, increased to a four-month high of 62.9 percent from 62.8 percent in April.
There were jobs in Canada, too:
The Canadian economy saw a burst in hiring last month as private-sector firms, such as factories, added to head count.
Employers created a stronger-than-expected 58,900 jobs in May, the most in seven months. The country’s jobless rate stayed at 6.8 per cent, Statistics Canada said Friday, as more people entered the labour market in search of work.
…
Average hourly wage growth accelerated to 3.1 per cent, year over year, from less 2 per cent as recently as March, BMO noted – well above the rate of inflation.
…
Productivity was a soft spot for Canada. Labour productivity fell in the first quarter, Statscan said in a separate release, the first drop in a year as output declined for the first time since 2011.
So the US derivatives market incorporated higher expectations of a 2015 hike:
U.S. bond traders had a very clear message for Christine Lagarde on Friday morning: Your advice to the Federal Reserve is wrong.
Lagarde, managing director of the International Monetary Fund, advised the Fed on Thursday to wait until 2016 before hiking interest rates.
Bond traders don’t think the U.S. central bank will heed that recommendation. On Friday, they quickly pulled forward their expectations for a rate increase — assigning better than even odds of a move in September after a jobs report showed American payrolls climbed the most in May in five months. That’s up from a 46 percent probability on Thursday, according to Bloomberg calculations.
Naturally, this caused great excitement among the Fed and its watchers:
The 280,000 rise in payrolls in May suggests that the central bank is making progress toward its goal of maximum employment, William C. Dudley, president of the Federal Reserve Bank of New York, said on Friday. The gains were widespread and were accompanied by a bit higher wages, he added.
“It is likely that conditions will be appropriate to begin monetary policy normalization later this year,” Dudley, who is vice chairman of the central bank’s policy-making Federal Open Market Committee, said in a speech in Minneapolis.
While Dudley hedged his forecast by saying a move wasn’t certain, his assertion was more definitive than comments earlier in the week by some other officials who voiced doubts about the strength of the economy. Fed watchers consider Dudley a confidant of Chair Janet Yellen and thus see his views as more indicative of where the central bank is heading.
Traders of money-market derivatives lifted the chance of the Fed raising rates this year following the jobs data. Futures show a 50 percent chance the Fed will increase interest rates by its October meeting, up from 43 percent Thursday, according to CME Group data.
Yields on 10-year notes climbed 10 basis points to 2.41 percent at 5 p.m. New York time, according to Bloomberg Bond Trader prices. They touched 2.43 percent, the highest since Oct. 6. The low yield for the year was 1.64 percent on Jan. 30.
“It’s sell, sell, sell,” said Thomas Simons, a government-debt economist at Jefferies Group LLC, a primary dealer. “This alleviates a lot of the concern that the economy was not going to bounce back in the second half.”
Matt Levine writes an interesting column on activist investor communication:
If corporate America thinks that activist investors have too much power to affect corporate policies and cause short-term thinking and other bad results, and if the SEC agrees, then it might want to just make it harder and riskier for activists to discuss companies with each other, and to solicit support from other investors. Here’s Phil Goldstein of Bulldog Investors, one of the targets of the SEC’s inquiries:
Scrutiny from the SEC could chill legal discussions between investors, he said, adding that it isn’t surprising that underperforming companies would draw interest from several activists.
“If you go to a Grateful Dead concert, you’re going to find a lot of Grateful Dead fans,” he said. “They’re not a group. They just like the same music.”
Activists make their living by being persuasive, and the less they can talk to other investors, the less opportunity they have to persuade. Cutting down on those opportunities is a little weird for corporate democracy: Shareholders can vote, but they’re afraid to talk to each other about how they’ll vote. But if you worry that activists have too much influence, this is a pretty direct way to fix that.
Meanwhile, the war on banks is having an effect:
Britain’s largest banks are urging the U.K. Treasury to start a formal review of taxes on the industry, amid concern HSBC Holdings Plc and Standard Chartered Plc could move overseas to avoid a levy on balance sheets.
…
A review of taxation could persuade HSBC CEO Stuart Gulliver to keep Europe’s largest bank based in London, after it started a formal evaluation of its domicile in response to a rising U.K. levy and tougher regulation. The tax on balance sheets, imposed after the financial crisis and which applies to banks’ assets globally, cost HSBC 750 million pounds ($1.1 billion) last year, more than any other bank.Standard Chartered, which like HSBC makes most of its earnings in Asia, has said it’s also keeping its London headquarters under review and it’s one of the first issues shareholders have said they want new CEO Bill Winters to examine after he starts next week.
Matt Levine has a nice column on communication between activist investors:
If corporate America thinks that activist investors have too much power to affect corporate policies and cause short-term thinking and other bad results, and if the SEC agrees, then it might want to just make it harder and riskier for activists to discuss companies with each other, and to solicit support from other investors. Here’s Phil Goldstein of Bulldog Investors, one of the targets of the SEC’s inquiries:
Scrutiny from the SEC could chill legal discussions between investors, he said, adding that it isn’t surprising that underperforming companies would draw interest from several activists.
“If you go to a Grateful Dead concert, you’re going to find a lot of Grateful Dead fans,” he said. “They’re not a group. They just like the same music.”
Activists make their living by being persuasive, and the less they can talk to other investors, the less opportunity they have to persuade. Cutting down on those opportunities is a little weird for corporate democracy: Shareholders can vote, but they’re afraid to talk to each other about how they’ll vote. But if you worry that activists have too much influence, this is a pretty direct way to fix that.
TransCanada Corporation, proud issuer of TRP.PR.A, TRP.PR.B, TRP.PR.C, TRP.PR.D, TRP.PR.E, TRP.PR.F and TRP.PR.G, was confirmed at Pfd-2(low) by DBRS:
DBRS Limited (DBRS) has today confirmed the ratings of TransCanada Corporation (TCC or the Company) and its wholly owned subsidiary, TransCanada PipeLines Limited (TCPL), both with Stable trends. The preferred share rating of TCC, which owns 100% of TCPL and holds no other material assets, is based on the strength of TCPL and the expectation that no debt will be issued at TCC. The ratings primarily reflect (1) expected improvement in TCC’s overall business risk profile over the medium term, (2) potential medium-term pressure on its credit metrics and (3) environmental, regulatory and political risks with respect to its natural gas and liquids pipelines segments.
It was a mixed day for the Canadian preferred share market, with PerpetualDiscounts down 27bp, FixedResets gaining 12bp and DeemedRetractibles off 16bp. TRP FixedResets are notable winners on the Performance Highlights table. Volume was very low.
For as long as the FixedReset market is so violently unsettled, I’ll keep publishing updates of the more interesting and meaningful series of FixedResets’ Implied Volatilities. This doesn’t include Enbridge because although Enbridge has a large number of issues outstanding, all of which are quite liquid, the range of Issue Reset Spreads is too small for decent conclusions. The low is 212bp (ENB.PR.H; second-lowest is ENB.PR.D at 237bp) and the high is a mere 268 for ENB.PF.G.
Remember that all rich /cheap assessments are:
» based on Implied Volatility Theory only
» are relative only to other FixedResets from the same issuer
» assume constant GOC-5 yield
» assume constant Implied Volatility
» assume constant spread
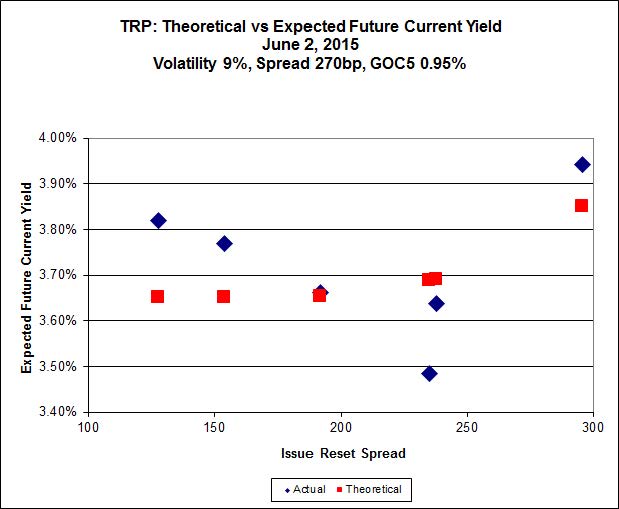
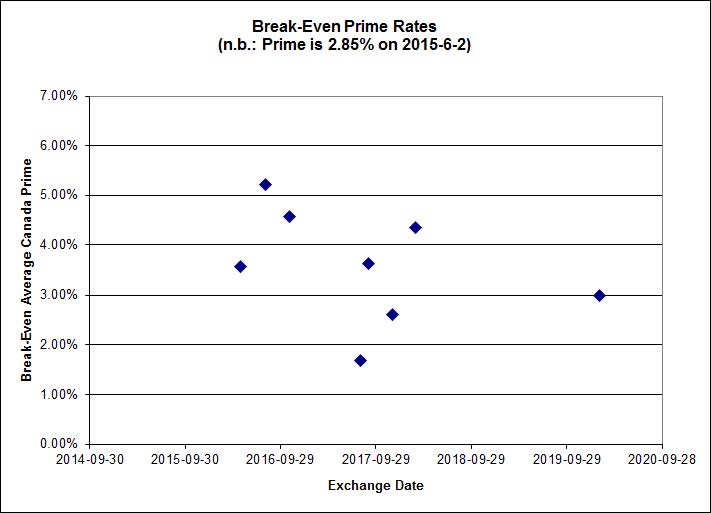
Here’s TRP:

Click for Big
TRP.PR.E, which resets 2019-10-30 at +235, is bid at 23.70 to be $1.28 rich, while TRP.PR.G, which resets 2020-11-30 at +296, is $0.60 cheap at its bid price of 24.77.

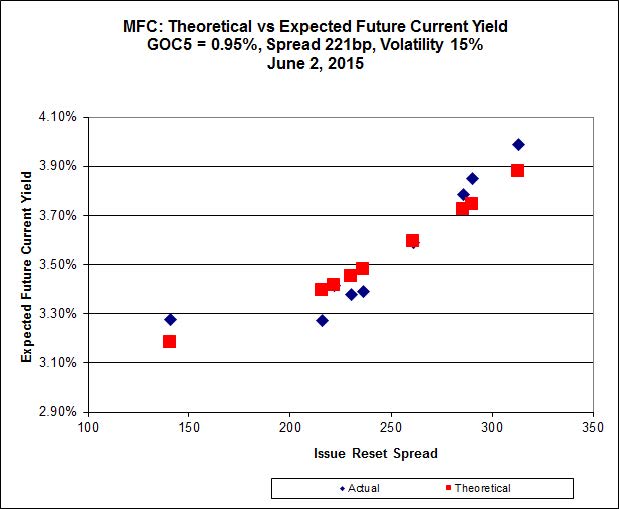
Click for Big
Another excellent fit, but the numbers are perplexing. Implied Volatility for MFC continues to be a conundrum. It is still too high if we consider that NVCC rules will never apply to these issues; it is still too low if we consider them to be NVCC non-compliant issues (and therefore with Deemed Maturities in the call schedule). It is clear that the lowest spread issue, MFC.PR.F, is well off the relationship defined by the other issues, but this doesn’t resolve the conundrum – it just makes it more conundrous.
Most expensive is MFC.PR.L, resetting at +216 on 2019-6-19, bid at 23.75 to be $0.84 rich, while MFC.PR.G, resetting at +290bp on 2016-12-19, is bid at 25.08 to be $0.60 cheap.

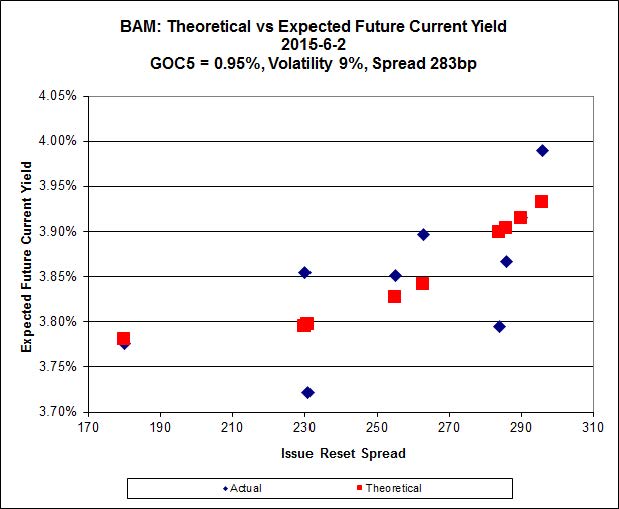
Click for Big
The cheapest issue relative to its peers is BAM.PF.B, resetting at +263bp on 2019-3-31, bid at 22.86 to be $0.46 cheap. BAM.PF.G, resetting at +284bp 2020-6-30 is bid at 24.94 and appears to be $0.53 rich.

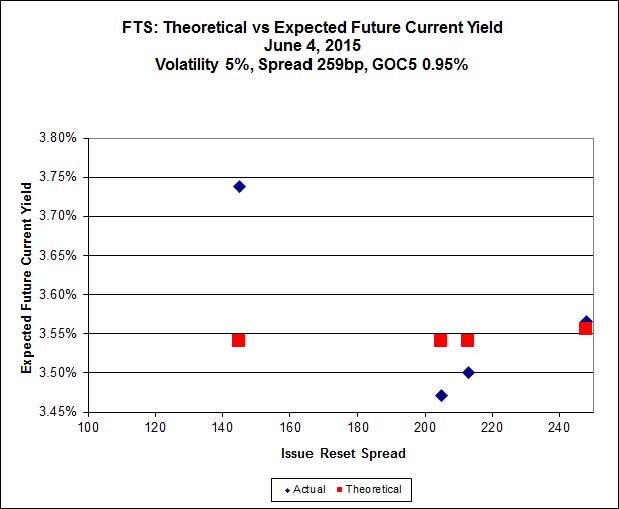
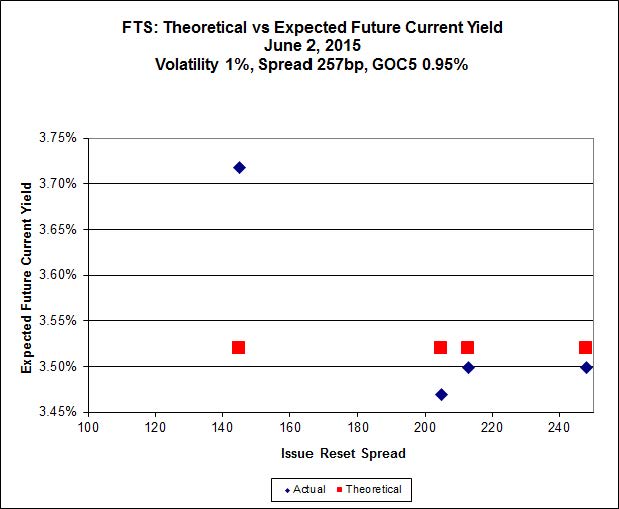
Click for Big
FTS.PR.H, with a spread of +145bp, and bid at 16.07, looks $0.96 cheap and resets 2020-6-1. FTS.PR.K, with a spread of +205bp and resetting 2019-3-1, is bid at 21.65 and is $0.50 rich.

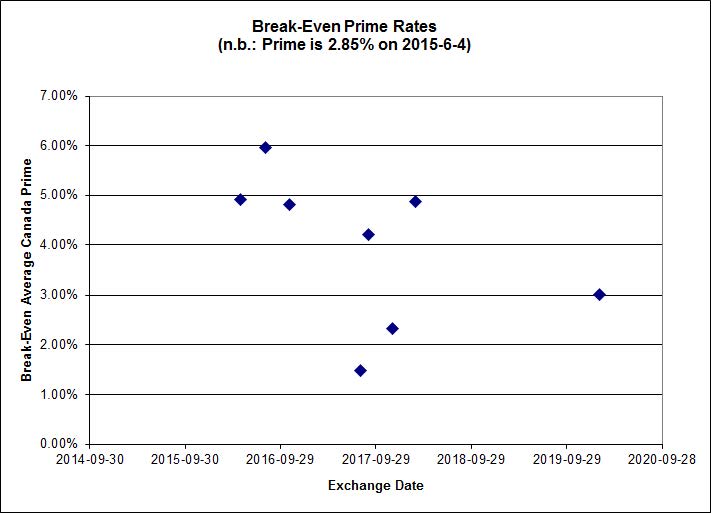
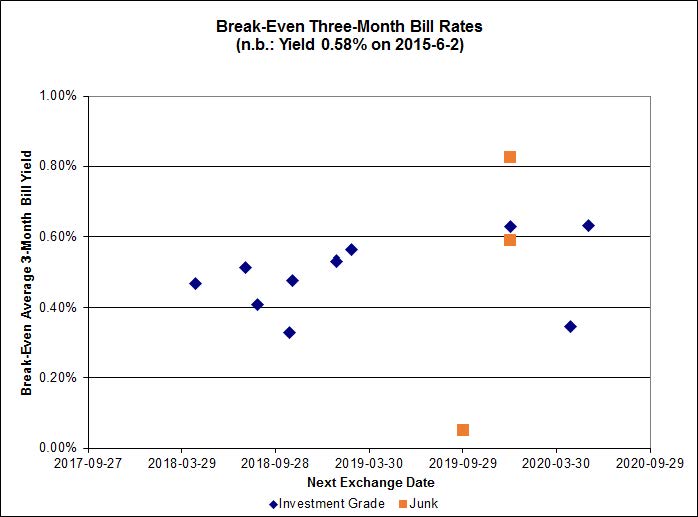
Click for Big
Investment-grade pairs predict an average three-month bill yield over the next five-odd years of about 0.50%, including FTS.PR.H / FTS.PR.I at 1.00%. On the junk side, four pairs are outside the range of the graph: FFH.PR.E / FFH.PR.F at -1.03%; AIM.PR.A / AIM.PR.B at -0.35%; BRF.PR.A / BRF.PR.B at -0.80%; and DC.PR.B / DC.PR.D at -1.64%.

Click for Big
Shall we just say that this exhibits a high level of confidence in the continued rapacity of Canadian banks?
| HIMIPref™ Preferred Indices These values reflect the December 2008 revision of the HIMIPref™ Indices Values are provisional and are finalized monthly |
|||||||
| Index | Mean Current Yield (at bid) |
Median YTW |
Median Average Trading Value |
Median Mod Dur (YTW) |
Issues | Day’s Perf. | Index Value |
| Ratchet | 0.00 % | 0.00 % | 0 | 0.00 | 0 | 1.7377 % | 2,192.3 |
| FixedFloater | 0.00 % | 0.00 % | 0 | 0.00 | 0 | 1.7377 % | 3,833.2 |
| Floater | 3.50 % | 3.55 % | 62,857 | 18.33 | 3 | 1.7377 % | 2,330.6 |
| OpRet | 4.45 % | -10.96 % | 27,597 | 0.08 | 2 | -0.1185 % | 2,779.7 |
| SplitShare | 4.59 % | 4.78 % | 71,422 | 3.32 | 3 | -0.0670 % | 3,245.4 |
| Interest-Bearing | 0.00 % | 0.00 % | 0 | 0.00 | 0 | -0.1185 % | 2,541.7 |
| Perpetual-Premium | 5.45 % | 4.22 % | 64,066 | 0.40 | 19 | 0.0539 % | 2,517.0 |
| Perpetual-Discount | 5.07 % | 5.05 % | 115,119 | 15.38 | 15 | -0.2747 % | 2,762.2 |
| FixedReset | 4.45 % | 3.74 % | 263,166 | 16.65 | 87 | 0.1163 % | 2,382.2 |
| Deemed-Retractible | 4.99 % | 3.32 % | 110,127 | 0.71 | 34 | -0.1556 % | 2,628.4 |
| FloatingReset | 2.48 % | 2.85 % | 55,433 | 6.15 | 9 | -0.1962 % | 2,337.7 |
| Performance Highlights | |||
| Issue | Index | Change | Notes |
| SLF.PR.G | FixedReset | -2.36 % | YTW SCENARIO Maturity Type : Hard Maturity Maturity Date : 2025-01-31 Maturity Price : 25.00 Evaluated at bid price : 16.12 Bid-YTW : 7.58 % |
| FTS.PR.I | FloatingReset | -2.02 % | YTW SCENARIO Maturity Type : Limit Maturity Maturity Date : 2045-06-05 Maturity Price : 16.02 Evaluated at bid price : 16.02 Bid-YTW : 3.18 % |
| GWO.PR.N | FixedReset | -1.43 % | YTW SCENARIO Maturity Type : Hard Maturity Maturity Date : 2025-01-31 Maturity Price : 25.00 Evaluated at bid price : 17.20 Bid-YTW : 6.77 % |
| BNS.PR.Y | FixedReset | -1.15 % | YTW SCENARIO Maturity Type : Hard Maturity Maturity Date : 2022-01-31 Maturity Price : 25.00 Evaluated at bid price : 23.11 Bid-YTW : 3.14 % |
| MFC.PR.F | FixedReset | 1.12 % | YTW SCENARIO Maturity Type : Hard Maturity Maturity Date : 2025-01-31 Maturity Price : 25.00 Evaluated at bid price : 18.10 Bid-YTW : 6.41 % |
| MFC.PR.H | FixedReset | 1.18 % | YTW SCENARIO Maturity Type : Call Maturity Date : 2017-03-19 Maturity Price : 25.00 Evaluated at bid price : 25.80 Bid-YTW : 2.66 % |
| TD.PF.B | FixedReset | 1.19 % | YTW SCENARIO Maturity Type : Limit Maturity Maturity Date : 2045-06-05 Maturity Price : 22.73 Evaluated at bid price : 23.75 Bid-YTW : 3.44 % |
| TRP.PR.A | FixedReset | 1.29 % | YTW SCENARIO Maturity Type : Limit Maturity Maturity Date : 2045-06-05 Maturity Price : 19.60 Evaluated at bid price : 19.60 Bid-YTW : 3.74 % |
| TD.PF.C | FixedReset | 1.51 % | YTW SCENARIO Maturity Type : Limit Maturity Maturity Date : 2045-06-05 Maturity Price : 22.56 Evaluated at bid price : 23.50 Bid-YTW : 3.47 % |
| TRP.PR.C | FixedReset | 1.52 % | YTW SCENARIO Maturity Type : Limit Maturity Maturity Date : 2045-06-05 Maturity Price : 16.75 Evaluated at bid price : 16.75 Bid-YTW : 3.78 % |
| BAM.PR.C | Floater | 1.79 % | YTW SCENARIO Maturity Type : Limit Maturity Maturity Date : 2045-06-05 Maturity Price : 14.20 Evaluated at bid price : 14.20 Bid-YTW : 3.55 % |
| TRP.PR.B | FixedReset | 1.92 % | YTW SCENARIO Maturity Type : Limit Maturity Maturity Date : 2045-06-05 Maturity Price : 14.88 Evaluated at bid price : 14.88 Bid-YTW : 3.69 % |
| BAM.PR.B | Floater | 2.77 % | YTW SCENARIO Maturity Type : Limit Maturity Maturity Date : 2045-06-05 Maturity Price : 14.49 Evaluated at bid price : 14.49 Bid-YTW : 3.48 % |
| Volume Highlights | |||
| Issue | Index | Shares Traded |
Notes |
| RY.PR.N | Perpetual-Discount | 497,115 | New issue settled today. YTW SCENARIO Maturity Type : Limit Maturity Maturity Date : 2045-06-05 Maturity Price : 24.37 Evaluated at bid price : 24.75 Bid-YTW : 4.96 % |
| BMO.PR.Y | FixedReset | 472,715 | New issue settled today. YTW SCENARIO Maturity Type : Limit Maturity Maturity Date : 2045-06-05 Maturity Price : 23.02 Evaluated at bid price : 24.65 Bid-YTW : 3.61 % |
| ENB.PR.D | FixedReset | 320,984 | Desjardins crossed 312,700 at 18.55. YTW SCENARIO Maturity Type : Limit Maturity Maturity Date : 2045-06-05 Maturity Price : 18.41 Evaluated at bid price : 18.41 Bid-YTW : 4.62 % |
| ENB.PF.C | FixedReset | 307,450 | Desjardins crossed 300,000 at 20.55. YTW SCENARIO Maturity Type : Limit Maturity Maturity Date : 2045-06-05 Maturity Price : 20.41 Evaluated at bid price : 20.41 Bid-YTW : 4.64 % |
| BNS.PR.L | Deemed-Retractible | 110,300 | TD crossed two blocks of 50,000 each, both at 25.40. YTW SCENARIO Maturity Type : Call Maturity Date : 2016-04-27 Maturity Price : 25.00 Evaluated at bid price : 25.37 Bid-YTW : 3.32 % |
| PWF.PR.T | FixedReset | 100,206 | Nesbitt crossed 100,000 at 25.30. YTW SCENARIO Maturity Type : Limit Maturity Maturity Date : 2045-06-05 Maturity Price : 23.34 Evaluated at bid price : 25.15 Bid-YTW : 3.32 % |
| There were 17 other index-included issues trading in excess of 10,000 shares. | |||
| Wide Spread Highlights | ||
| Issue | Index | Quote Data and Yield Notes |
| TRP.PR.C | FixedReset | Quote: 16.75 – 17.50 Spot Rate : 0.7500 Average : 0.5029 YTW SCENARIO |
| TRP.PR.B | FixedReset | Quote: 14.88 – 15.38 Spot Rate : 0.5000 Average : 0.3598 YTW SCENARIO |
| CU.PR.G | Perpetual-Discount | Quote: 22.51 – 22.94 Spot Rate : 0.4300 Average : 0.3119 YTW SCENARIO |
| PVS.PR.C | SplitShare | Quote: 25.05 – 25.40 Spot Rate : 0.3500 Average : 0.2478 YTW SCENARIO |
| GWO.PR.H | Deemed-Retractible | Quote: 24.10 – 24.34 Spot Rate : 0.2400 Average : 0.1550 YTW SCENARIO |
| ENB.PR.F | FixedReset | Quote: 18.91 – 19.15 Spot Rate : 0.2400 Average : 0.1614 YTW SCENARIO |