Malachite Aggressive Preferred Fund’s Net Asset Value per Unit as of the close January 29, 2021, was $8.7395.
Six issues held at month-end returned less than 0% over the month: IFC.PR.A, IFC.PR.C, FTN.PR.A, CF.PR.C, BMO.PR.Y and SLF.PR.E, with a total weight in the portfolio (at month-end) of 11.7%. Star performers were PPL.PR.E, PPL.PR.O, INE.PR.A, TA.PR.D, AZP.PR.B, BPO.PR.R and BPO.PR.N, all returning in excess of 10% with a total month-end portfolio weight of 5.2%.
Quote quality remained fair this month, with the difference in portfolio values when calculated with closing prices vs. calculation with bid prices decreasing from 0.67% to 0.52%.
| Returns to January 29, 2021 | ||||
| Period | MAPF | TXPR* Total Return |
CPD – according to Blackrock | |
| One Month | +4.11% | +2.56% | N/A | |
| Three Months | +20.77% | +10.48% | N/A | |
| One Year | +15.40% | +8.82% | +8.13% | |
| Two Years (annualized) | +7.76% | +6.41% | N/A | |
| Three Years (annualized) | -0.77% | +0.70% | +0.08% | |
| Four Years (annualized) | +4.18% | +3.17% | N/A | |
| Five Years (annualized) | +9.90% | +7.07% | +6.50% | |
| Six Years (annualized) | +3.02% | +1.97% | N/A | |
| Seven Years (annualized) | +3.27% | +1.83% | N/A | |
| Eight Years (annualized) | +2.39% | +1.29% | N/A | |
| Nine Years (annualized) | +2.89% | +1.63% | N/A | |
| Ten Years (annualized) | +3.06% | +2.12% | +1.63% | |
| Eleven Years (annualized) | +4.32% | +2.73% | ||
| Twelve Years (annualized) | +7.72% | +4.25% | ||
| Thirteen Years (annualized) | +7.50% | +2.71% | ||
| Fourteen Years (annualized) | +6.99% | |||
| Fifteen Years (annualized) | +6.90% | |||
| Sixteen Years (annualized) | +6.82% | |||
| Seventeen Years (annualized) | +7.10% | |||
| Eighteen Years (annualized) | +8.13% | |||
| Nineteen Years (annualized) | +7.84% | |||
| MAPF returns assume reinvestment of distributions, and are shown after expenses but before fees. | ||||
| The BMO Capital Markets “50” Preferred Share Index is no longer being calculated. The final performance report incorporating this venerable index was published as of December, 2020. | ||||
| “TXPR” is the S&P/TSX Preferred Share Index. It is calculated without accounting for fees, but does assume reinvestment of dividends. | ||||
| CPD Returns are for the NAV and are after all fees and expenses. Reinvestment of dividends is assumed. | ||||
| Figures for National Bank Preferred Equity Income Fund (formerly Omega Preferred Equity) (which are after all fees and expenses) for 1-, 3- and 12-months are +3.23%, +12.55% and +10.31%, respectively, according to Globe & Mail / Fundata after all fees & expenses. Three year performance is +1.46%; five year is +6.97%; ten year is +2.78%
Figures from Morningstar are no longer conveniently available. |
||||
| Manulife Preferred Income Class Adv has been terminated by Manulife. The performance of this fund was last reported here in March, 2018. | ||||
| Figures for Horizons Active Preferred Share ETF (HPR) (which are after all fees and expenses) for 1-, 3- and 12-months are +3.16%, +13.48% & +9.76%, respectively. Three year performance is -0.41%, five-year is +6.77% | ||||
| Figures for National Bank Preferred Equity Fund (formerly Altamira Preferred Equity Fund) are +3.15%, +13.66% and +10.18% for one-, three- and twelve months, respectively. Three year performance is -0.21%; five-year is +6.99%.
Acccording to the fund’s fact sheet as of June 30, 2016, the fund’s inception date was October 30, 2015. I do not know how they justify this nonsensical statement, but will assume that prior performance is being suppressed in some perfectly legal manner that somebody at National considers ethical. The last time Altamira Preferred Equity Fund’s performance was reported here was April, 2014; performance under the National Bank banner was first reported here May, 2014. |
||||
| The figures for the NAV of BMO S&P/TSX Laddered Preferred Share Index ETF (ZPR) is +9.93% for the past twelve months. Two year performance is +5.95%, three year is -0.23%, five year is +7.50%. | ||||
| Figures for Fiera Canadian Preferred Share Class Cg Series F, (formerly Natixis Canadian Preferred Share Class Series F) (formerly NexGen Canadian Preferred Share Tax Managed Fund) are no longer available as the Fund is now the property of Canoe Financial. The last reported performance for the merged fund was May 2020. | ||||
| Figures for BMO Preferred Share Fund (advisor series) according to BMO are +2.48%, +10.35% and +8.76% for the past one-, three- and twelve-months, respectively. Two year performance is +4.37%; three year is -2.01%; five-year is +4.18%. | ||||
| Figures for PowerShares Canadian Preferred Share Index Class, Series F (PPS) are +8.40% for the past twelve months. The three-year figure is -0.59%; five years is +7.11% | ||||
| Figures for the First Asset Preferred Share Investment Trust (PSF.UN) are no longer available since the fund has merged with First Asset Preferred Share ETF (FPR).
Performance for the fund was last reported here in September, 2016; the first report of unavailability was in October, 2016. |
||||
| Figures for Lysander-Slater Preferred Share Dividend Fund (Class F) according to the company are +3.90%, +15.39% and +3.66% for the past one, three and twelve months, respectively. Three year performance is -2.61%, five-year is +4.10%. | ||||
| Figures for the Desjardins Canadian Preferred Share Fund A Class (A Class), as reported by the company are +2.62%, +10.44% and +7.79% for the past one, three and twelve months, respectively. Two year performance is +4.38%, three-year is -1.37% | ||||
| Figures for the RBC Canadian Preferred Share ETF (RPF) as reported by Morningstar are +3.43%, +13.59% and +10.01% for the past one, three and twelve months, respectively. Three-year performance is -0.87% | ||||
MAPF returns assume reinvestment of dividends, and are shown after expenses but before fees. Past performance is not a guarantee of future performance. You can lose money investing in Malachite Aggressive Preferred Fund or any other fund. For more information, see the fund’s main page. The fund is available directly from Hymas Investment Management.
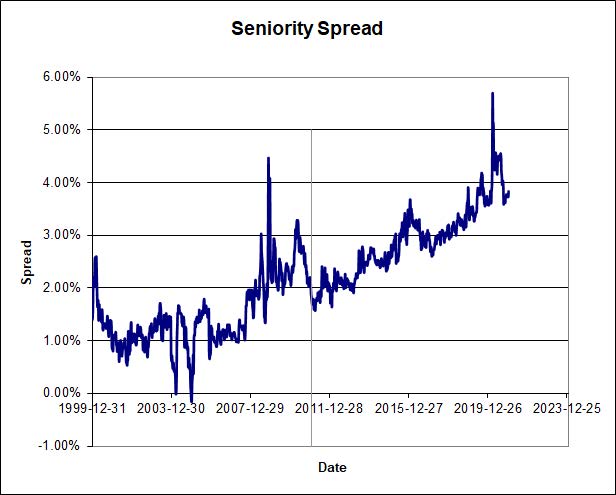
The preferred share market continues to be underpriced relative to other capital markets, leaving a lot of room for outsized gains. The Seniority Spread (the interest-equivalent yield on reasonably liquid, investment-grade PerpetualDiscounts less the yield on long term corporate bonds) is extremely elevated (chart end-date 2021-1-8):
Click for Big
Note that the Seniority Spread was recorded at 355bp just after month-end, significantly narrower than the 375bp just before year-end. As a good practical example of the spreads between markets, consider that CIU issued a long-term bond in early September, 2019 yielding 2.963%, about 411bp cheaper than the interest-equivalent figure of 7.07% for CIU.PR.A, which was then yielding about 5.44% as a dividend. CIU issued another bond in late September, 2020, yielding 2.609%, which was 399bp cheaper than the interest-equivalent figure of 6.60% for CIU.
… and the relationship between five-year Canada yields and yields on investment-grade FixedResets is still deep in ‘decoupled panic’ territory (chart end-date 2021-1-8):

Click for Big
In addition, I feel that the yield on five-year Canadas is unsustainably low (it should be the inflation rate plus an increment of … 1%? 1.5%? 2.0%?),and a return to sustainable levels is likely over the medium term.
It seems clear that many market players are, wittingly or not, using FixedResets to speculate on future moves in the Canada 5-Year yield. This is excellent news for those who take market action based on fundamentals and the long term characteristics of the market because nobody can consistently time the markets. The speculators will, over the long run and in aggregate, lose money, handing it over to more sober investors.
In this connection, it is useful to review some recent commentary regarding the preferred share market. Rob Carrick recently published a column with the title Rob Carrick: Does it make sense to use preferred shares as a bond substitute?, in which he gave a nod to the old shibboleth:
But does it truly make sense to substitute prefs for bonds? Not if you subscribe to the idea that the main point of bonds is not to generate income and returns, but rather to act as a portfolio life preserver when the stock market turns ugly.
… but then noted the crucial point:
Perpetuals are somewhat less touchy, but they’re not to be counted on in a stock market crash.
This distinction is meaningless to investors who are all about income and fine with portfolios that bounce around in price.
As I never get tired of repeating, Fixed Income portfolio management is a process that largely consists of balancing Security of Income vs. Security of Principal. These are opposing forces; the more you have of one, the less you’ll have of the other. And preferred shares are way, way over to the “security of income” pole. So in bad times … Shut up and Clip Your Coupons!
Financial Wisdom Forum’s long-running thread on preferred shares recently featured a series of posts which often deprecated preferred shares with some participants advocating market timing:
The thing about prefs is that timing is everything. You buy them when they’re being thrown out with the bathwater and you’ll be golden.
…
Yes, there’s money to be made, but only if the shares are in the order of a 30% discount.
…
If you care about total return, preferred shares probably aren’t for you, (unless of course you are interested in trading them or you have a crystal ball regarding interest rates).If you want something that pays a decent, tax efficient dividend, in a non-registered account, and share price isn’t important, then straight perpetual preferred shares are probably fine (caveat for a few years with respect to NVCC – will no longer qualify as Tier 1 Capital post 2022). Suitable for the retired. Anything else – not so much. They all seem to favour the issuer.
…
Sure the market value is volatile but I don’t plan on selling so it doesn’t matter to me, barring default.
The part I’d like to focus on is:
Yes, there’s money to be made, but only if the shares are in the order of a 30% discount.
This is close – but not quite – to stating an essential point about Fixed Income investing: total returns are asymmetrical: you can lose a lot more than you can win. This is why credit quality is so important – a bankruptcy, or even a mere impairment, is going to take you a long way down the ‘bad side’ of the asymmetrical probability curve. But another point, often ignored, is that this implies that discounted issues are, all else being equal, better investments than premium issues: in good times, discounted issues can win a lot more than premium issues, which are tethered to their par value due to considerations of maturity or possible redemption. In bad times, they’ll lose a little more, since discounted issues have no ‘buffer’ to insulate them, while premium issues (and, to a lesser extent, issues trading modestly below par) have such a buffer that absorbs a portion of the shock – this is easier to understand in terms option values and volatility theory, as the negative value of the embedded option is reduced as the issue moves further away from par.
The implication for MAPF is that there is a bias towards holding issues trading well away from par value, which almost always means discounted issues. It’s only a bias, not a hard and fast rule, but this bias was deliberately built into the system in order to reduce the asymmetry of the projected returns curve. This means that MAPF will usually hold a portfolio more heavily weighted towards low coupon – low priced issues than the index and be correspondingly underweighted in high coupon – high priced instruments.
This in turn has the effect of introducing a bias in returns: MAPF will often underperform in poor markets (as it holds fewer of the better performing high-coupon issues than the index) and outperform in good markets (as it holds fewer of the worse performing high-coupon issues than the index). This is only a tendency, not an iron-clad rule, but the effect is there and it means that MAPF has a higher Beta than it might otherwise have, if you enjoy thinking in terms of investment models from the last century. And at all times, of course, the fund seeks to trade and exploit market inefficiencies, which mitigates but does not eliminate the effect.
On another FWF forum, there has been speculation that the fine performance of FixedResets since March, 2020, has been due to a conscious focus on spreads:
ZPR was up approximately 6% for 2020. Is this a reversal of the trend to follow interest rates downward? Perhaps investors will focus on the spread between preferred versus bond yields going forward rather than an irrational rush to the exits whenever prefs are resetting at lower rates.
[reply] It’s already happening. That’s why ZPR has finally had a positive year in a declining rate environment.
Well, this is something I would like to agree with. I’ve been pounding the ‘spreads’ drum for a long time…
Unfortunately, while one can only rarely point to a single mechanism explaining a change in relative prices and say, with any credibility whatsoever, that A caused B, I have to admit I’m more dubious than usual about this claim. I believe that the continued rally is due to continued interest rate anticipation, which is now (for some investors) considered to be on the way up rather than continuing the downward staggering of the past ten years; this in turn is derived from Central Bank ‘easy money’ policies and very loose government fiscal policies; which is considered to be on the verge of driving inflation upwards.
Who’s right? Well, we’ll know in ten years, at a time when half of the investing world will graciously explain at length how their uncanny ability to read global market forces allowed them to time the market and make enormous profits, while the other half will tell you the question is irrelevant because investing is about the future, not the past. My advice is, as always, to make asset allocation decisions based on the long-term characteristics of each asset class and how these characteristics interact with your long-term portfolio objectives.
It should be noted that I have been unable to provide an entirely satisfactory explanation for the relatively strong performance of Floor issues during the 2018-19 downdraft relative to their non-Floor counterparts. See the discussions on PrefBlog at LINK, LINK and LINK.
I believe the bear-market outperformance by the Floor issues is a behavioural phenomenon with very little basis in fundamentals. When interest rates in general move, FixedReset prices should not change much (to a first approximation, for issues priced near par), since in Fixed Income investing it is spreads that are important, not absolute yields. There should be some effect on Floor issues, which should move up slightly in price as yields go down since the ‘option’ to receive the floor rate will become more valuable. Adjustments due to this effect should be fairly small, however – and over the past year issues with a floor, that started the period being expensive, have simply gotten even more expensive, relative to their non-floored counterparts.
And the tricky thing about behavioural models of investing is that they can lose their explanatory power very quickly when an investment fashion shifts, whereas fundamentals will always be effective – sometimes it just takes a little time! Just to give an example from the preferred share market – until the end of 2014, FixedResets were priced relative to each other according to their initial dividend; when the reset of TRP.PR.A shocked a lot of investors, relative pricing became much more dependent upon the Issue Reset Spread, a much more logical and fundamental property. This paradigm shift was discussed extensively in PrefLetter.
FixedReset (Discount) performance on the month was +3.16% vs. PerpetualDiscounts of +0.45% in January; the two classes finally decoupled in mid-November, 2018, after months of moving in lockstep:
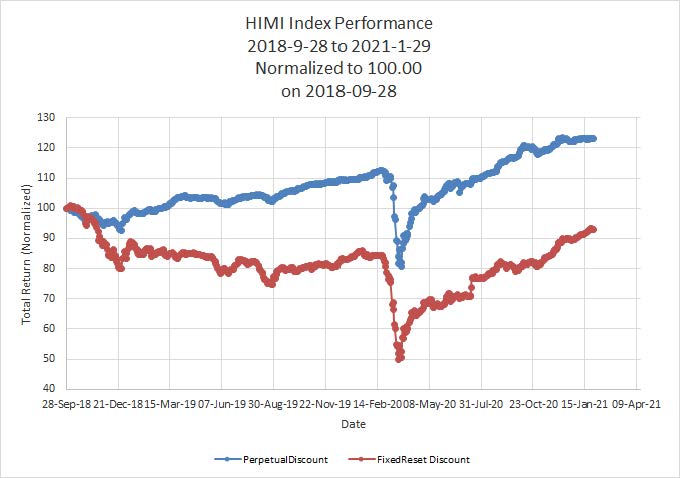
Click for Big
Floaters performed well, returning +6.80% for December but the past twelve months is still negative at -2.20%. Look at the long-term performance:
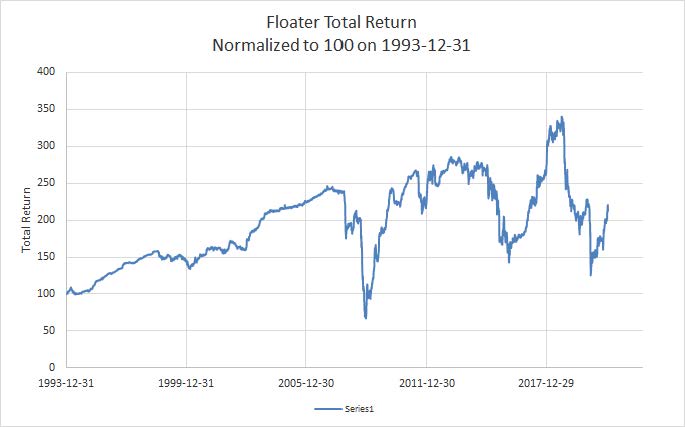
Click for Big
Some Assiduous Readers will be interested to observe that the ‘Quantitative Easing’ decline was not initially as bad as the ‘Credit Crunch’ decline, which took the sector down to the point where the 15-year cumulative total return was negative. I wrote about that at the time. but it became worse in August, 2019! On August 30, 2019 the HIMI Floater Index (total return) value was calculated as 1906.6; the index first surpassed this value on 2003-8-13. Thus, cumulative total return (that is, including dividends) was negative over a period of slightly-over sixteen years. Worse, on March 31, 2020, the index level was 1454.8, a milestone first passed on 1997-7-30; a cumulative negative total return for 22 years and 8 months; at its low on March 18 the index level was 1253.7, first surpassed on 1996-1-4, a span of 24 years and over two months!
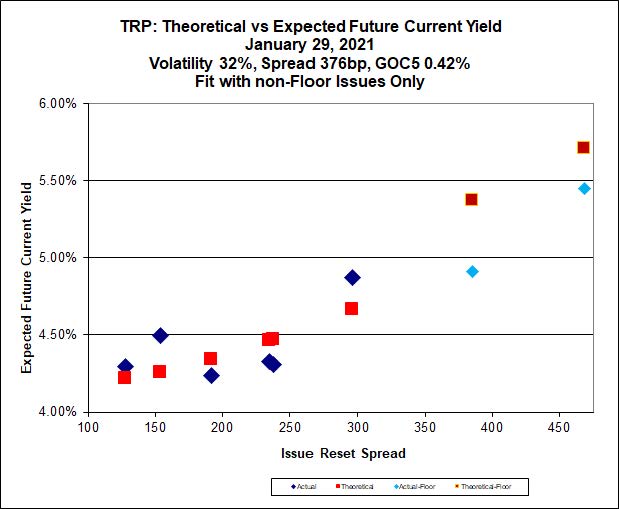
It seems clear that Floaters are used, wittingly or otherwise, as a vehicle for speculation on the policy rate and Canada Prime, while FixedResets are being used as a vehicle for speculation on the five-year Canada rate. In support of this idea, I present an Implied Volatility analysis of the TRP series of FixedResets as of November 30, which is comprised of six issues without a Minimum Rate Guarantee and two issues which do have this feature:
Click for Big
The two issues with floors, TRP.PR.J (+469, minimum 5.50%) and TRP.PR.K (+385, minimum 4.90%) are $1.17 and $2.13 rich, respectively. These figures are much narrower than the 2.38 and 3.08 calculated with last month’s figures. The floors have become effective since five-year Canadas dipped below 0.81% and 1.05%, respectively.
It will also be noted that the spread of a notional non-callable TRP FixedReset priced at par has narrowed from 401bp last month to 376bp this month, while GOC-5 has remained constant at 0.42%.
I also show results for the BAM series of FixedResets, which includes three issues with dividend floors: BAM.PF.H (+417, Minimum 5.00%); BAM.PF.I (+386, Minimum 4.80%); and BAM.PF.J (+310, Minimum 4.75%); surprisingly, these issues show mixed results compared to their non-floor siblings, being cheap 2.09, cheap 1.79, and cheap 1.74 respectively, respectively, very different from last month’s figures of cheap 0.28, rich 0.09 and cheap 0.59. I note that it is normal for premium issues in a rising market to be cheap, since investors have an expectation for continued rising prices (and therefore an ‘automatic’ redemption), without considering the possibility of a market reversal, in which case the higher spreads will prove to be very useful.
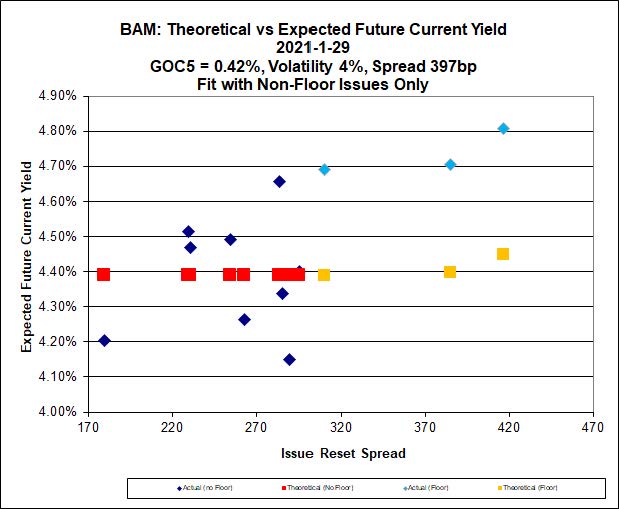
Click for Big
It will also be noted that the spread of a notional non-callable BAM FixedReset priced at par has narrowed significantly over the month; 416bp last month to 397bp this month, while GOC-5 has remained constant at 0.42%.
*****
Relative performance during the month was correlated (12%) with Issue Reset Spreads for the “Pfd-2 Group” but uncorrelated for the “Pfd-3 Group” issues:
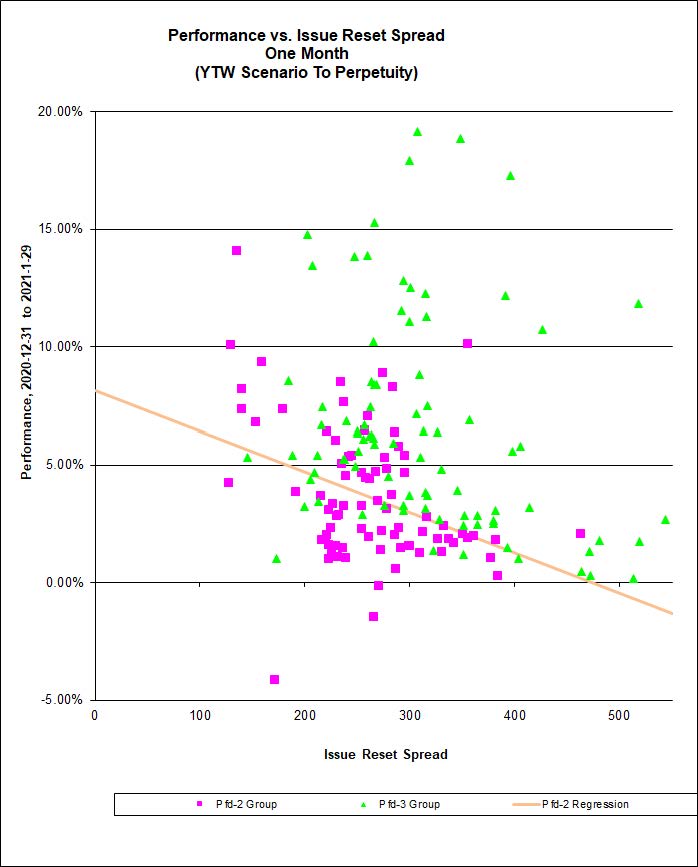
Click for Big
… with Pfd-2 Group correlation for the three-month period of 48%, negligible for Pfd-3:
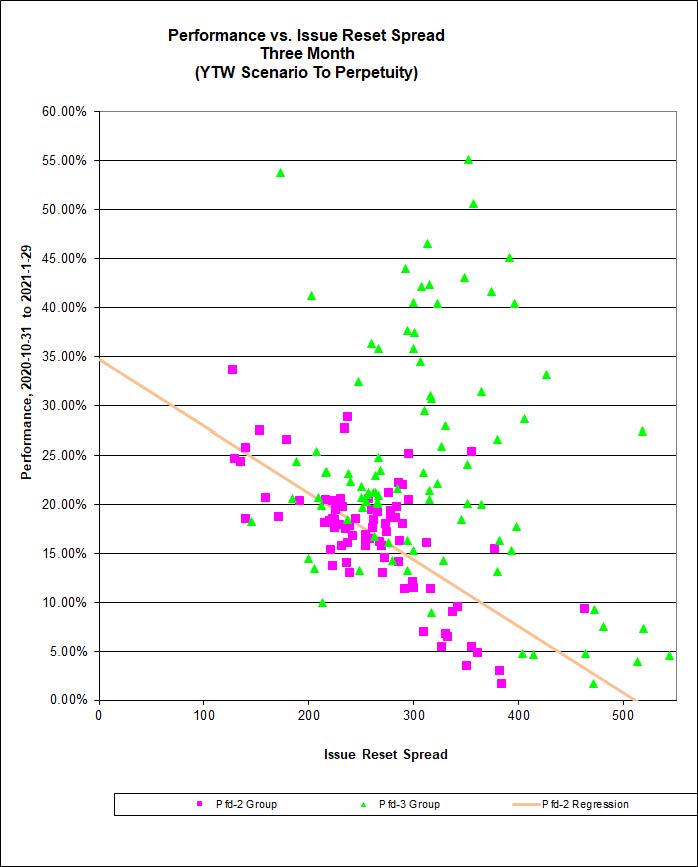
Click for Big
This suggests to me that November commenced an actual theme, one based on an expectation of higher government interest rates in the future (perhaps due to renewed hopes that the introduction of coronavirus vaccines will return things to normal) and that this theme has continued through January, finally replacing the uncorrelated messes we’ve seen through much of the market’s recovery since the end of March, 2020.
As for the future, of course, it’s one thing to say that ‘spreads are unsustainable and so are government yields’ and it’s quite another to forecast just how and when a more economically sustainable environment will take effect. It could be years. The same caution applies for an end to the overpricing of issues with a minimum rate guarantee.
Yields on preferred shares of all stripes are high compared to those available from other investments of similar quality. As I told John Heinzl in an eMail interview in late November, 2018, the best advice I can offer investors remains Shut up and clip your coupons!
I think that a broad, sustainable rally in FixedResets will require higher five-year Canada yields (or a widespread expectation of them), since paradigm shifts generally require a trigger (a Wile E. Coyote moment, as they say!) … and although I’m sure this will happen eventually, it would be foolish to speculate on just when it will happen.
| Calculation of MAPF Sustainable Income Per Unit | ||||||
| Month | NAVPU | Portfolio Average YTW |
Leverage Divisor |
Securities Average YTW |
Capital Gains Multiplier |
Sustainable Income per current Unit |
| June, 2007 | 9.3114 | 5.16% | 1.03 | 5.01% | 1.3240 | 0.3524 |
| September | 9.1489 | 5.35% | 0.98 | 5.46% | 1.3240 | 0.3773 |
| December, 2007 | 9.0070 | 5.53% | 0.942 | 5.87% | 1.3240 | 0.3993 |
| March, 2008 | 8.8512 | 6.17% | 1.047 | 5.89% | 1.3240 | 0.3938 |
| June | 8.3419 | 6.034% | 0.952 | 6.338% | 1.3240 | $0.3993 |
| September | 8.1886 | 7.108% | 0.969 | 7.335% | 1.3240 | $0.4537 |
| December, 2008 | 8.0464 | 9.24% | 1.008 | 9.166% | 1.3240 | $0.5571 |
| March 2009 | $8.8317 | 8.60% | 0.995 | 8.802% | 1.3240 | $0.5872 |
| June | 10.9846 | 7.05% | 0.999 | 7.057% | 1.3240 | $0.5855 |
| September | 12.3462 | 6.03% | 0.998 | 6.042% | 1.3240 | $0.5634 |
| December 2009 | 10.5662 | 5.74% | 0.981 | 5.851% | 1.1141 | $0.5549 |
| March 2010 | 10.2497 | 6.03% | 0.992 | 6.079% | 1.1141 | $0.5593 |
| June | 10.5770 | 5.96% | 0.996 | 5.984% | 1.1141 | $0.5681 |
| September | 11.3901 | 5.43% | 0.980 | 5.540% | 1.1141 | $0.5664 |
| December 2010 | 10.7659 | 5.37% | 0.993 | 5.408% | 1.0298 | $0.5654 |
| March, 2011 | 11.0560 | 6.00% | 0.994 | 5.964% | 1.0298 | $0.6403 |
| June | 11.1194 | 5.87% | 1.018 | 5.976% | 1.0298 | $0.6453 |
| September | 10.2709 | 6.10% Note |
1.001 | 6.106% | 1.0298 | $0.6090 |
| December, 2011 | 10.0793 | 5.63% Note |
1.031 | 5.805% | 1.0000 | $0.5851 |
| March, 2012 | 10.3944 | 5.13% Note |
0.996 | 5.109% | 1.0000 | $0.5310 |
| June | 10.2151 | 5.32% Note |
1.012 | 5.384% | 1.0000 | $0.5500 |
| September | 10.6703 | 4.61% Note |
0.997 | 4.624% | 1.0000 | $0.4934 |
| December, 2012 | 10.8307 | 4.24% | 0.989 | 4.287% | 1.0000 | $0.4643 |
| March, 2013 | 10.9033 | 3.87% | 0.996 | 3.886% | 1.0000 | $0.4237 |
| June | 10.3261 | 4.81% | 0.998 | 4.80% | 1.0000 | $0.4957 |
| September | 10.0296 | 5.62% | 0.996 | 5.643% | 1.0000 | $0.5660 |
| December, 2013 | 9.8717 | 6.02% | 1.008 | 5.972% | 1.0000 | $0.5895 |
| March, 2014 | 10.2233 | 5.55% | 0.998 | 5.561% | 1.0000 | $0.5685 |
| June | 10.5877 | 5.09% | 0.998 | 5.100% | 1.0000 | $0.5395 |
| September | 10.4601 | 5.28% | 0.997 | 5.296% | 1.0000 | $0.5540 |
| December, 2014 | 10.5701 | 4.83% | 1.009 | 4.787% | 1.0000 | $0.5060 |
| March, 2015 | 9.9573 | 4.99% | 1.001 | 4.985% | 1.0000 | $0.4964 |
| June, 2015 | 9.4181 | 5.55% | 1.002 | 5.539% | 1.0000 | $0.5217 |
| September | 7.8140 | 6.98% | 0.999 | 6.987% | 1.0000 | $0.5460 |
| December, 2015 | 8.1379 | 6.85% | 0.997 | 6.871% | 1.0000 | $0.5592 |
| March, 2016 | 7.4416 | 7.79% | 0.998 | 7.805% | 1.0000 | $0.5808 |
| June | 7.6704 | 7.67% | 1.011 | 7.587% | 1.0000 | $0.5819 |
| September | 8.0590 | 7.35% | 0.993 | 7.402% | 1.0000 | $0.5965 |
| December, 2016 | 8.5844 | 7.24% | 0.990 | 7.313% | 1.0000 | $0.6278 |
| March, 2017 | 9.3984 | 6.26% | 0.994 | 6.298% | 1.0000 | $0.5919 |
| June | 9.5313 | 6.41% | 0.998 | 6.423% | 1.0000 | $0.6122 |
| September | 9.7129 | 6.56% | 0.998 | 6.573% | 1.0000 | $0.6384 |
| December, 2017 | 10.0566 | 6.06% | 1.004 | 6.036% | 1.0000 | $0.6070 |
| March, 2018 | 10.2701 | 6.22% | 1.007 | 6.177% | 1.0000 | $0.6344 |
| June | 10.2518 | 6.22% | 0.995 | 6.251% | 1.0000 | $0.6408 |
| September | 10.2965 | 6.62% | 1.018 | 6.503% | 1.0000 | $0.6696 |
| December, 2018 | 8.6875 | 7.16% | 0.997 | 7.182% | 1.0000 | $0.6240 |
| March, 2019 | 8.4778 | 7.09% | 1.007 | 7.041% | 1.0000 | $0.5969 |
| June | 8.0896 | 7.33% | 0.996 | 7.359% | 1.0000 | $0.5953 |
| September | 7.7948 | 7.96% | 0.998 | 7.976% | 1.0000 | $0.6217 |
| December, 2019 | 8.0900 | 6.03% | 0.995 | 6.060% | 1.0000 | $0.4903 |
| March | 5.5596 | 7.04% | 1.006 | 6.998% | 1.0000 | $0.3891 |
| June | 6.3568 | 6.10% | 0.9900 | 6.162% | 1.0000 | $0.3917 |
| September | 7.2852 | 5.32% | 1.00 | 5.320% | 1.0000 | $0.3876 |
| December, 2020 | 8.3947 | 4.46% | 0.999 | 4.464% | 1.0000 | $0.3747 |
| January, 2021 | 8.7395 | 4.34% | 1.001 | 4.336% | 1.0000 | $0.3789 |
| NAVPU is shown after quarterly distributions of dividend income and annual distribution of capital gains. Portfolio YTW includes cash (or margin borrowing), with an assumed interest rate of 0.00% The Leverage Divisor indicates the level of cash in the account: if the portfolio is 1% in cash, the Leverage Divisor will be 0.99 Securities YTW divides “Portfolio YTW” by the “Leverage Divisor” to show the average YTW on the securities held; this assumes that the cash is invested in (or raised from) all securities held, in proportion to their holdings. The Capital Gains Multiplier adjusts for the effects of Capital Gains Dividends. On 2009-12-31, there was a capital gains distribution of $1.989262 which is assumed for this purpose to have been reinvested at the final price of $10.5662. Thus, a holder of one unit pre-distribution would have held 1.1883 units post-distribution; the CG Multiplier reflects this to make the time-series comparable. Note that Dividend Distributions are not assumed to be reinvested. Sustainable Income is the resultant estimate of the fund’s dividend income per current unit, before fees and expenses. Note that a “current unit” includes reinvestment of prior capital gains; a unitholder would have had the calculated sustainable income with only, say, 0.9 units in the past which, with reinvestment of capital gains, would become 1.0 current units. |
||||||
| DeemedRetractibles are comprised of all Straight Perpetuals (both PerpetualDiscount and PerpetualPremium) issued by BMO, BNS, CM, ELF, GWO, HSB, IAG, MFC, NA, RY, SLF and TD, which are not exchangable into common at the option of the company or the regulator (definition refined in May, 2011). These issues are analyzed as if their prospectuses included a requirement to redeem at par on or prior to 2022-1-31 (banks) or the Deemed Maturity date for insurers and insurance holding companies (see below)), in addition to the call schedule explicitly defined. See the Deemed Retractible Review: September 2016 for the rationale behind this analysis.
The same reasoning is also applied to FixedResets from these issuers, other than explicitly defined NVCC from banks. In November, 2019, the assumption of DeemedRetraction for insurance issues was cancelled in the wake of the IAIS decision included in ICS 2.0. This resulted in a large drop in the yield calculated for these issues |
||||||
| The Deemed Maturity date for insurers was set at 2022-1-31 at the commencement of the process in February, 2011. It was extended to 2025-1-31 in April, 2013 and to 2030-1-31 in December, 2018. In November, 2019, the assumption of DeemedRetraction was cancelled in the wake of the IAIS decision included in ICS 2.0. | ||||||
| Yields for September, 2011, to January, 2012, were calculated by imposing a cap of 10% on the yields of YLO issues held, in order to avoid their extremely high calculated yields distorting the calculation and to reflect the uncertainty in the marketplace that these yields will be realized. From February to September 2012, yields on these issues have been set to zero. All YLO issues held were sold in October 2012. | ||||||
These calculations were performed assuming constant contemporary GOC-5 and 3-Month Bill rates, as follows:
| Canada Yields Assumed in Calculations | ||
| Month-end | GOC-5 | 3-Month Bill |
| September, 2015 | 0.78% | 0.40% |
| December, 2015 | 0.71% | 0.46% |
| March, 2016 | 0.70% | 0.44% |
| June | 0.57% | 0.47% |
| September | 0.58% | 0.53% |
| December, 2016 | 1.16% | 0.47% |
| March, 2017 | 1.08% | 0.55% |
| June | 1.35% | 0.69% |
| September | 1.79% | 0.97% |
| December, 2017 | 1.83% | 1.00% |
| March, 2018 | 2.06% | 1.08% |
| June | 1.95% | 1.22% |
| September | 2.33% | 1.55% |
| December, 2018 | 1.88% | 1.65% |
| March, 2019 | 1.46% | 1.66% |
| June | 1.34% | 1.66% |
| September | 1.41% | 1.66% |
| December, 2019 | 1.68% | 1.68% |
| March, 2020 | 0.57% | 0.21% |
| June | 0.37% | 0.21% |
| September | 0.35% | 0.14% |
| December, 2020 | 0.42% | 0.08% |
| January, 2021 | 0.42% | 0.07% |
I note that the sustainable yield calculated above is not directly comparable with any yield calculation currently reported by any other preferred share fund as far as I am aware. The Sustainable Yield depends on:
i) Calculating Yield-to-Worst for each instrument and using this yield for reporting purposes;
ii) Using the contemporary value of Five-Year Canadas to estimate dividends after reset for FixedResets. The assumption regarding the five-year Canada rate has become more important as the proportion of low-spread FixedResets in the portfolio has increased.
iii) Making the assumption that deeply discounted NVCC non-compliant issues from banks (and insurers, until November 2019), both Straight and FixedResets will be redeemed at par on their DeemedMaturity date as discussed above.
