STRIPS are taking off!
An obscure corner of the $12.4 trillion market for U.S. government debt is providing one of the clearest signs yet that bond investors are writing off the threat of inflation for years, if not decades, to come.
Demand for Strips, created when Wall Street banks separate the interest payments from the principal of U.S. debt and sell each at a discount, has boosted the amount outstanding to an average $211 billion this year, the most since 1999, data from the Treasury Department show. The securities, the most vulnerable to inflation of all U.S. government bonds, posted the biggest returns this year by rallying almost 50 percent.
This is particularly impressive given that the yield curve is relatively flat; the STRIPS term curve will always (by inexorable mathematics) be steeper than the bond term curve, on an accelerating basis as the bond curve gets steeper … some of these investors might find themselves bankrupt and bewildered if the curve steepens; which, theoretically, it should do as the market starts pricing in policy rate hikes (cf. 1994).
There is much wailing over drops in the CAD:
The Canadian dollar slumped below the 86-cent mark today as oil prices slipped again.
And don’t expect it to get much better, though there may be some higher points along the way.
The loonie, as Canada’s dollar coin is known, closed at 85.79 cents U.S. today, down more than half a cent.
This came as oil prices, which had stabilized, tumbled yet again, continuing the weeks of turmoil.
But it ain’t got nuthin’ on the ruble:
The ruble tumbled the most since 1998, sliding past 60 for the first time, as traders tested Russia’s willingness to defend the currency amid an oil slump that’s pushing the economy toward recession.
The ruble weakened 9.1 percent to 64.0005 per dollar at 7:57 p.m. in Moscow, the steepest slide on a closing basis since the year Russia defaulted on local-currency debt. The 10-year government bond yield rose 23 basis points to 13.23 percent. Three-month implied volatility for the ruble climbed to a six-year high as the rout triggered the Bank of Russia to sell foreign exchange, according to BCS Financial Group and MDM Bank.
Traders are pressing the central bank to buy more rubles to limit a selloff that has wiped out 22 percent of the currency’s value this month. Oil’s slide toward $60 a barrel in London and sanctions over the conflict in Ukraine are undermining confidence in Russian assets as evidence mounts that the economy is entering a recession. Industrial output fell the most in more than a year in November, data showed today.
Assiduous Reader JP, who continues to send me interesting stuff when youse guys can’t be bothered, sends me a picture, and tells me to note the high and low:

Click for Big
Faced with this, Russia’s central bank had little choice but to acknowledge Russia’s third world status:
The central bank increased the key rate to 17 percent from 10.5 percent effective today, it said in a statement on its website. Policy makers gathered for an unscheduled meeting after a one-point increase on Dec. 11.
“This decision is aimed at limiting substantially increased ruble depreciation risks and inflation risks,” the bank said in the statement.
Russia’s central bank raised interest rates for the sixth time in 2014 after more than $80 billion spent from its reserves failed to stop a 49 percent selloff of the ruble, the world’s worst-performing currency this year. President Vladimir Putin, whose incursion into Ukraine’s Crimea peninsula in March prompted the U.S. and its allies to strike back with sanctions, this month called for “harsh” measures to deter currency speculators.
…
The ruble yesterday tumbled past 60 for the first time on record, losing 9.7 percent to 64.4455 a dollar. That extended its plunge this year to 49 percent, which overtook the Ukrainian hryvnia’s drop. Brent, the grade of oil traders look at for pricing Russia’s main export blend, slipped 79 cents, or 1.3 percent, to end the session at $61.06 a barrel on the London-based ICE Futures Europe exchange.
Basically, nobody knows what’s going on:
Canadian stocks fell, extending losses after the worst week in three years, as declines among materials and energy shares offset gains in consumer stocks.
Materials companies lost 3.3 percent as gold and silver fell on speculation the Federal Reserve is moving closer to raising U.S. interest rates amid an improving economy. Energy shares lost 0.9 percent as oil fell to the lowest level in more than five years. Talisman Energy Inc. rallied 18 percent as people familiar with the matter said Canada Pension Plan Investment Board is weighing a bid for the oil-and-gas explorer.
The Standard & Poor’s/TSX Composite Index (SPTSX) lost 25.91 points, or 0.2 percent, to 13,705.14 at 4 p.m. in Toronto, after rising as much as 0.9 percent and then falling 0.7 percent. The equity gauge dropped 5.1 percent last week, its worst weekly decline since September 2011. Trading in S&P/TSX stocks was 31 percent below the 30-day average at closing time.
Canadian equities have pared their gain for the year to 0.6 percent, after rallying as much as 15 percent to a record in September. Oil, bank and raw-material shares, which collectively account for two-thirds of the S&P/TSX, are the worst performers among 10 groups this year, led by a 20 percent slump in energy, according to data compiled by Bloomberg.
Rumours regarding Repsol / Talisman are getting very specific:
Spain’s Repsol SA has submitted an $8.3-billion (U.S.) takeover bid for Talisman Energy Inc. amid falling oil prices and questions about Talisman’s long-term prospects, a source familiar with the situation said on Monday.
Under the offer, Repsol would pay $8 (U.S.) per share of Calgary-based Talisman, the source said.
It was a deceptively mixed day for the Canadian preferred share market, with PerpetualDiscounts up 13bp, FixedResets gaining 4bp and DeemedRetractibles off 1bp, but the modest averages masked a lot of turmoil. There’s yet another very lengthy list of performance highlights, dominated by losing low-spread FixedResets. We may even have entered a period of self-feeding tax-loss selling (many of the losers are also volume highlights), but we won’t know until the season ends! Volume was above average.
For as long as the FixedReset market is so violently unsettled, I’ll keep publishing updates of the more interesting and meaningful series of FixedResets’ Implied Volatilities. This doesn’t include Enbridge because although Enbridge has a large number of issues outstanding, all of which are quite liquid, the range of Issue Reset Spreads is too small for decent conclusions. The low is 212bp (ENB.PR.H; second-lowest is ENB.PR.D at 237bp) and the high is a mere 268 for ENB.PF.G.
Remember that all rich /cheap assessments are:
- based on Implied Volatility Theory only
- are relative only to other FixedResets from the same issuer
- assume constant GOC-5 yield
- assume constant Implied Volatility
- assume constant spread
Here’s TRP:

Click for Big
So according to this, TRP.PR.A, bid at 19.20, is $2.13 cheap (!), but it has already reset (at +192). TRP.PR.D, bid at 25.15 and resetting at +238bp on 2019-4-30 is $0.81 rich and TRP.PR.E, bid at 25.20 and resetting at +235bp on 2019-10-30, is $1.00 rich. The TRP issues seem to be steadily rationalizing, but there continues to be pressure on TRP.PR.A.
Now, this is really interesting. TRP.PR.A will pay 3.266%, which is to say $0.8165, until its next reset date 2019-12-31. TRP.PR.E will continue to pay its initial dividend of $1.0625 until it resets 2019-10-30 at +235. See that? Two month’s difference in reset. I think we can disregard forecasts of changes in GOC-5 yield that get that precise. That is to say, over the next five years, TRP.PR.E will pay a total of about $1.25 more than TRP.PR.A. Then it will reset at 46bp more, which is to say $0.115 p.a., forever.
And yet the difference in price is … is … SIX DOLLARS! That seems to me to be a lot to pay for a short term payment of $1.25, leaving $4.75, to earn $0.115, or 2.42%. But some people, it would seem, find this quite reasonable.
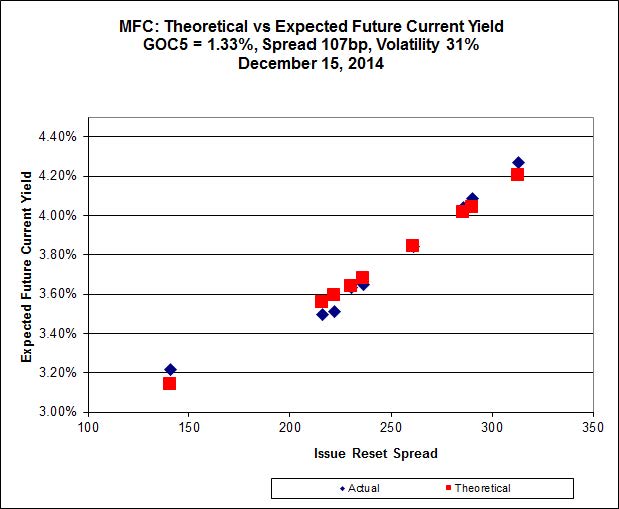
Click for Big
MFC has a very good fit to theory, but the Implied Volatility is very high.
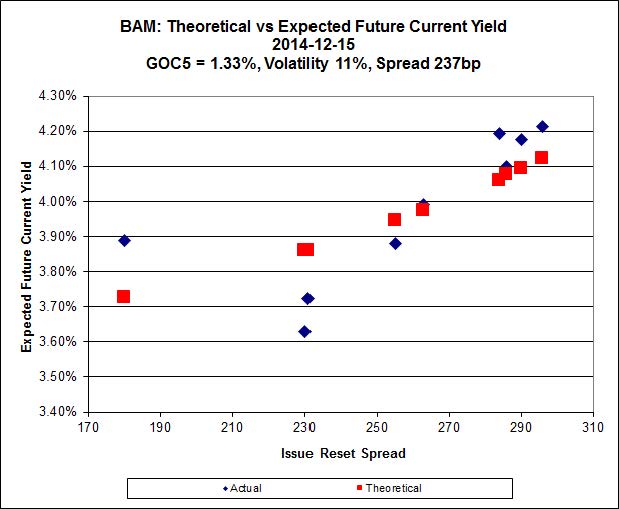
Click for Big
There continues to be extraordinary cheapness in the lowest-spread issue, BAM.PR.X, resetting at +180bp on 2017-6-30, is bid at 20.12 and appears to be $0.89 cheap, while BAM.PR.R, resetting at +230bp 2016-6-30 is bid at 25.00 and appears to be $1.49 rich.

Click for Big
This is just weird because the middle is expensive and the ends are cheap but anyway … FTS.PR.H, with a spread of +145bp, and bid at 18.40, looks $1.01 cheap and resets 2015-6-1. FTS.PR.K, with a spread of +205bp, and bid at 24.20, looks $0.66 expensive and resets 2019-3-1
| HIMIPref™ Preferred Indices These values reflect the December 2008 revision of the HIMIPref™ Indices Values are provisional and are finalized monthly |
|||||||
| Index | Mean Current Yield (at bid) |
Median YTW |
Median Average Trading Value |
Median Mod Dur (YTW) |
Issues | Day’s Perf. | Index Value |
| Ratchet | 0.00 % | 0.00 % | 0 | 0.00 | 0 | 0.3030 % | 2,509.2 |
| FixedFloater | 0.00 % | 0.00 % | 0 | 0.00 | 0 | 0.3030 % | 3,972.6 |
| Floater | 3.02 % | 3.11 % | 59,635 | 19.45 | 4 | 0.3030 % | 2,667.5 |
| OpRet | 4.41 % | -3.87 % | 27,159 | 0.08 | 2 | -0.0979 % | 2,749.3 |
| SplitShare | 4.31 % | 4.11 % | 45,189 | 3.71 | 5 | -0.0531 % | 3,173.5 |
| Interest-Bearing | 0.00 % | 0.00 % | 0 | 0.00 | 0 | -0.0979 % | 2,514.0 |
| Perpetual-Premium | 5.44 % | -0.36 % | 73,710 | 0.08 | 20 | -0.0509 % | 2,473.9 |
| Perpetual-Discount | 5.22 % | 5.14 % | 109,492 | 15.21 | 15 | 0.1326 % | 2,636.3 |
| FixedReset | 4.28 % | 3.64 % | 225,234 | 16.44 | 75 | 0.0382 % | 2,517.2 |
| Deemed-Retractible | 5.00 % | 1.81 % | 97,526 | 0.20 | 40 | -0.0080 % | 2,600.7 |
| FloatingReset | 2.56 % | 2.10 % | 64,904 | 3.52 | 5 | 0.0079 % | 2,533.6 |
| Performance Highlights | |||
| Issue | Index | Change | Notes |
| TRP.PR.A | FixedReset | -3.52 % | YTW SCENARIO Maturity Type : Limit Maturity Maturity Date : 2044-12-15 Maturity Price : 19.20 Evaluated at bid price : 19.20 Bid-YTW : 4.22 % |
| FTS.PR.H | FixedReset | -2.65 % | YTW SCENARIO Maturity Type : Limit Maturity Maturity Date : 2044-12-15 Maturity Price : 18.40 Evaluated at bid price : 18.40 Bid-YTW : 3.81 % |
| ENB.PR.T | FixedReset | -2.03 % | YTW SCENARIO Maturity Type : Limit Maturity Maturity Date : 2044-12-15 Maturity Price : 21.82 Evaluated at bid price : 22.23 Bid-YTW : 4.34 % |
| HSE.PR.A | FixedReset | -1.86 % | YTW SCENARIO Maturity Type : Limit Maturity Maturity Date : 2044-12-15 Maturity Price : 19.04 Evaluated at bid price : 19.04 Bid-YTW : 4.11 % |
| ENB.PR.A | Perpetual-Premium | -1.74 % | YTW SCENARIO Maturity Type : Limit Maturity Maturity Date : 2044-12-15 Maturity Price : 24.56 Evaluated at bid price : 24.81 Bid-YTW : 5.58 % |
| FTS.PR.K | FixedReset | -1.71 % | YTW SCENARIO Maturity Type : Limit Maturity Maturity Date : 2044-12-15 Maturity Price : 22.92 Evaluated at bid price : 24.20 Bid-YTW : 3.53 % |
| ENB.PR.H | FixedReset | -1.49 % | YTW SCENARIO Maturity Type : Limit Maturity Maturity Date : 2044-12-15 Maturity Price : 20.48 Evaluated at bid price : 20.48 Bid-YTW : 4.36 % |
| ENB.PF.G | FixedReset | -1.34 % | YTW SCENARIO Maturity Type : Limit Maturity Maturity Date : 2044-12-15 Maturity Price : 22.55 Evaluated at bid price : 23.59 Bid-YTW : 4.32 % |
| BMO.PR.Q | FixedReset | -1.08 % | YTW SCENARIO Maturity Type : Hard Maturity Maturity Date : 2022-01-31 Maturity Price : 25.00 Evaluated at bid price : 23.74 Bid-YTW : 3.67 % |
| GWO.PR.G | Deemed-Retractible | -1.04 % | YTW SCENARIO Maturity Type : Hard Maturity Maturity Date : 2025-01-31 Maturity Price : 25.00 Evaluated at bid price : 24.65 Bid-YTW : 5.39 % |
| PWF.PR.S | Perpetual-Discount | -1.03 % | YTW SCENARIO Maturity Type : Limit Maturity Maturity Date : 2044-12-15 Maturity Price : 23.58 Evaluated at bid price : 23.95 Bid-YTW : 5.06 % |
| PWF.PR.T | FixedReset | 1.02 % | YTW SCENARIO Maturity Type : Limit Maturity Maturity Date : 2044-12-15 Maturity Price : 23.45 Evaluated at bid price : 25.70 Bid-YTW : 3.56 % |
| BNS.PR.P | FixedReset | 1.17 % | YTW SCENARIO Maturity Type : Call Maturity Date : 2018-04-25 Maturity Price : 25.00 Evaluated at bid price : 26.00 Bid-YTW : 2.24 % |
| BNS.PR.Y | FixedReset | 1.51 % | YTW SCENARIO Maturity Type : Hard Maturity Maturity Date : 2022-01-31 Maturity Price : 25.00 Evaluated at bid price : 24.15 Bid-YTW : 3.00 % |
| MFC.PR.J | FixedReset | 1.54 % | YTW SCENARIO Maturity Type : Call Maturity Date : 2018-03-19 Maturity Price : 25.00 Evaluated at bid price : 25.65 Bid-YTW : 3.16 % |
| TRP.PR.D | FixedReset | 2.28 % | YTW SCENARIO Maturity Type : Limit Maturity Maturity Date : 2044-12-15 Maturity Price : 23.26 Evaluated at bid price : 25.15 Bid-YTW : 3.64 % |
| Volume Highlights | |||
| Issue | Index | Shares Traded |
Notes |
| FTS.PR.H | FixedReset | 214,150 | Desjardins crossed 188,300 at 18.00. YTW SCENARIO Maturity Type : Limit Maturity Maturity Date : 2044-12-15 Maturity Price : 18.40 Evaluated at bid price : 18.40 Bid-YTW : 3.81 % |
| TRP.PR.A | FixedReset | 120,518 | Will reset at 3.266%. Desjardins crossed 20,800 at 19.33. RBC crossed blocks of 28,200 and 24,200 at the same price. YTW SCENARIO Maturity Type : Limit Maturity Maturity Date : 2044-12-15 Maturity Price : 19.20 Evaluated at bid price : 19.20 Bid-YTW : 4.22 % |
| ENB.PR.Y | FixedReset | 79,491 | Scotia bought 10,700 from National at 21.90. YTW SCENARIO Maturity Type : Limit Maturity Maturity Date : 2044-12-15 Maturity Price : 21.59 Evaluated at bid price : 21.92 Bid-YTW : 4.30 % |
| CM.PR.E | Perpetual-Premium | 36,275 | Called for redemption 2015-1-31. YTW SCENARIO Maturity Type : Call Maturity Date : 2015-01-14 Maturity Price : 25.00 Evaluated at bid price : 25.30 Bid-YTW : -0.42 % |
| TRP.PR.C | FixedReset | 33,937 | RBC crossed 13,200 at 18.96. YTW SCENARIO Maturity Type : Limit Maturity Maturity Date : 2044-12-15 Maturity Price : 18.71 Evaluated at bid price : 18.71 Bid-YTW : 3.97 % |
| BNS.PR.Q | FixedReset | 29,083 | RBC crossed 25,000 at 25.77. YTW SCENARIO Maturity Type : Call Maturity Date : 2018-10-25 Maturity Price : 25.00 Evaluated at bid price : 25.72 Bid-YTW : 2.95 % |
| There were 36 other index-included issues trading in excess of 10,000 shares. | |||
| Wide Spread Highlights | ||
| Issue | Index | Quote Data and Yield Notes |
| CGI.PR.D | SplitShare | Quote: 25.05 – 26.14 Spot Rate : 1.0900 Average : 0.6202 YTW SCENARIO |
| PWF.PR.A | Floater | Quote: 19.25 – 20.00 Spot Rate : 0.7500 Average : 0.4576 YTW SCENARIO |
| ENB.PF.G | FixedReset | Quote: 23.59 – 24.15 Spot Rate : 0.5600 Average : 0.3519 YTW SCENARIO |
| ENB.PR.A | Perpetual-Premium | Quote: 24.81 – 25.30 Spot Rate : 0.4900 Average : 0.2943 YTW SCENARIO |
| BAM.PF.A | FixedReset | Quote: 25.33 – 25.75 Spot Rate : 0.4200 Average : 0.2618 YTW SCENARIO |
| MFC.PR.B | Deemed-Retractible | Quote: 23.62 – 24.07 Spot Rate : 0.4500 Average : 0.3005 YTW SCENARIO |