BCE Inc. has finally announced:
As a result of the amalgamation of Bell Aliant Preferred Equity Inc. (TSX: BAF) (Prefco), which was approved by preferred shareholders on October 31, 2014 and became effective November 1, 2014, Prefco became a wholly owned subsidiary of Bell Aliant.
Bell Aliant common shares were de-listed from the Toronto Stock Exchange (TSX) on October 31, 2014 and the Bell Aliant preferred shares will be delisted from the TSX at the close of trading today.
Naturally, it would have been far too much work to confirm the consideration given in exchange for the BAF preferreds, so after an annoying search through the website we find:
BCE’s preferred share offer expired at 5:00 pm (Eastern Time) on September 19, 2014. As all conditions of BCE’s preferred share offer have been satisfied, the BCE preferred shares exchanged for tendered Bell Aliant preferred shares were issued on September 24, 2014 and commenced trading on the Toronto Stock Exchange at the open of trading on the next day.
On October 3, 2014, BCE announced that the company has entered into an agreement with Bell Aliant Preferred Equity Inc. (TSX: BAF) (Prefco) to effect an amalgamation of Prefco with a newly incorporated, wholly owned subsidiary of BCE. Upon implementation:
- holders of Prefco preferred shares (other than shareholders who properly exercise their right of dissent in respect of the amalgamation) will receive for their shares the same consideration as was paid by BCE for preferred shares pursuant to the preferred share offer; and
- Prefco will become a wholly owned subsidiary of BCE.
A special meeting of the Prefco preferred shareholders will be held on October 31, 2014 at 9:30 am (Atlantic Time) to consider the amalgamation. BCE intends to vote all of the preferred shares that it owned as of September 30, 2014, the record date for the meeting, in favour of the amalgamation, which will be sufficient to approve the amalgamation and complete the privatization of Prefco.
The notice of meeting, accompanying management information circular and related meeting material, which contain full details of the amalgamation, was mailed to Prefco preferred shareholders early in October. The meeting material is also available on SEDAR at www.sedar.com and on EDGAR at www.sec.gov.
Because the jerk who approved this press release is a moron, this STILL doesn’t give the details of the consideration, so we reach back into the files to find the following table:
:
BCE / BAF Preferred Share Exchange BCE Ticker Description BAF Ticker BCE.PR.M FixedReset
4.85%+209BAF.PR.A BCE.PR.O FixedReset
4.55%+309BAF.PR.C BCE.PR.Q FixedReset
4.25%+264BAF.PR.E
Golly, republishing that table was a lot of work! I think I’ll take a few vacation weeks and spend my bonus. On the bright side, the BCE preferred share web page has finally been updated and, even better, there is confirmation from DBRS:
DBRS has today discontinued Bell Aliant Preferred Equity Inc.’s (Bell Aliant) preferred share ratings following their delisting as part of Bell Aliant Inc.’s privatization. This rating action removes Bell Aliant’s preferred shares from Under Review with Positive Implications.
On July 23, 2014, BCE Inc. (BCE) announced it would privatize its Bell Aliant Inc. affiliate by acquiring the interest of public minority shareholders for consideration of approximately $3.95 billion. DBRS subsequently placed Bell Aliant’s preferred shares Under Review with Positive Implications based on the stronger credit profile of BCE/Bell Canada. The transaction closed on October 31, 2014.
As part of BCE’s tender offer to acquire the minority interest in Bell Aliant Inc., BCE exchanged all of the issued and outstanding Series A Preferred Shares, Series C Preferred Shares and Series E Preferred Shares at Bell Aliant Preferred Equity Inc. on the basis of (a) one BCE Series AM Preferred Share for each Series A Preferred Share; (b) one BCE Series AO Preferred Share for each Series C Preferred Share; and (c) one BCE Series AQ Preferred Share for each Series E Preferred Share. Bell Aliant’s preferred shares were delisted from the TSX at the close of trading on November 3, 2014.
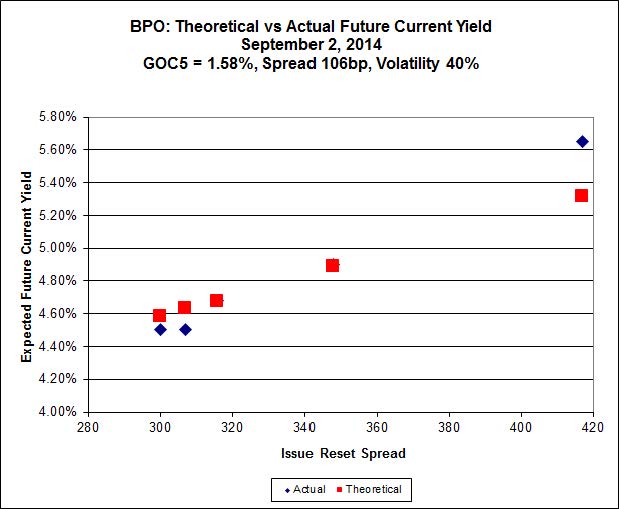
The Implied Volatility calculation actually looks pretty good:

Click for Big