Archive for the ‘Index Construction / Reporting’ Category

HIMIPref™ Index Rebalancing: September 2008

Wednesday, October 1st, 2008
HIMI Index Changes, September 30, 2008
Issue From To Because
SBN.PR.A SplitShare Scraps Volume
DF.PR.A SplitShare Scraps Volume
STW.PR.A Scraps InterestBearing Volume

There were the following intra-month changes:

HIMI Index Changes during September 2008
Issue Action Index Because
BNS.PR.R Add FixedReset New Issue
CM.PR.K Add FixedReset New Issue
TD.PR.A Add FixedReset New Issue
RY.PR.I Add FixedReset New Issue
IQW.PR.D Delete Scraps Price

The Fixed-Reset Index was inaugurated and previously extant but untracked issues added to the database on a backdated basis; the 9/30 position has been uploaded.

Fixed-Reset Issues Added to HIMIPref™

Monday, September 8th, 2008

As promised, Fixed-Reset issues have been added to the HIMIPref™ database.

Additionally, a new HIMIPref™ sub-index has been added, the Fixed-Reset Index.

Minor, but annoying programming changes were required in order to add these issues. Each Floating-Rate issue requires what is currently a hard-coded schedule, specifying the base index to be used for the issues and the calculations required to obtain the projected floating-rate. This has been an easy matter in the past, since there have not been many new floaters added and since those that have been added have fit comfortably into extant classifications (e.g., Ratchet Rate, Canada Prime, max 100% of index, min 50% of index). Fixed-Resets, however, have a spread specified in terms of basis points; in order to specify the future floating rate for the current ten issues, nine different spreads neede to be hard coded.

Therefore, HIMIPref™ users must download the new executable in the usual way. Don’t forget to back up user files prior to installation!

There is a possibility that I might isolate the hypervariable sections of code and place them in a new web-service, with calculations and descriptions to be downloaded on the fly. This would mean that the front-end could stay constant; to add a new floating rate specification I would simply recode and reinstall the service on server-side, invisibly to users. However, I have not yet determined that this concept is practically possible or, if possible, whether or not it will simply lead to spaghetti code making future enhancements possible. Until I’ve made a decision, users will simply have to re-download and re-install the front-end every time the issuers come up with a new spread!

Index Performance: August 2008

Wednesday, September 3rd, 2008

Performance of the HIMIPref™ Indices for August, 2008, was:

Total Return
Index Performance
August 2008
Three Months
to
August 29, 2008
Ratchet N/A N/A
FixFloat +2.14% +7.76%
Floater +2.94% -2.24%
OpRet +1.44% -0.17%
SplitShare +0.86% -1.41%
Interest +0.81% +1.55%
PerpetualPremium +1.30% -1.78%
PerpetualDiscount +3.91% -4.90%
Funds (see below for calculations)
CPD +2.48% -4.09%
DPS.UN +2.63% -4.12%
Index
BMO-CM 50 +2.88% -2.72%

Claymore has published NAV data for its exchange traded fund (CPD) and I have derived the following table:

CPD Return, 1- & 3-month, to August, 2008
Date NAV Distribution Return for Sub-Period Monthly Return
May 30 17.85 0.00    
June 25 17.01 0.2097 -3.53% -4.26%
June 30, 2008 16.88   -0.76%
July 31, 2008 16.50 0.00   -2.25%
August 29 16.91 0.00   +2.48%
Quarterly Return -4.09%

The DPS.UN NAV for August 27 has been published so we may calculate the July returns (approximately!) for this closed end fund:

DPS.UN NAV Return, August-ish 2008
Date NAV Distribution Return for period
Estimated July Stub -0.30%
July 30 $19.48    
August 27 $20.03   +2.82%
Estimated August Stub +0.12%
Estimated August Return +2.63%
CPD had a NAV of $16.45 on July 30 and $16.50 on July 31. The estimated July end-of-month stub period return for CPD was therefore +0.30%, which is subtracted from the DPS.UN period return.
CPD had a NAV of $16.89 on August 27 and $16.91 on August 29. The estimated August end-of-month stub period return for CPD was therefore +0.12%, which is added to the DPS.UN period return.

Now, to see the DPS.UN quarterly NAV approximate return, we refer to the calculations for June and July

DPS.UN NAV Returns, three-month-ish to end-August-ish, 2008
June-ish -3.53%
July-ish -3.16%
August-ish +2.63%
Three-months-ish -4.12%

HIMIPref™ Index Rebalancing: August, 2008

Tuesday, September 2nd, 2008
HIMI Index Changes, August 29, 2008
Issue From To Because
FAL.PR.B FixFloat Scraps Volume
PWF.PR.D OpRet Scraps Volume
ACO.PR.A OpRet Scraps Volume
TRI.PR.B Floater Scraps Volume

There were the following intra-month changes:

HIMI Index Changes during August 2008
Issue Action Index Because
RY.PR.K Delete OpRet Redeemed

It was a near-run thing … but despite the good performance of the PerpetualDiscount index, none of the issues made it over par and CL.PR.B remains the sole PerpetualPremium issue outstanding.

Index Performance: July 2008

Friday, August 1st, 2008

Performance of the HIMIPref™ Indices for July, 2008, was:

Total Return
Index Performance
July 2008
Three Months
to
July 31, 2008
Ratchet N/A N/A
FixFloat +5.94% +3.00%
Floater -2.01% +5.17%
OpRet -1.28% -1.05%
SplitShare -0.23% -0.76%
Interest -0.18% +1.92%
PerpetualPremium -1.68% -2.60%
PerpetualDiscount -3.34% -7.22%
Funds (see below for calculations)
CPD -2.25% -5.09%
DPS.UN -3.16% -5.66%
Index
BMO-CM 50    

Claymore has published NAV data for its exchange traded fund (CPD) and I have derived the following table:

CPD Return, 1- & 3-month, to July, 2008
Date NAV Distribution Return for Sub-Period Monthly Return
May 30 17.85 0.00   +1.42%
June 25 17.01 0.2097 -3.53% -4.26%
June 30, 2008 16.88   -0.76%
July 31, 2008 16.50 0.00   -2.25%
Quarterly Return -5.09%

The DPS.UN NAV for July 30 has been published so we may calculate the July returns (approximately!) for this closed end fund:

DPS.UN NAV Return, July-ish 2008
Date NAV Distribution Return for period
June 25 $20.33    
June 30 N/A   -0.76%
July 30 $19.48   -4.18%
(from June 25)
July 31 N/A   +0.30%
Estimated July Return -3.16%
CPD had a NAV of $17.01 on June 25 and $16.88 on June 30. The estimated June end-of-month stub period return for CPD was therefore -0.76%, which is applied to DPS.UN as described above.
CPD had a NAV of $16.45 on July 30 and $16.50 on July 31. The estimated July end-of-month stub period return for CPD was therefore +0.30%, which is applied to DPS.UN as described above.

Now, to see the DPS.UN quarterly NAV approximate return, we refer to the calculations for May and June

DPS.UN NAV Returns, three-month-ish to end-July-ish, 2008
May-ish +0.98%
June-ish -3.53%
July-ish -3.16%
Three-months-ish -5.66%

HIMIPref™ Index Rebalancing: July, 2008

Friday, August 1st, 2008
HIMI Index Changes, July 31, 2008
Issue From To Because
PWF.PR.I PerpetualPremium PerpetualDiscount Price
GWO.PR.F PerpetualPremium PerpetualDiscount Price
CU.PR.A PerpetualPremium PerpetualDiscount Price
STW.PR.A InterestBearing Scraps Volume
BCE.PR.Y Scraps Ratchet Volume
FAL.PR.B Scraps FixFloat Volume

There were the following intra-month changes:

HIMI Index Changes during July 2008
Issue Action Index Because
GT.PR.A Delete Scraps Redeemed
FAL.PR.H Delete PerpetualPremium Redeemed
FAL.PR.A Delete Ratchet Redeemed
PAY.PR.A Delete Scraps Redeemed

As a result of these changes, there is exactly one issue left in the PerpetualPremium index: CL.PR.B.

TXPR Index Rebalancing

Friday, July 11th, 2008

S&P has announced:

the following index changes as a result of the semi-annual S&P/TSX Preferred Share Index Review. These changes will be effective at the open on Monday, July 21, 2008

TXPR Index Adds
July 2008
Ticker HIMI Preferred Sub-Index DBRS Rating
ACO.PR.A OpRet Pfd-2(low)
BMO.PR.M None
Fixed-Reset
Pfd-1
BNS.PR.N PerpetualDiscount Pfd-1
BNS.PR.P None
Fixed-Reset
Pfd-1
BNS.PR.Q None
Fixed-Reset
Pfd-1
BCE.PR.I FixFloat Pfd-2(low)
Review Negative
BAM.PR.N PerpetualDiscount Pfd-2(low)
BPO.PR.I Scraps
(OpRet)
Pfd-3(high)
CL.PR.B PerpetualPremium Pfd-1(low)
ENB.PR.A PerpetualDiscount Pfd-2(low)
FTS.PR.E Scraps
(OpRet)
Pfd-3(high)
FTS.PR.G None
(Fixed-Reset)
Pfd-3(high)
GWO.PR.I PerpetualDiscount Pfd-1(low)
NA.PR.M PerpetualDiscount Pfd-1(low)
NA.PR.N None
(Fixed-Reset)
Pfd-1(low)
TD.PR.S None
(Fixed-Reset)
Pfd-1
FAL.PR.H ???? N/A

I don’t understand why they are adding FAL.PR.H. Its redemption was announced May 22 and the date was set on May 29: Redemption Date June 30. They were redeemed on schedule. They are no longer listed on the TSX.

But that’s what happens, I guess, when (instead of hiring HIMI) you entrust index preparation to a small, inexperienced outfit like S&P!

But Holy Smokes! That’s a lot of Fixed-Resets! There are now seven of these thingies outstanding and six of them are now incorporated in TXPR – or will be once the change takes effect, anyway. Call up your friendly neighborhood CPD holder – preferably, one who is a really hard-line anti-active-management indexing zealot – and ask him why he’s so enamoured of the sub-class.

Is this jiggery-pokery, or do I have a disgusting suspicious mind? The latest Claymore literature references the “Desjardins Preferred Share Universe Index”; Desjardins is heavily promoting its involvement in fixed resets and (this wins all arguments in the bond world) Innovative Tier 1 Capital was put in the Scotia bond index (now DEX) for no reason that anybody can figure out except that it made it easier to sell.

All conspiracy theories are welcome.

In the meantime, this rebalancing compromises the integrity of the index as representative of actual preferred shares. Sorry folks, but that’s the way it is. And I’d love to know what the reference to FAL.PR.H is all about!

TXPR Index Deletions
July 2008
Ticker HIMI Preferred Sub-Index DBRS Rating
BMO.PR.H PerpetualDiscount Pfd-1
BNS.PR.J PerpetualDiscount Pfd-1
BNS.PR.K PerpetualDiscount Pfd-1
BNS.PR.L PerpetualDiscount Pfd-1
BCE.PR.F None
(FixFloat)
Pfd-2(low)
Review Negative
BAM.PR.B Floater Pfd-2(low)
BPO.PR.J Scraps
(OpRet)
Pfd-3(high)
FTS.PR.C Scraps
(OpRet)
Pfd-3(high)
FTS.PR.F Scraps
(PerpetualDiscount)
Pfd-3(high)
GWO.PR.X OpRet Pfd-1(low)
HSB.PR.C PerpetualDiscount Pfd-1
IAG.PR.A PerpetualDiscount Pfd-2(high)
NA.PR.L PerpetualDiscount Pfd-1(low)
TD.PR.P PerpetualDiscount Pfd-1
TCA.PR.X PerpetualDiscount Pfd-2(low)
YPG.PR.B Scraps
(OpRet)
Pfd-3(high)

In summary and, perforce, ignoring any weightings that S&P might be assigning:

TXPR Changes by Sector
Ignoring FAL.PR.H Add
Assigning “Scraps” & “None” to “Would be”
Sector Adds Deletions Net
OpRet 3 4 -1
FixedReset 6 0 +6
PerpetualDiscount 5 10 -5
FixFloat 1 1 0
PerpetualPremium 1 0 +1
Floater 0 1 -1

… and …

TXPR Changes by Credit (DBRS)
Ignoring FAL.PR.H Add
Credit Adds Deletions Net
Pfd-1 5 6 -1
Pfd-1(low) 4 2 +2
Pfd-2(high) 0 1 -1
Pfd-2(low) 4 3 +1
Pfd-3(high) 3 4 -1

The previous rebalancing of TXPR removed SplitShares; this was claimed to be due to liquidity concerns … which, on examination, looked to be more like institutional holding / block trading concerns, strictly speaking.
Index Performance: June 2008

Monday, July 7th, 2008

Performance of the HIMIPref™ Indices for June, 2008, was:

Total Return
Index Performance
June 2008
Three Months
to
June 30, 2008
Ratchet +0.38% +2.68%
FixFloat -0.41% -1.02%
Floater -3.09% +6.39%
OpRet -0.32% +0.53%
SplitShare -2.02% +1.31%
Interest +0.91% +2.72%
PerpetualPremium -1.38% -0.57%
PerpetualDiscount -5.31% -3.90%
Funds (see below for calculations)
CPD -4.26% -2.90%
DPS.UN -3.53% -2.20%
Index
BMO-CM 50 -3.43% -2.09%

Claymore has published NAV data for its exchange traded fund (CPD) and I have derived the following table:

CPD Return, 1- & 3-month, to June, 2008
Date NAV Distribution Return for Sub-Period Monthly Return
March 31, 2008 17.60      
April 30 17.60     0.00%
May 30 17.85 0.00   +1.42%
June 25 17.01 0.2097 -3.53% -4.26%
June 30, 2008 16.88   -0.76%
Quarterly Return -2.90%

The DPS.UN NAV for June 25 has been published so we may calculate the June returns (approximately!) for this closed end fund:

DPS.UN NAV Return, June-ish 2008
Date NAV Distribution Return for period
May 28 $20.89   +0.87%
May 30 N/A   +0.11%
June 25 $20.33   -2.79%
June 30 N/A   -0.76%
Estimated June Return -3.53%
CPD had a NAV of $17.83 on May 28 and $17.85 on May 30. The estimated May end-of-month stub period return for CPD was therefore +0.11%, which is applied to DPS.UN as described above.


CPD had a NAV of $17.01 on June 25 and $16.88 on June 30. The estimated June end-of-month stub period return for CPD was therefore -0.76%, which is applied to DPS.UN as described above.

Now, to see the DPS.UN quarterly NAV approximate return, we refer to the calculations for April and May:

DPS.UN NAV Returns, three-month-ish to end-June-ish, 2008
April-ish +0.39%
May-ish +0.98%
June-ish -3.53%
Three-months-ish -2.20%

HIMIPref™ Index Rebalancing: June 2008

Thursday, July 3rd, 2008
HIMI Index Changes, June 30, 2008
Issue From To Because
FAL.PR.B FixFloat Scraps Volume
POW.PR.C PerpetualPremium PerpetualDiscount Price
BNS.PR.O PerpetualPremium PerpetualDiscount Price
PWF.PR.H PerpetualPremium PerpetualDiscount Price
BMO.PR.L PerpetualPremium PerpetualDiscount Price
TD.PR.Q PerpetualPremium PerpetualDiscount Price
CU.PR.B PerpetualPremium PerpetualDiscount Price
NA.PR.M PerpetualPremium PerpetualDiscount Price
TD.PR.R PerpetualPremium PerpetualDiscount Price
PWF.PR.G PerpetualPremium PerpetualDiscount Price
HPF.PR.A SplitShare Scraps Volume
ACO.PR.A Scraps OpRet Volume
TRI.PR.B Scraps Floater Volume
CU.PR.A PerpetualDiscount PerpetualPremium Price

There were the following intra-month changes:

HIMI Index Changes during June 2008
Issue Action Index Because
BAM.PR.O Add OpRet New Issue
L.PR.A Add Scraps New Issue

Issues in the PerpetualPremium Index are looking awfully lonely!

Party Like It's 1999!

Wednesday, June 18th, 2008

I don’t, as a rule, like pseudo-analytical notes such as this post. Historical plots implicitly assume that the anything not intrinisic to the plot is constant; and in plotting historical yields there’s an entire economy being ignored which is most emphatically not constant.

But some people like them; I got curious; and Assiduous Readers (after yesterday‘s collapse) will want something cheerful to look at.

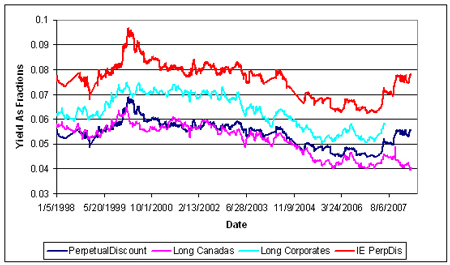
So … without further ado, here’s a plot of yields, going back 10 years. PerpetualDiscount yields are from the HIMIPref™ Index; other yields are courtesy of the Bank of Canada. The graphs get cut off at the end of March, 2008, because that’s the data I have convenient for the HIMIPref™ indices; Long Corporates get cut off in mid-2007, because that’s when the Bank stopped getting bond data with permission to redistribute freely.

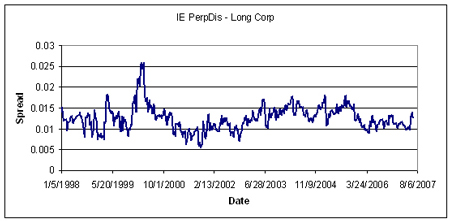
… and the Perpetual Discount Interest Equivalent Spread against Long Corporates (using a constant equivalency of 1.4x, which is fishy in the extreme):

So folks … we’re bloodied but unbowed! Spreads are (roughly) near a ten year high … recall my note of yesterday that PerpetualDiscounts now have an average yield of 6.00%; interest-equivalent (at 1.4x) of 8.40%; vs. Long Corporates of just under 6.2%.