Archive for the ‘Index Construction / Reporting’ Category

Negative Convexity? Negative Schmonvexity!

Monday, June 16th, 2008

In the comments to another post, Assiduous Reader mpisni asks:

Hi James, Recently we have seen issues rated at lower ratings take some big hits ( FTS, SLF, ) but the recent issues in the 5.6% to 6 % range have remained relatively unaffected.

Is this because of the dividend rate, higher ratings ?

How will these issues prices be effected down the road and how much will rates have to increase to see negative effects on their prices

Thanks James

I don’t really have a LOT of time to deal with this right now, but …

I’ve uploaded an Excel Spreadsheet showing the following data:

  • ticker
  • 5/30 YTW
  • 5/30 Price
  • DBRS Rating
  • Total Return 5/30-6/13 (bid side)

The spreadsheet includes a graph!

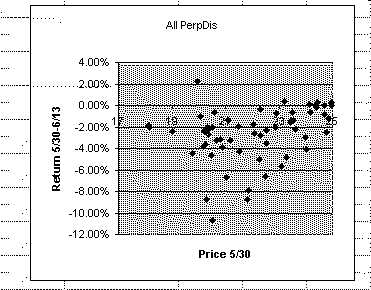
You can play with these data as much as you like … and if anybody can answer any of mpisni‘s questions (particularly the implicit “When will this be over?” part) … let me know!

If I had to give an answer and if my answer had to assume rationality of the market over any given two-week period (both of these are rather big ifs), I’d suggest that one hypothesis to test would be that

  • The market is anticipating further increases in long yields
  • Therefore, it is marking the “negative convexity” yield-premium down really low, since it assumes that there is no potential for capital gains being given up

See my article on convexity if you don’t have a clue what I’m blathering about.

Update: Note that this is a hot issue because it appears the preferred share market has hit a new 15-month trough … particularly, I think, when today is finally over!

Update: OK, there are two more possibilities:

  • The price paid for convexity was too much on 5/30; the market’s just readjusting … well … all I can say is: I don’t buy it.
  • Brokers are dumping their losers. Retail stockbrokers seek to avoid criticism. They’ve been getting worried calls from unsophisticated clients all year about ‘How come that new issue you sold me is down so much?’ They’re making the judgement that, at the very least, recovery is not imminent and simply dumping it. The near-par stuff isn’t getting dumped because they’re not getting any calls about that stuff.

Update: Yet another possibility! I know of at least one stockbroker who, last November, was aggressively getting his clients into preferreds on the grounds that when the BCE issues got redeemed, a tsunami of money would boost prices of existing issues.

Some such clients might be getting a little dubious about the “when”.

New Trough for Preferreds?

Thursday, June 12th, 2008

Doom! Carnage! Destruction! There have been better days, as Napolean said at Waterloo.

The market was down significantly today as inflation fears appear – for the nonce – to be affecting corporates as much as Canadas. PerpetualDiscounts now yield 5.85% as dividends, which (at the Ontario Interest-Equivalency Factor of 1.4x) provides the same after-tax income as interest of 8.18%. Long Corporate Bonds now yield a bit over 6.1%, so the interest-equivalent-spread is remaining fairly stable in its 190-210 basis point range.

CPD set a new 52-week low today, trading in a range of 17.44-66 and closing at 17.50-61, 6×250.

Assiduous, but gloomy, Readers will be fond of my article When Will Preferreds Recover?, in which I pointed out:

I have examined the last 14 years history of the BMO-CM 50 Preferred Share Index (since December 31, 1993) and the peak-to-trough performance of this index, from the peak at March 30, 2007 to November 30, 2007, is the worst on record. This period’s loss of 7.4% is unmatched by any other decline.

As a matter of fact, the previous worst peak-to-trough performance is that realized from March 30 to October 31 of this year. November’s poor returns were merely icing on the cake. The worst period previously, from the peak of January 1999 to the trough of February 29, 2000, experienced a loss of a mere 6.1%.

Daily figures for the BMOCM-50 are not available … not to me, anyway! But we can have a look at CPD as a proxy:

Total Return Comparisons
Month CPD
Total Return
After Expenses
After Fees
MAPF
Total Return
After Expenses
Before Fees
December, 2007 +1.14% +4.50%
January, 2008 +0.00% +1.28%
February +2.17% +3.62%
March -2.90% -4.56%
April +0.00% +0.73%
May, 2008 +1.42% +1.39%
Six-Month Cumulative +1.76% +6.90%
June MTD -1.90% *
Total Cumulative -0.17% *

The MER on CPD is reported to be 0.45% p.a. Those seeking solace can add back a pro-rata share of this figure.

Malachite Aggressive Preferred Fund (“MAPF”) returns assume reinvestment of dividends, and are shown after expenses but before fees. Past performance is not a guarantee of future performance. You can lose money investing in MAPF or any other fund. For more information, see the fund’s main page.

A rough estimate of MAPF performance for the month-to-date is approximately: down 2.45% before fees and expenses. Expenses are capped at 50bp annually; fees are on a sliding scale depending upon amount invested. This figure is an estimate only and, even assuming perfect accuracy, does not necessarily reflect either the absolute or the relative figures that will be reported after month-end.

Long Corporates are reported to be down 1.09% for the month, down 2.57% for the calendar year to date (both figures represent total return of the DEX Long Term Corporate Bond Index).

HIMIPref™ Experimental Indices
Index Value
2007-11-30
Value
2008-6-12
Total
Return
Ratchet 1,049.6 1,114.1 +6.15%
FixFloat 1,035.4 1,018.8 -1.60%
Floater 970.9 936.2 -3.57%
OpRet 1,031.8 1,056.9 +2.43%
SplitShare 1,018.5 1,050.4 +3.13%
Interest 1,065.7 1,118.3 +4.94%
PerpetualPremium 1,065.7 1,021.4 -4.16%
PerpetualDiscount 904.3 906.5 +0.24%

It is most interesting to see that PerpetualDiscounts have managed to stay a little ahead of the game through the period … but on November 30 they had been marked down pretty low!

There are a few blanks in this post. I’ll fill them in shortly. All done!

Index Performance: May 2008

Tuesday, June 3rd, 2008

Performance of the HIMIPref™ Indices for May, 2008, was:

Total Return
Index Performance
May 2008
Three Months
to
May 30, 2008
Ratchet +1.79% +3.09%
FixFloat -2.37% +0.02%
Floater +10.75% +8.59%
OpRet +0.54% +0.76%
SplitShare +1.52% +0.71%
Interest +1.18% +2.04%
PerpetualPremium +0.46% -0.76%
PerpetualDiscount +1.37% -3.51%
Funds (see below for calculations)
CPD +1.42% -1.52%
DPS.UN +0.98% -0.92%
Index
BMO-CM 50 +1.32% -1.44%

Claymore has published NAV data for its exchange traded fund (CPD) and I have derived the following table:

CPD Return, 1- & 3-month, to May, 2008
Date NAV Distribution Return for Sub-Period Monthly Return
February 29 18.34      
March 26 17.64 0.2082 -2.68% -2.90%
March 31, 2008 17.60   -0.23%
April 30 17.60     0.00%
May 30 17.85 0.00   +1.42%
Quarterly Return -1.52%

The DPS.UN NAV for May 28 has been published so we may calculate the May returns (approximately!) for this closed end fund:

DPS.UN NAV Return, May-ish 2008
Date NAV Distribution Return for period
April 30, 2008 $20.71    
May 28 $20.89   +0.87%
May 30 N/A   +0.11%
Estimated May Return +0.98%
CPD had a NAV of $17.83 on May 28 and $17.85 on May 30. The estimated May end-of-month stub period return for CPD was therefore +0.11%, which is applied to DPS.UN as described above.

Now, to see the DPS.UN quarterly NAV approximate return, we refer to the calculations for March and April:

DPS.UN NAV Returns, three-month-ish to end-April-ish, 2008
March-ish -2.26%
April-ish +0.39%
May-ish +0.98%
Three-months-ish -0.92%

HIMIPref™ Index Rebalancing: May, 2008

Monday, June 2nd, 2008
HIMI Index Changes, May 30, 2008
Issue From To Because
TD.PR.Q PerpetualDiscount PerpetualPremium Price
NA.PR.M PerpetualDiscount PerpetualPremium Price
TD.PR.R PerpetualDiscount PerpetualPremium Price
BMO.PR.L PerpetualDiscount PerpetualPremium Price
POW.PR.C PerpetualDiscount PerpetualPremium Price
CU.PR.A PerpetualPremium PerpetualDiscount Price

There were the following intra-month changes:

HIMI Index Changes during May 2008
Issue Action Index Because
None

There were the following backdated changes:

HIMI Index Backdated Adjustments
2008-5-30
Issue Action Index Because
DF.PR.A Add SplitShare See Post
SBC.PR.A Add SplitShare See Post

Index Performance : April 2008

Tuesday, May 6th, 2008

Performance of the HIMIPref™ Indices for April, 2008, was:

Total Return
Index Performance
April 2008
Three Months
to
April 30, 2008
Ratchet +0.49% +3.63%
FixFloat +1.81% +4.78%
Floater -0.87% -1.63%
OpRet +0.31% +0.58%
SplitShare +1.85% +0.89%
Interest +0.60% +2.47%
PerpetualPremium +0.36% +0.03%
PerpetualDiscount +0.12% -1.93%
Funds (see below for calculations)
CPD 0.00% -0.79%
DPS.UN +0.39% +0.12%
Index
BMO-CM 50 +0.07% -1.09%

Note that the “BMO-CM 50” is now 0.42% above its November m/e trough.

Claymore has published NAV data and Distribution Data for its exchange traded fund (CPD) and I have derived the following table:

CPD Return, 1- & 3-month, to April, 2008
Date NAV Distribution Return for Sub-Period Monthly Return
February 29 18.34   +2.17% +2.17%
March 26 17.64 0.2082 -2.68% -2.90%
March 31, 2008 17.60   -0.23%
April 30 17.60     0.00%
Quarterly Return -0.79%

The DPS.UN NAV for March 26 has been published so we may calculate the March returns (approximately!) for this closed end fund:

DPS.UN NAV Return, April-ish 2008
Date NAV Distribution Return for period
March 26, 2008 $21.00   -0.23%
March 27, 2008 N/A $0.325
March 31, 2008 $20.63
Estimated
 
April 30, 2008 $20.71   +0.39%
The determination of NAV as of March 31 is complicated by the dividend. In order to estimate it, I have taken the March 26 NAV of $21.00 and subtracted the dividend (ex-date March 27) of $0.325 to arrive at a zero-return estimate of $20.675. I have then multiplied this by the CPD return in the March 26-31 period of -0.23% (return factor 0.9977) to estimate a March 31 NAV of $20.63  
Estimated April Return 0.39%
CPD had a NAV of $17.64 on March 26 and $17.60 on March 31. The estimated March end-of-month stub period return for CPD was therefore -0.23%, which is applied to DPS.UN as described above.

Now, to see the DPS.UN quarterly NAV approximate return, we refer to the calculations for February and March

DPS.UN NAV Returns, three-month-ish to end-April-ish, 2008
February-ish +2.04%
March-ish -2.26%
April-ish +0.39%
Three-months-ish +0.12%

HIMIPref™ Index Rebalancing: April, 2008

Thursday, May 1st, 2008
HIMI Index Changes, April 30, 2008
Issue From To Because
BAM.PR.G FixFloat Scraps Volume
BNS.PR.O PerpetualDiscount PerpetualPremium Price
PWF.PR.H PerpetualDiscount PerpetualPremium Price
PWF.PR.G PerpetualDiscount PerpetualPremium Price
BCE.PR.Y Ratchet Scraps Volume
TD.PR.Q PerpetualPremium PerpetualDiscount Price
FTU.PR.A SplitShares Scraps Credit
PIC.PR.A SplitShare Scraps Credit
HPF.PR.A Scraps SplitShare Volume

There were the following intra-month changes:

HIMI Index Changes during April 2008
Issue Action Index Because
BMO.PR.L Add PerpetualDiscount New Issue
NA.PR.M Add PerpetualDiscount New Issue
RY.PR.H Add PerpetualDiscount New Issue

Home-made Indices with Intra-Day Updating

Thursday, April 17th, 2008

Assiduous Reader kaspu has complained about the volatility of the S&P/TSX Preferred Share Index (TXPR on Bloomberg) – or, at least, the reported volatility.

The problem is that this index is based on actual trades; hence, it can bounce around a lot when 100 shares trade at the ask, $1 above the bid. For instance, today:

This sort of behaviour is endemic to indices created by small shops without much market knowledge or experience. Readers in need of indices with more precision may wish to use the HIMIPref™ Indices, which are, of course, based on much less volatile bid prices.

“Gummy” has announced a new spreadsheet, available from his website. This spreadsheet allows the download of bid and ask prices – and lots of other information – for stocks reported (with a 20 minute delay) by Yahoo. It strikes me that with minimal effort, one could reproduce TXPR (using the defined basket of CPD) and update the index at the touch of a button, with minimal set-up time required.

The Gummy Stuff website, by the way, is reliable AS FAR AS IT GOES. Dr. Ponzo is math-oriented to a much greater degree than investment-oriented and does not always respect hallowed fixed income market conventions. In other words, I have found that things are properly calculated in accordance with the (usually stated) assumptions, but these assumptions are not necessarily the ones I might make when performing a calculation with the same purpose.

With respect to Kaspu‘s question about other indices … the latest CPD literature references the “Desjardins Preferred Share Universe Index”, which is new to me … and I have no further information. Claymore may be preparing for a showdown with the TSX about licensing fees (you should find out what they want for DEX bond data … it’s a scandal).

Additionally, there is the BMO Capital Markets “50” index, but that is available only to Nesbitt clients … maybe at a library, if you have a really good one nearby that gets their preferred share reports.

Update, 2008-5-1: “Gummy” has announced a spreadsheet that does exactly this! Just watch out for dividend ex-Dates!

Index Performance : March 2008

Tuesday, April 1st, 2008

Performance of the HIMIPref™ Indices for March, 2008, was:

Total Return
Index Performance
March 2008
Three Months
to
March 31, 2008
Ratchet +0.79% +2.84%
FixFloat +0.64% +1.31%
Floater -1.09% +2.37%
OpRet -0.10% +0.74%
SplitShare -2.60% -0.63%
Interest +0.25% +3.26%
PerpetualPremium -1.57% -0.14%
PerpetualDiscount -4.93% -1.65%
Funds (see below for calculations)
CPD -2.90% -1.23%
DPS.UN -2.26% -0.79%
Index
BMO-CM 50 N/A
-2.79%
N/A
-0.31%

Claymore has published NAV data and Distribution Data for its exchange traded fund (CPD) and I have derived the following table:

CPD Return, 1- & 3-month, to March, 2008
Date NAV Distribution Return for Sub-Period Monthly Return
December 31, 2007 17.95      
January 31, 2008 17.95   0.00% 0.00%
February 29 18.34   +2.17% +2.17%
March 26 17.64 0.2082 -2.68% -2.90%
March 31, 2008 17.60   -0.23%
Quarterly Return -0.79%

The DPS.UN NAV for March 26 has been published so we may calculate the March returns (approximately!) for this closed end fund:

DPS.UN NAV Return, March-ish 2008
Date NAV Distribution Return for period
February 27, 2008 $21.47    
March 26, 2008 $21.00 $0.00 -2.19%
Adjustment for February stub-period +0.16%
Adjustment for March stub-period -0.23%
Estimated March Return -2.26%
CPD had a NAV of $18.37 on February 27 and $18.34 on February 29. The estimated February end-of-month stub period return for CPD was therefore -0.16%, which is subtracted from to the DPS.UN total return when estimating the return for March.
CPD had a NAV of $17.64 on March 26 and $17.60 on March 31. The estimated March end-of-month stub period return for CPD was therefore -0.23%, which is added to the DPS.UN total return when estimating the return for March.
Note that the DPS.UN distribution for March was done with a March 31 Record Date, therefore a March 27 Ex-Date

Now, to see the DPS.UN quarterly NAV approximate return, we refer to the calculations for January and February:

DPS.UN NAV Returns, three-month-ish to end-March-ish, 2008
January-ish -0.97%
February-ish +2.04%
March-ish -2.26%
Three-months-ish -1.23%

Update, 2008-4-2: BMOCM-50 Index updated. The March index was 0.35% above its November trough.

HIMIPref™ Index Rebalancing : March 2008

Tuesday, April 1st, 2008
HIMI Index Changes, March 31, 2008
Issue From To Because
CM.PR.D PerpetualPremium PerpetualDiscount Price
ENB.PR.A PerpetualPremium PerpetualDiscount Price
PWF.PR.E PerpetualPremium PerpetualDiscount Price
PWF.PR.H PerpetualPremium PerpetualDiscount Price
NA.PR.K PerpetualPremium PerpetualDiscount Price
BNS.PR.O PerpetualPremium PerpetualDiscount Price
POW.PR.C PerpetualPremium PerpetualDiscount Price
TCA.PR.X PerpetualPremium PerpetualDiscount Price
PWF.PR.G PerpetualPremium PerpetualDiscount Price
TCA.PR.Y PerpetualPremium PerpetualDiscount Price
BCE.PR.Y Scraps Ratchet Volume
BCE.PR.B Ratchet Scraps Volume

There were the following intra-month changes:

HIMI Index Changes during March 2008
Issue Action Index Because
AR.PR.B Delete Scraps Coverage Discontinued
TFS.PR.A Delete Scraps Redemption
ABK.PR.C Delete Scraps Redemption
BCE.PR.D Add Scraps Conversion

HIMIPref™ Index Rebalancing: February 2008

Tuesday, March 4th, 2008
HIMI Index Changes, February 29, 2008
Issue From To Because
TOC.PR.B Floater Scraps Volume
FAL.PR.B Scraps FixFloat Volume
MST.PR.A InterestBearing Scraps Volume
MUH.PR.A SplitShare Scraps Rating
PWF.PR.E PerpetualDiscount PerpetualPremium Price

To my shame, I must confess that MUH.PR.A should have been moved to “Scraps” as of the December month-end rebalancing. This will be fixed in the final version of the indices. 

There were no intra-month changes.