In today’s economy, the absence of bad news is greeted ecstatically:
Canada’s economy grew for a third month in August, cementing a rebound from an oil shock that had pulled the nation toward recession in the first half of this year.
Gross domestic product increased 0.1 percent to an annualized C$1.66 trillion ($1.26 trillion), Statistics Canada said Friday in Ottawa, following gains of 0.4 percent and 0.3 percent in June and July.
The August increase was led by manufacturing, which grew 0.4 percent to C$175 billion on production of chemicals and paper. Oil and gas extraction rose by 0.3 percent and retailing increased 0.6 percent led by food, automobiles and furniture.
…
Gross domestic product has grown 0.9 percent in August from the same month in 2014, Statistics Canada said.
According to my fingers and toes, these numbers are exceeded by inflation, but let’s ignore that and accentuate the positive! Like, for instance, what Canada does best:
Quebec plans to ask Canada’s federal government to match the province’s $1-billion (U.S.) investment in Bombardier Inc.’s C Series program to round out the funding for the troubled jet and assuage any lingering customer concerns.
“If the federal government comes in, the notion of risk completely changes,” Economy Minister Jacques Daoust said Friday in a telephone interview from Montreal. “If the federal government also put in $1 billion, that would mean the C Series financing package would be complete.”
His comments underscored Quebec’s determination to prop up the marquee aircraft model at Montreal-based Bombardier, which has been draining cash amid missed deadlines, cost overruns and scant interest among major airlines. Bombardier said Thursday that the jet will need an additional $2 billion during the next five years.
But let’s be fair, there are some exciting new businesses growing in Canada:
In granting Mr. Dhaliwal a conditional licence, Carolyn Rogers, head of the provincial Financial Institutions Commission, put the blame [for a mortgage fraud] on Mr. Dhaliwal’s former employer, TD Bank, for putting intense pressure on Mr. Dhaliwal, whom she described as poorly trained and financially naive.
What little coaching Mr. Dhaliwal received on how to properly conduct business, she wrote, “was overwhelmed by a focus on the volume of mortgage business Mr. Dhaliwal was bringing to the bank and relentless pressure to sell creditor protection insurance to as many borrowers as possible.”
…
In an online presentation on fraud and identity theft from 2012, mortgage insurer Canada Guaranty notes that “one in 10 mortgage applications will have some element of fraud.” Credit bureau Equifax says it had been able to flag nearly $1-billion worth of attempted mortgage fraud among its lender clients since 2013.“It’s happening on such a level that the consumer is aware that this is something that can be done,” says an Ontario mortgage broker who didn’t want his name used and who once complained to federal and provincial regulators after being referred a deal that involved a family looking to buy three homes without any reportable income. “It’s happening on such a level that some bank reps, mobile mortgage reps, have said: Call a mortgage broker, they can probably find a way to make your income higher.”
…
Equifax has noticed the trend of people coming into its offices looking to upgrade their credit score with new employment details using fake job letters. “They’ll use the same template which has the same words spelled incorrectly,” says John Russo, Equifax’s legal counsel and chief privacy officer. Such attempts at “soft fraud” are up 15 to 20 per cent this year, he says. “We’ve seen many instances, in the thousands, come across our desks.”
The Fed has published a bail-in debt rule for comment:
However, several features distinguish eligible internal LTD [Long Term Debt] from eligible external LTD: It would be required to be issued to a parent foreign entity that controls the covered IHC [Intermediate Holding Company], to be contractually subordinated to all third-party liabilities of the covered IHC, and to include a contractual trigger pursuant to which the Board [Board of Governors of the Federal Reserve System] could require the covered IHC to cancel the eligible internal LTD or convert or exchange it into tier 1 common equity on a going-concern basis (that is, without the covered IHC’s entry into a resolution proceeding) if: (a) the Board determines that the covered IHC is “in default or in danger of default”; and (b) any of the following circumstances apply (i) the top-tier foreign banking organization or any subsidiary outside the United States is placed into resolution proceedings, (ii) the home country supervisory authority consents to the cancellation, exchange, or conversion, or does not object to the cancellation, exchange, or conversion following 48 hours’ notice, or (iii) the Board has made a written recommendation to the Secretary of the Treasury that the FDIC should be appointed as receiver of the covered IHC.
So the trigger is Fed fiat. This is very disappointing in light of the fact that:
In general, if a major U.S. bank holding company or non-bank financial company were to fail, it would be resolved under the U.S. Bankruptcy Code.17 Congress recognized, however, that such a company might fail under extraordinary circumstances that would prevent it from being resolved in bankruptcy without serious adverse effects on the financial stability of the United States. Title II therefore provides the Secretary of the Treasury, upon recommendation from other government agencies, with the authority to place a major financial company into an FDIC receivership, rather than bankruptcy.
A sensible feature of the proposal is:
Eligible external LTD would be required to be paid in and issued directly by the covered BHC [Bank Holding Company] itself—that is, by the banking organization’s top-tier holding company. Thus, debt instruments issued by a subsidiary would not qualify as eligible external LTD, even if they do qualify as regulatory capital.
So, presumably, the holding company can go bankrupt without affecting the operating subsidiaries.
It could be quite a significant market:
The largest U.S. banks would face a $120 billion total shortfall of long-term debt under a Federal Reserve proposal aimed at ensuring their failure wouldn’t hurt the broader financial system.
Banks such as Wells Fargo & Co. and JPMorgan Chase & Co. will be required to hold enough debt that could be converted into equity if they were to falter, according to a Fed rule that was approved by a unanimous vote on Friday. The Fed’s proposal, which applies to eight of the biggest U.S. banks, requires debt and a capital cushion equal to at least 16 percent of risk-weighted assets by 2019 and 18 percent by 2022.
Perhaps of greater ultimate import is today’s SEC announcement of rules to permit equity crowdfunding:
The new crowdfunding rules and forms will be effective 180 days after they are published in the Federal Register. The forms enabling funding portals to register with the Commission will be effective Jan. 29, 2016.
…
More specifically, the recommended rules would:
- • Permit a company to raise a maximum aggregate amount of $1 million through crowdfunding offerings in a 12-month period;
- • Permit individual investors, over a 12-month period, to invest in the aggregate across all crowdfunding offerings up to:
- ◦ If either their annual income or net worth is less than $100,000, than the greater of:
- ◾ $2,000 or
- ◾ 5 percent of the lesser of their annual income or net worth.
- ◦ If both their annual income and net worth are equal to or more than $100,000, 10 percent of the lesser of their annual income or net worth; and
- • During the 12-month period, the aggregate amount of securities sold to an investor through all crowdfunding offerings may not exceed $100,000.
Regrettably, as Commissioner Kara M. Stein points out approvingly, there is a requirement for deputized policemen:
Moreover, as the preamble makes clear, the Commission takes seriously the intermediary’s obligations to assess whether it may reasonably rely on the representations. To quote, “the specific steps an intermediary should take to determine whether it can rely on an issuer representation may vary, but should be influenced by and tailored according to the intermediary’s knowledge and comfort with each particular issuer.”[5] In short, an intermediary will need to do a little bit of work to gain confidence that the small business is what it says it is. Intermediaries will also need to develop written policies and procedures for how they will execute these obligations.
There are other incentives built into the structure of the law itself that should also encourage intermediaries to conduct some level of due diligence on issuers.[6] Thus, I am comfortable supporting the measured approach put forward today, and I look forward to seeing how market practice evolves. We may also learn from the examination work of the Commission staff and self-regulatory organizations (SRO) — one of the major benefits of utilizing regulated intermediaries. As we gain experience, we should be prepared to adjust requirements in this area.
But to compensate, she also highlights a rule recognizing the cash position of start-ups:
Surprising as it may seem, another challenge is how to protect crowdfunding investors when a business actually does well. Angel and venture investors are able to protect their interests through a variety of levers. However, the crowd may be unable, practically speaking, to negotiate for or utilize the same types of levers. As a result, the crowd could see its investments heavily diluted in follow-on offerings.
To address this, today’s rules give the crowd a little extra help by aligning the interests of the intermediary with that of the crowd. Specifically, the rules enable an intermediary to take a position in the issuer as compensation for the offering, provided that the securities it takes have the same terms, conditions, and rights as the crowd.[7] This approach has multiple benefits as it also responds to the demands of small businesses that wanted to be able to compensate intermediaries by allowing them to take a stake in the company.
Commissioner Luis Aguilar, who never saw paperwork he didn’t like also approves of deputy policemen:
Importantly, Regulation Crowdfunding also provides a framework to govern how Crowdfunding intermediaries—such as a registered broker-dealer or a funding portal—can conduct securities offerings. Because these intermediaries essentially act as “gatekeepers” for these offerings, this framework should provide additional investor protection. Moreover, since these gatekeepers are indispensable for making Crowdfunding viable, it is critical for the registration regime for funding portals to be ready as soon as today’s Crowdfunding rules go into effect.
Commissioner Michael S. Piwowar issued a dissenting statement:
A number of concerns have already been raised as to whether our rules are too restrictive or too burdensome. In fact, many of these restrictions are embedded in the statute itself. For instance, even if you are Warren Buffet or Bill Gates, you are limited to investing no more than $100,000 during any 12-month period in all crowdfunding investments.[4]
In other cases, the majority of the Commission has exercised discretion to make capital raising using crowdfunding even more difficult. In a change from the proposal, the rules will limit the ability to invest in crowdfunding opportunities based on the lesser of annual income or net worth. Because the majority of the Commission cannot trust ordinary Americans – the non-accredited investors – to be able to exercise appropriate judgment in how to spend or invest their resources, our rules will now place smaller limits on the amounts that can be invested.[5] Rather than actually protecting investors, these smaller limits will discourage legitimate companies from engaging in crowdfunding, while simultaneously encouraging less reputable actors to use affinity-based solicitation methods akin to multi-level marketing, a development that could stifle crowdfunding efforts.
…
Throughout this process, our staff put in an incredible amount of effort on these important issues and I commend their exceptionally fine work. The original draft of the crowdfunding rules was consistent with the statute and the original draft to modernize Rule 147 and Rule 504 was thoughtful and sensible. I also acknowledge the extensive interest and involvement of the state securities regulators and the North American Securities Administrators Association, which helped to shape the staff’s work.This collaboration resulted in two perfect alley-oop passes to the Commission for seemingly can’t-miss slam dunks. However, the majority of the Commission decided to take a few extra unnecessary steps on the crowdfunding rules and the Rule 147 proposal and overshot on both.
For these reasons, I am unable to support the two items we are voting on today. Thank you and I have no questions.
Isn’t the US system great? Look at that … commissioners disagreeing with each other publicly and not mincing their words in public statements while they’re at it. We need this culture in Canada.
Portugal has announced a new defence to economic criticism:
Portuguese prosecutors have asked for Canadian academic Peter Boone to be put on trial after he wrote articles predicting a debt crisis in Portugal similar to Greece’s and then, they say, made nearly $1-million from price moves in that market.
…
Portuguese bond yields started to spike in April 2010 and forced the country to request an international bailout a year later, which it exited last year after stringent austerity measures that put public finances on a stronger footing.The Lisbon District Prosecutor’s Office said that after a long investigation it had decided to ask for criminal proceedings against the suspect for market manipulation. A judge would have to evaluate the case before any trial is set.
The prosecution says it has evidence that the suspect had a vested interest in Portuguese debt weakening “as only such depreciation allowed the closing of a short position with gains to crystallise his profit” of 819,099.82 euros.
S&P had some things to say about the Valeant/Philidor scandal:
- •Valeant Pharmaceuticals International Inc. has severed ties with its affiliate, specialty pharmacy network Philidor RX Services, after leading pharmacy benefit managers (PBMs) terminated their relationships with Philidor, citing noncompliance with the terms of their agreements.
- •We believe reports of wrongdoing at Philidor weakens Valeant management’s credibility, further harms the company’s already tarnished reputation,
and that these developments exacerbate potential legal, regulatory, and reputational headwinds for the company. We also believe the reputational issues could potentially compromise the company’s ability to effectively market its products to doctors, beyond this channel.- •We are lowering our ratings by one notch, including lowering the corporate credit rating to ‘B+’ from ‘BB-‘. Our rating outlook is negative. We are lowering the rating on the senior secured debt to ‘BB’ from ‘BB+’ and lowering the rating on the senior unsecured debt to ‘B-‘ from ‘B’.
- •The negative outlook reflects heightened uncertainty relating to the financial impact from reputational, legal, and regulatory risks associated with the company’s aggressive marketing and drug pricing strategies, as well as potential legal and credibility issues stemming from the lack of earlier disclosure about its relationship with Philador. At the same time, we believe the company can likely absorb these headwinds at the current rating.
There’s been a nice breakthrough in battery technology:
Scientists have developed a working laboratory demonstrator of a lithium-oxygen battery which has very high energy density, is more than 90% efficient, and, to date, can be recharged more than 2000 times, showing how several of the problems holding back the development of these devices could be solved.
…
However, as is the case with other next-generation batteries, there are several practical challenges that need to be addressed before lithium-air batteries become a viable alternative to gasoline.Now, researchers from the University of Cambridge have demonstrated how some of these obstacles may be overcome, and developed a lab-based demonstrator of a lithium-oxygen battery which has higher capacity, increased energy efficiency and improved stability over previous attempts.
Their demonstrator relies on a highly porous, ‘fluffy’ carbon electrode made from graphene (comprising one-atom-thick sheets of carbon atoms), and additives that alter the chemical reactions at work in the battery, making it more stable and more efficient. While the results, reported in the journal Science, are promising, the researchers caution that a practical lithium-air battery still remains at least a decade away.
Naturally, this work was not done in Ontario. We blew the budget on not-ready-for-prime-time technology.
New York’s hotels are showing us all how to compete effectively:
Airbnb accounted for $451.4 million in gross revenue in New York alone in the 12 months through Aug. 31, according a report commissioned by the Hotel Association of New York City. That number will jump to $805.3 million in 2018, the group said Friday.
…
Airbnb accounted for 2.9 million, or 7.8 percent, of overnight stays in New York in the latest fiscal year, compared with 33.9 million, or 92 percent, of nightly rentals among hotels, according to the Hotel Association of New York City. Yet hotels brought in a larger portion of sales — 95 percent of gross revenue, or $9.4 billion, thanks to a higher average cost per room.
…
While Airbnb’s share might seem small, consider that the startup didn’t exist seven years ago. It’s now valued at $25.5 billion and enmeshed in a political fight in New York, where the attorney general has scrutinized rentals on Airbnb and pressed the company to crack down on rentals that are run more like unregulated hotels. In its hometown of San Francisco, Airbnb is facing a vote next week on a proposition that would impose regulations and cap rentals at 75 days a year.The Hotel Association of New York City has donated $25,000 to an organization supporting San Francisco’s Proposition F. Airbnb’s internal polling shows the company leading the measure by 19 percentage points.
Maybe they should hire some consultants from Canada’s banking industry! The most important thing is the effective display of crocodile tears when talking about the burden of regulation.
It was yet another mixed day in a familiar pattern in the Canadian preferred share market, with PerpetualDiscounts up 24bp, FixedResets off 38bp and DeemedRetractibles gaining 10bp. A very lengthy Performance Highlights table is dominated by losers. Volume was average.
For as long as the FixedReset market is so violently unsettled, I’ll keep publishing updates of the more interesting and meaningful series of FixedResets’ Implied Volatilities. This doesn’t include Enbridge because although Enbridge has a large number of issues outstanding, all of which are quite liquid, the range of Issue Reset Spreads is too small for decent conclusions. The low is 212bp (ENB.PR.H; second-lowest is ENB.PR.D at 237bp) and the high is a mere 268 for ENB.PF.G.
Remember that all rich /cheap assessments are:
» based on Implied Volatility Theory only
» are relative only to other FixedResets from the same issuer
» assume constant GOC-5 yield
» assume constant Implied Volatility
» assume constant spread
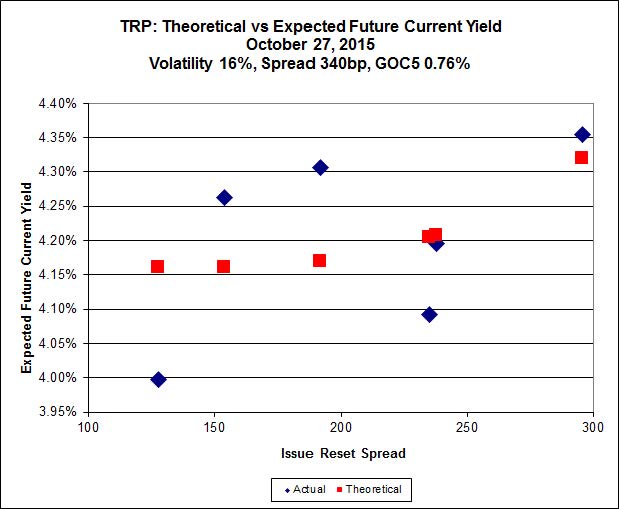
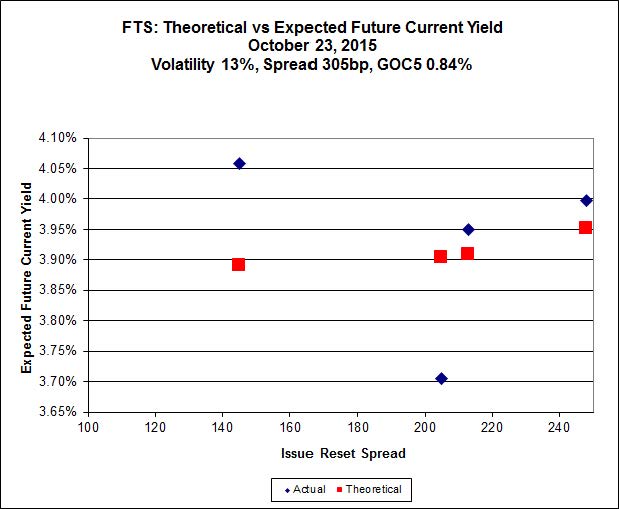
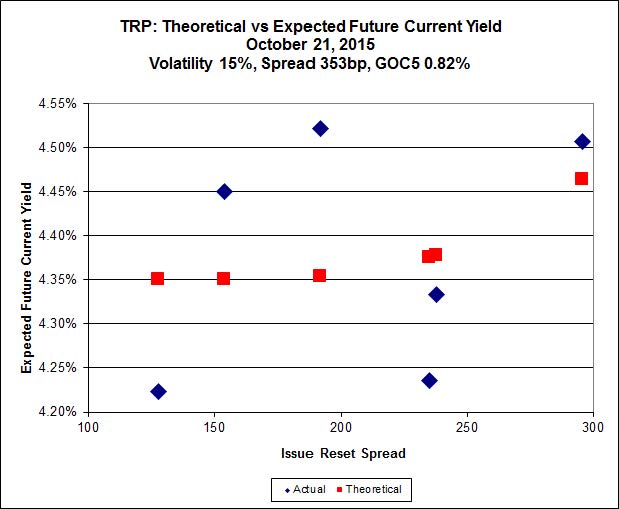
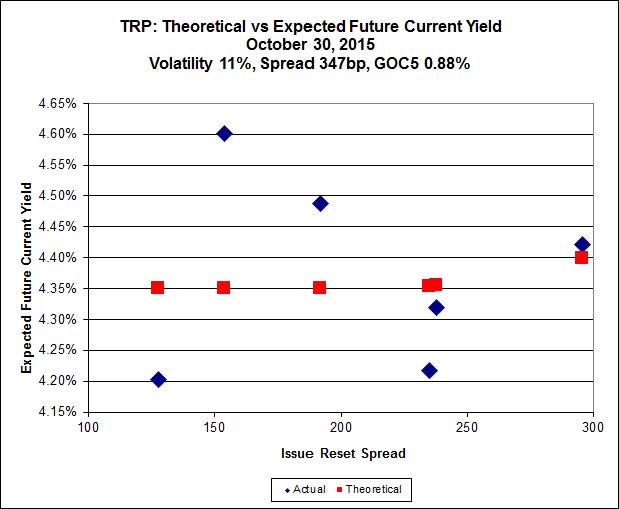
Here’s TRP:
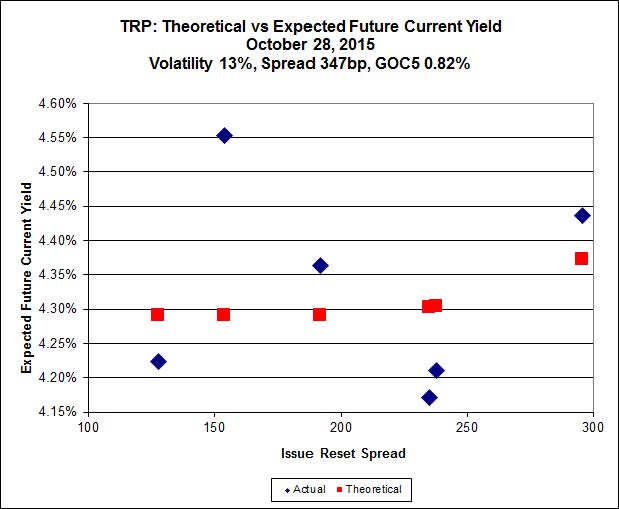
Click for Big
TRP.PR.E, which resets 2019-10-30 at +235, is bid at 19.15 to be $0.60 rich, while TRP.PR.C, resetting 2016-1-30 at +154, is $0.76 cheap at its bid price of 13.15.
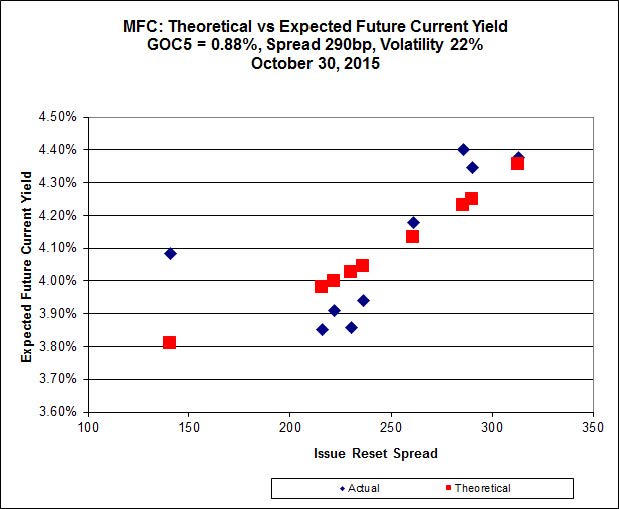
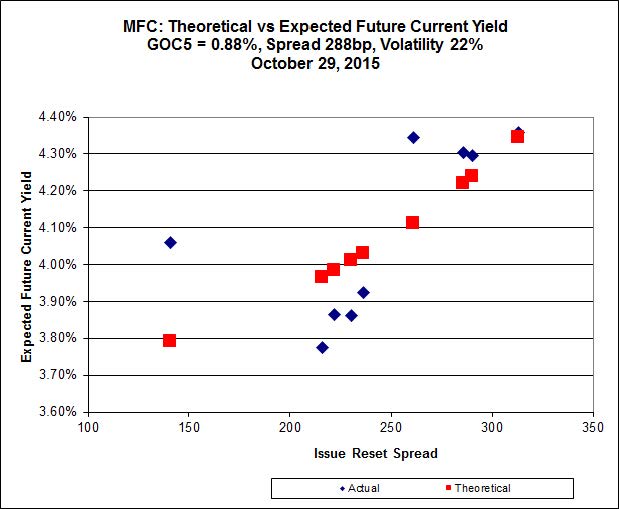
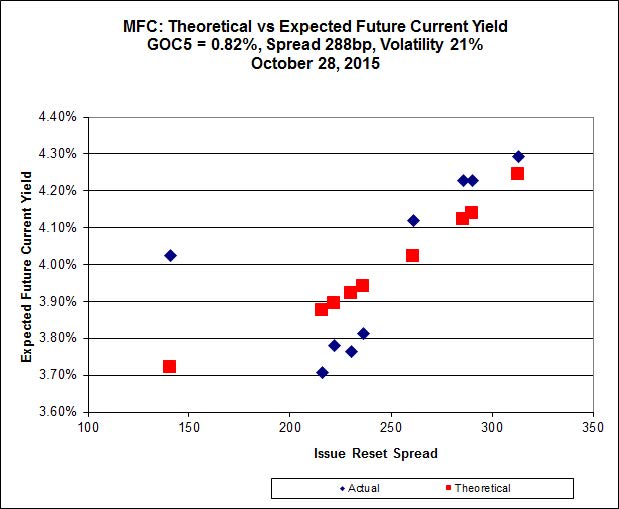
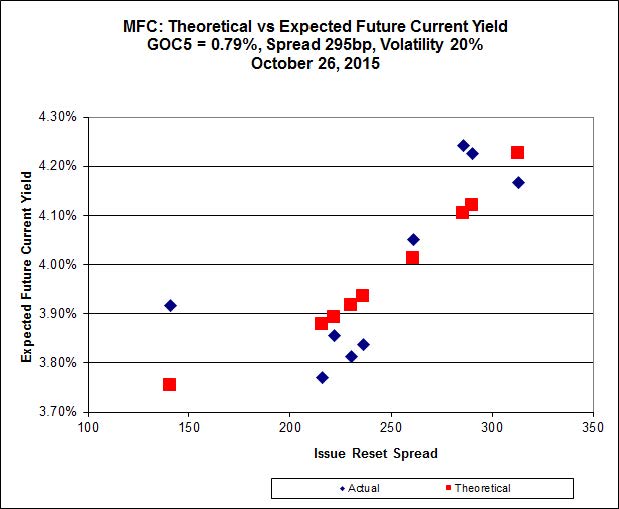
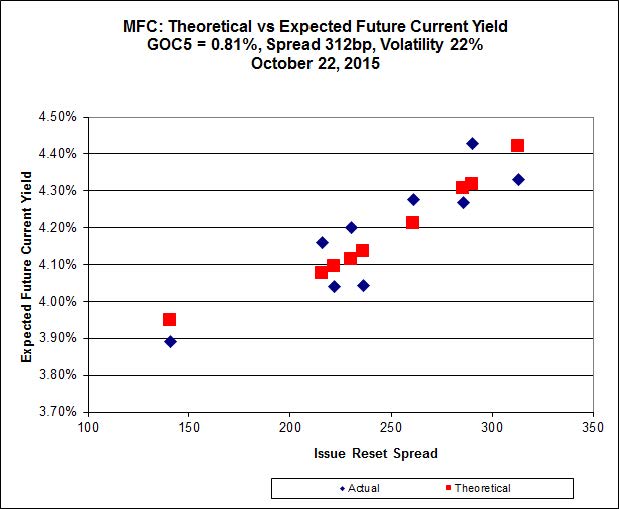
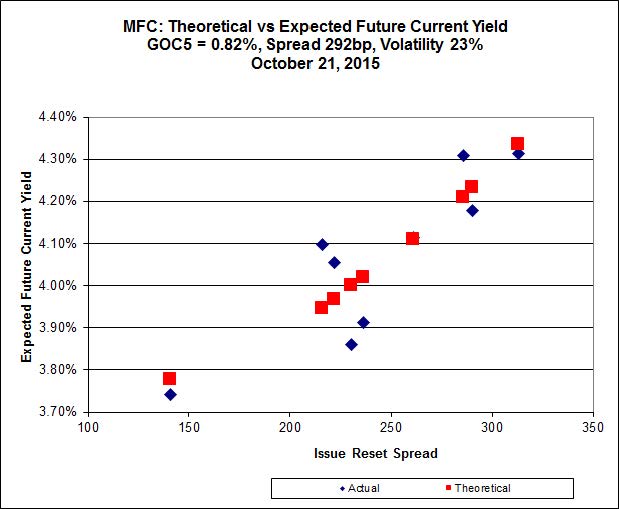
Click for Big
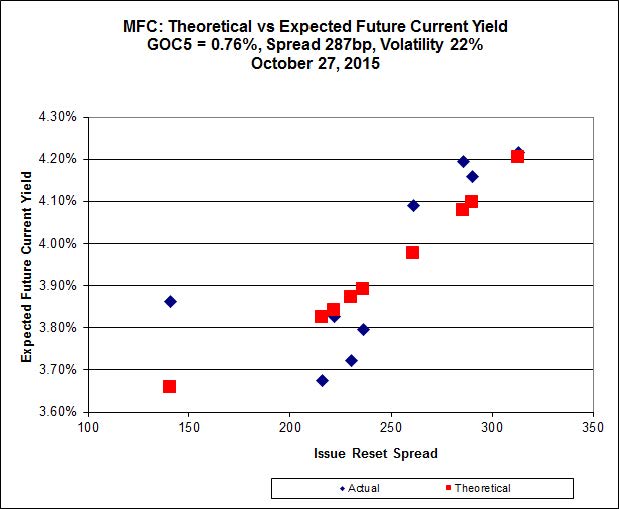
Most expensive is MFC.PR.N, resetting at +230bp on 2020-3-19, bid at 20.60 to be 0.86 rich, while MFC.PR.F resetting at +141bp on 2016-6-19, is bid at 14.02 to be 1.01 cheap.
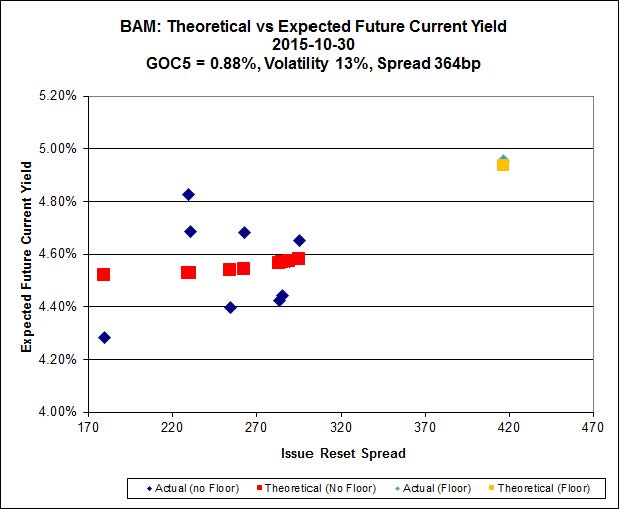
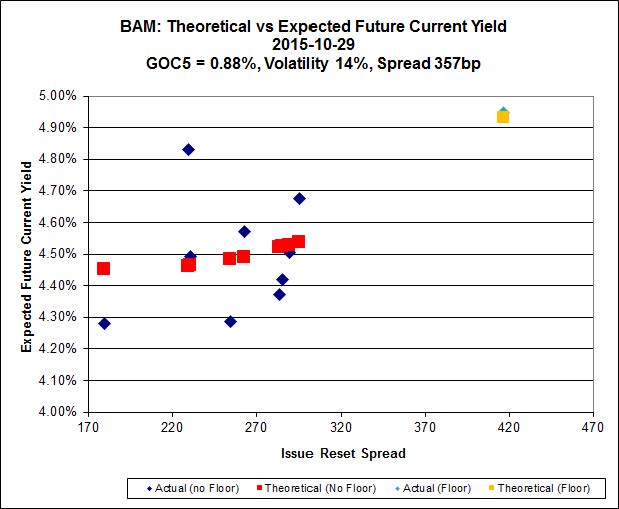
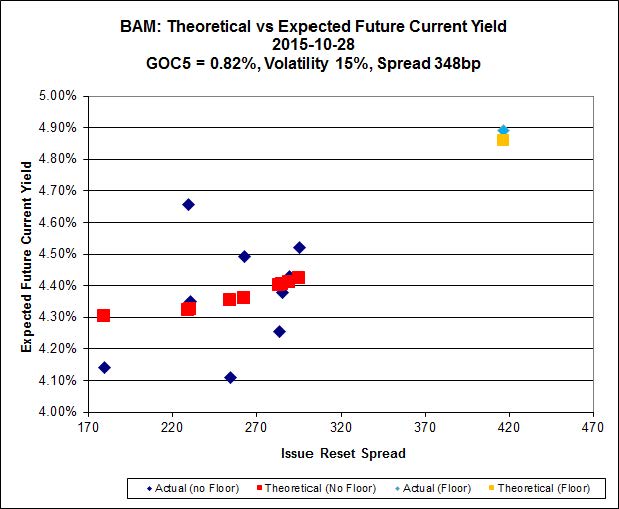
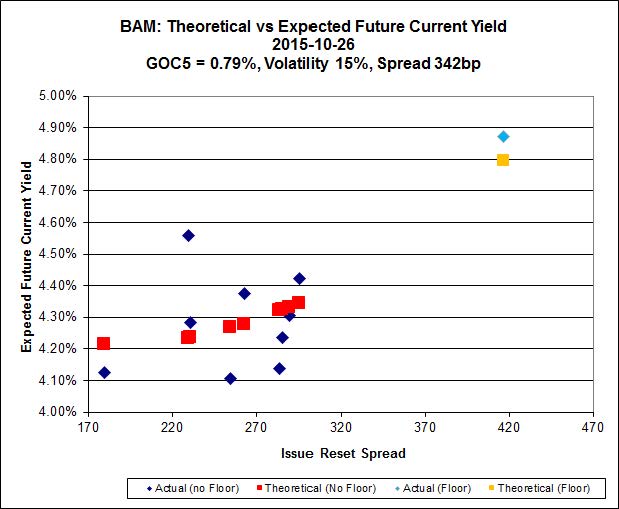
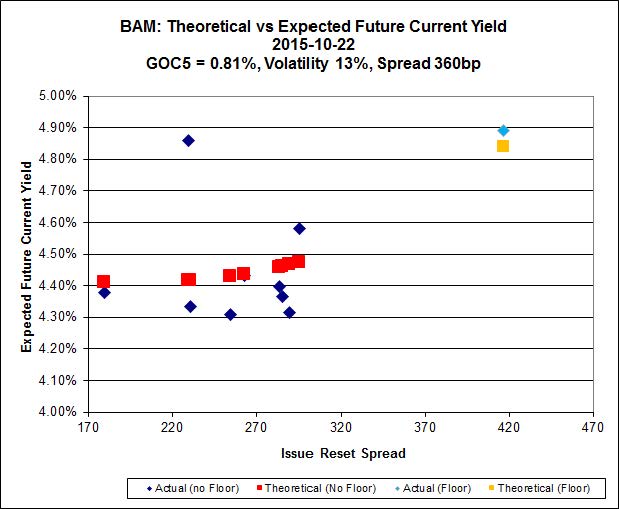
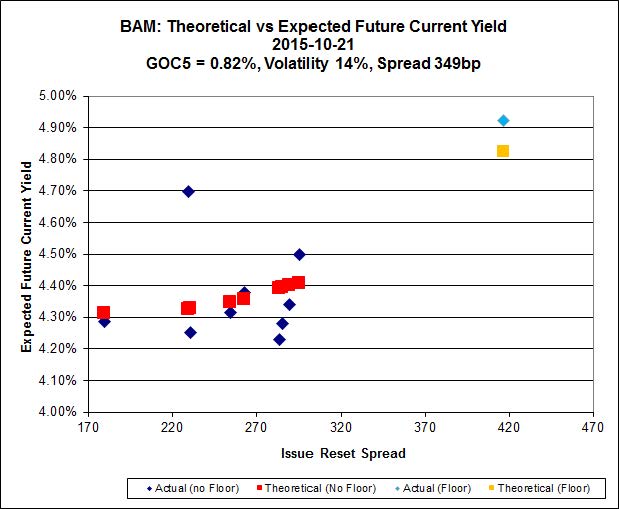
Click for Big
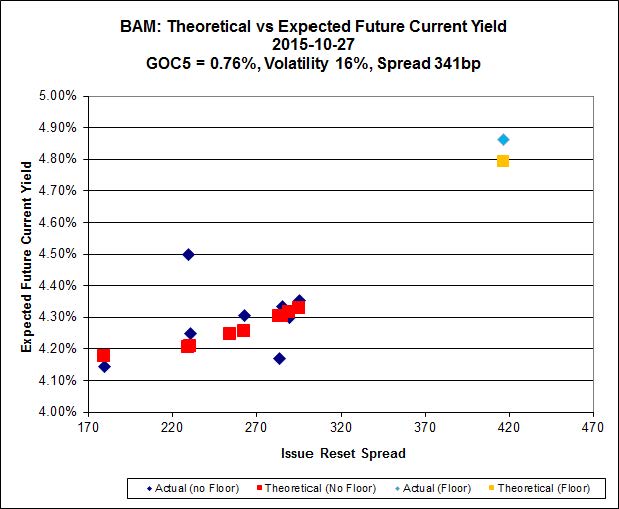
The cheapest issue relative to its peers is BAM.PR.R, resetting at +230bp on 2016-6-30, bid at 16.47 to be $1.10 cheap. BAM.PR.X, resetting at +180bp on 2017-6-30 is bid at 15.65 and appears to be $0.83 rich.
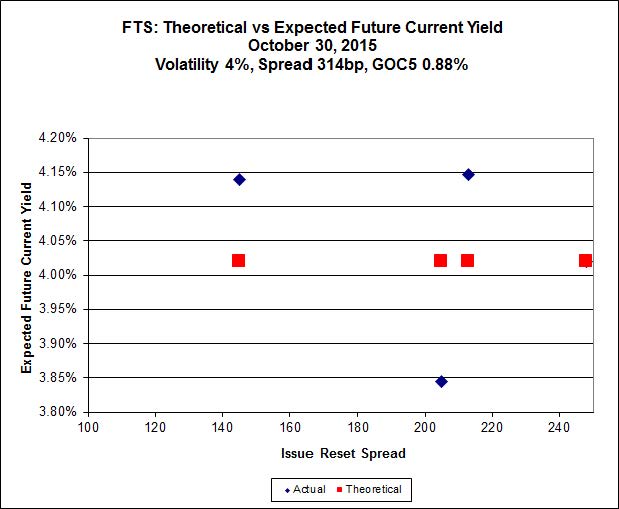
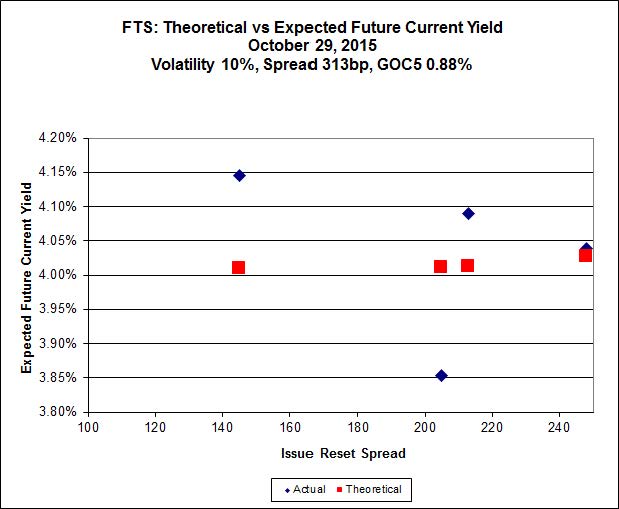
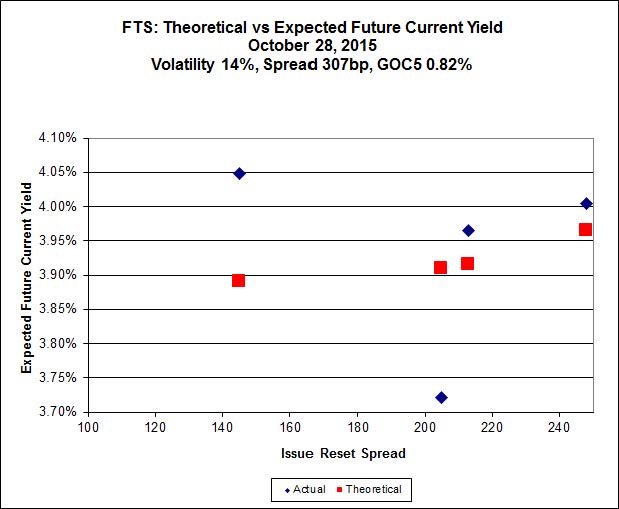
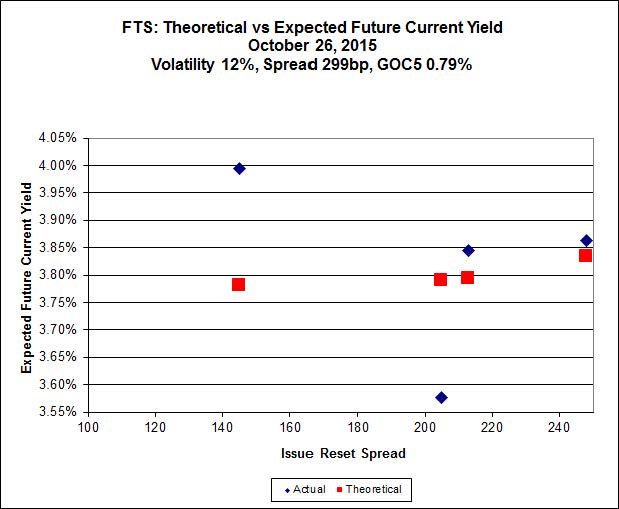
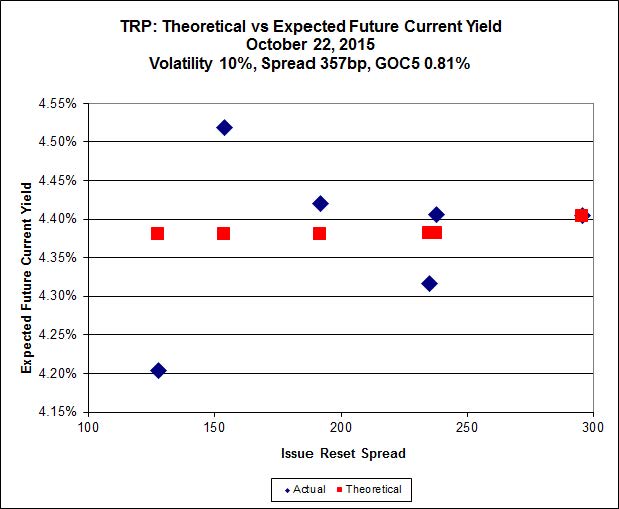
Click for Big
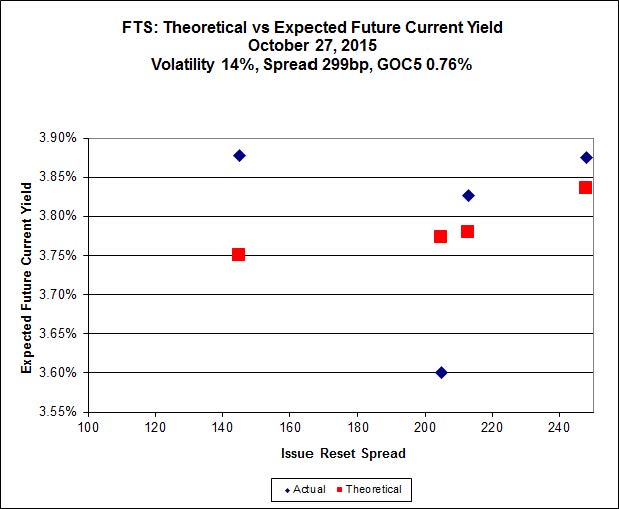
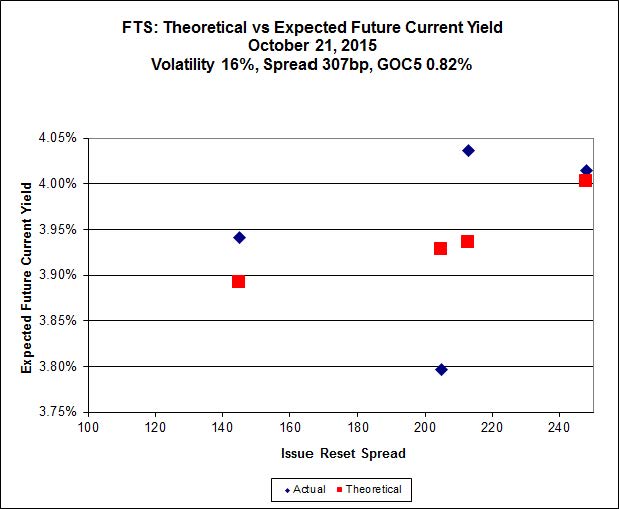
FTS.PR.K, with a spread of +205bp, and bid at 19.05, looks $0.83 expensive and resets 2019-3-1. FTS.PR.G, with a spread of +213bp and resetting 2018-9-1, is bid at 18.15 and is $0.57 cheap.
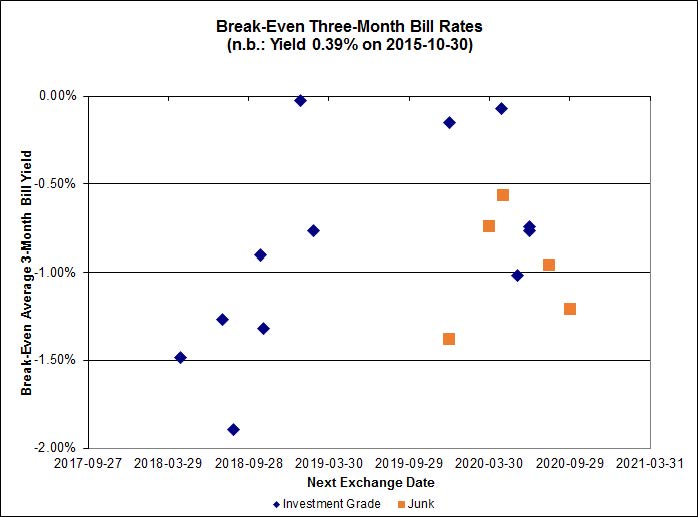
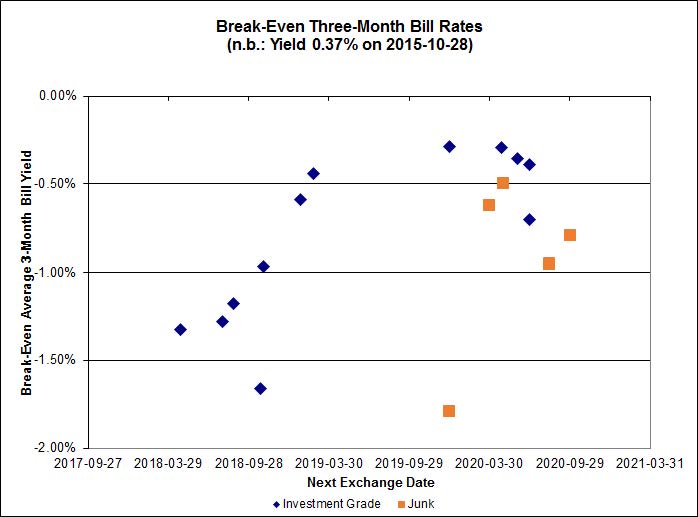
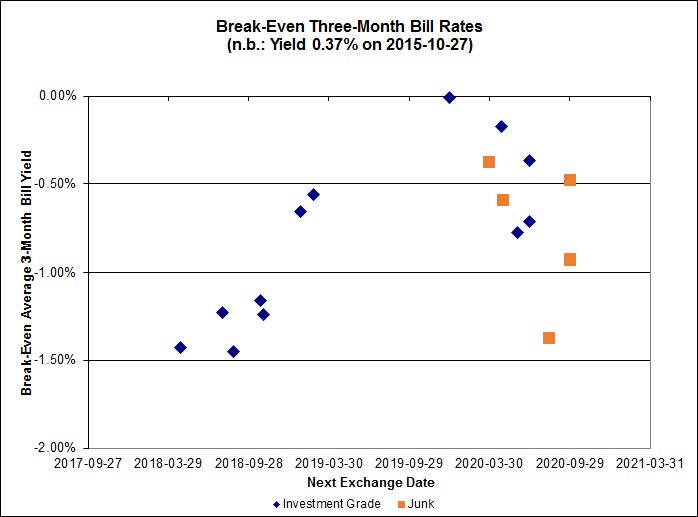
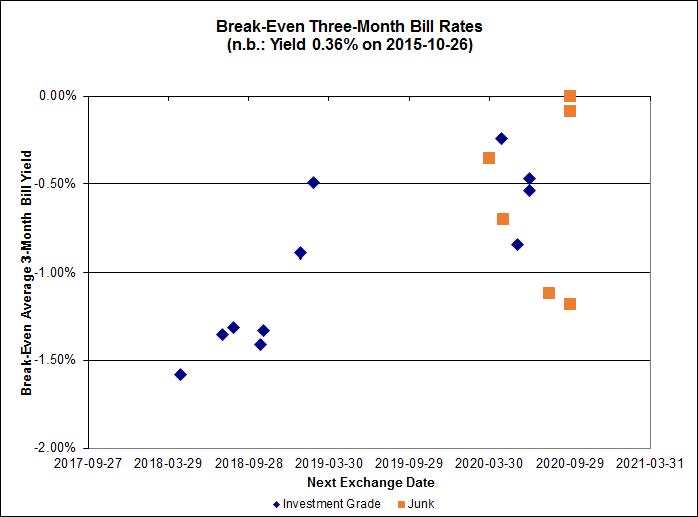
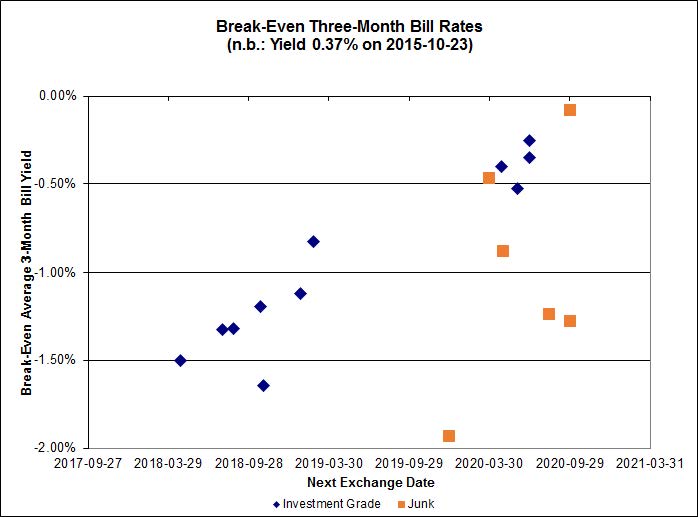
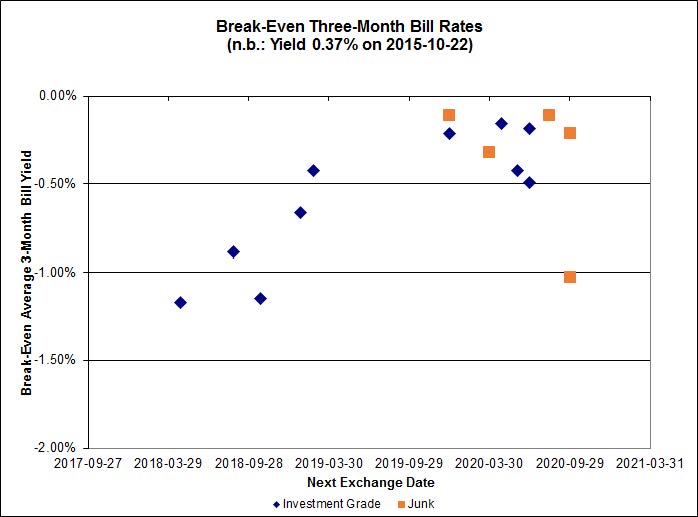
Click for Big
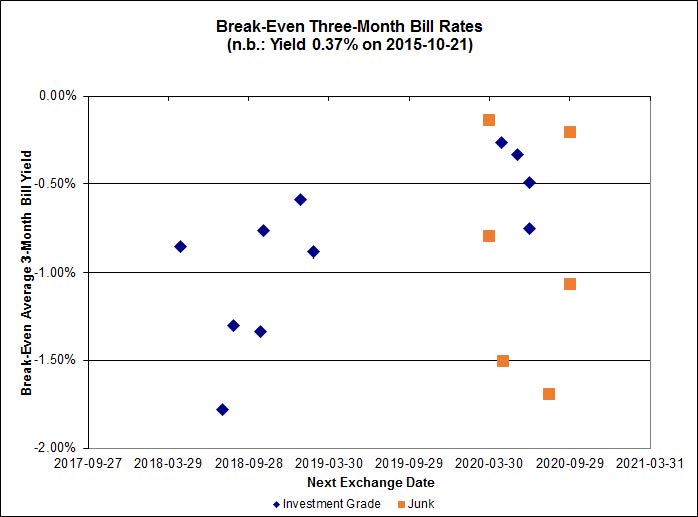
Investment-grade pairs predict an average three-month bill yield over the next five-odd years of -0.87%, with no outliers. The distribution is bimodal, with bank NVCC non-compliant pairs averaging -0.97% and other issues averaging -0.67%. There are four junk outliers above 0.00% and one below -2.00%.

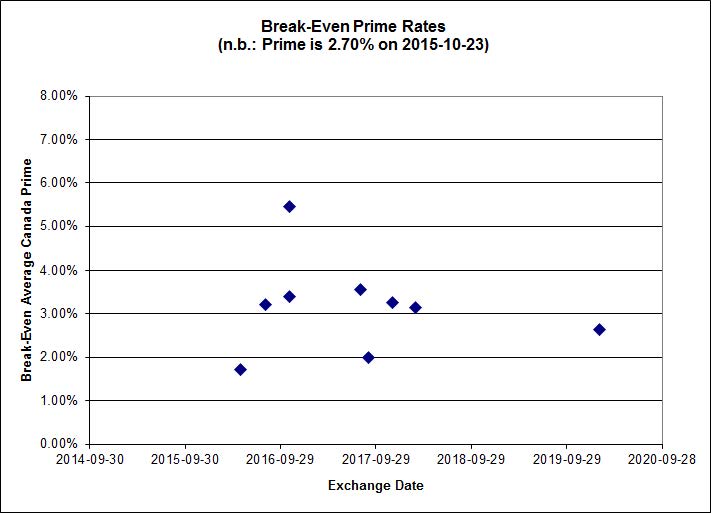
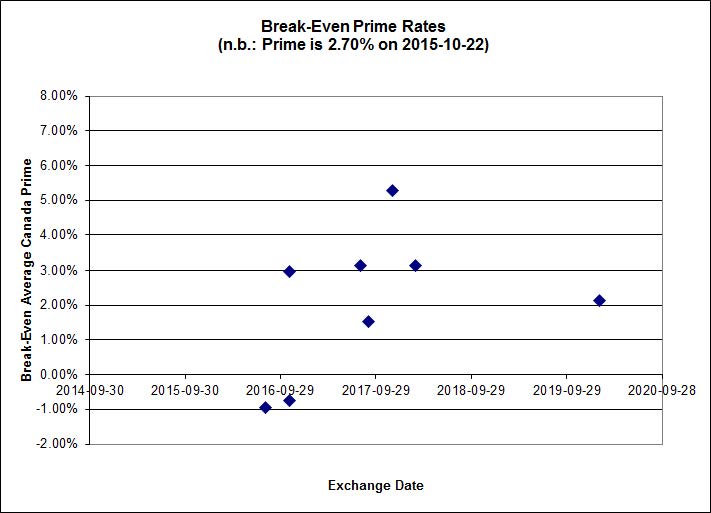
Click for Big
Shall we just say that this exhibits a high level of confidence in the continued rapacity of Canadian banks?
| HIMIPref™ Preferred Indices These values reflect the December 2008 revision of the HIMIPref™ Indices Values are provisional and are finalized monthly |
|||||||
| Index | Mean Current Yield (at bid) |
Median YTW |
Median Average Trading Value |
Median Mod Dur (YTW) |
Issues | Day’s Perf. | Index Value |
| Ratchet | 0.00 % | 0.00 % | 0 | 0.00 | 0 | -0.3311 % | 1,735.1 |
| FixedFloater | 0.00 % | 0.00 % | 0 | 0.00 | 0 | -0.3311 % | 3,033.7 |
| Floater | 4.28 % | 4.31 % | 62,536 | 16.77 | 3 | -0.3311 % | 1,844.5 |
| OpRet | 0.00 % | 0.00 % | 0 | 0.00 | 0 | -0.3808 % | 2,719.7 |
| SplitShare | 4.60 % | 5.52 % | 91,266 | 2.93 | 6 | -0.3808 % | 3,187.3 |
| Interest-Bearing | 0.00 % | 0.00 % | 0 | 0.00 | 0 | -0.3808 % | 2,486.8 |
| Perpetual-Premium | 5.85 % | 5.62 % | 69,959 | 0.08 | 5 | 0.0080 % | 2,488.3 |
| Perpetual-Discount | 5.56 % | 5.66 % | 81,896 | 14.37 | 33 | 0.2418 % | 2,569.7 |
| FixedReset | 4.94 % | 4.39 % | 213,655 | 15.63 | 76 | -0.3775 % | 2,069.6 |
| Deemed-Retractible | 5.19 % | 5.15 % | 112,436 | 5.45 | 33 | 0.0980 % | 2,575.8 |
| FloatingReset | 2.47 % | 3.82 % | 61,101 | 5.82 | 9 | -0.0654 % | 2,170.7 |
| Performance Highlights | |||
| Issue | Index | Change | Notes |
| BAM.PR.T | FixedReset | -4.11 % | YTW SCENARIO Maturity Type : Limit Maturity Maturity Date : 2045-10-30 Maturity Price : 17.02 Evaluated at bid price : 17.02 Bid-YTW : 4.81 % |
| PWF.PR.P | FixedReset | -3.33 % | YTW SCENARIO Maturity Type : Limit Maturity Maturity Date : 2045-10-30 Maturity Price : 14.21 Evaluated at bid price : 14.21 Bid-YTW : 4.26 % |
| HSE.PR.E | FixedReset | -2.80 % | YTW SCENARIO Maturity Type : Limit Maturity Maturity Date : 2045-10-30 Maturity Price : 22.07 Evaluated at bid price : 22.60 Bid-YTW : 4.89 % |
| BAM.PF.E | FixedReset | -2.50 % | YTW SCENARIO Maturity Type : Limit Maturity Maturity Date : 2045-10-30 Maturity Price : 19.50 Evaluated at bid price : 19.50 Bid-YTW : 4.68 % |
| BAM.PF.B | FixedReset | -2.34 % | YTW SCENARIO Maturity Type : Limit Maturity Maturity Date : 2045-10-30 Maturity Price : 18.75 Evaluated at bid price : 18.75 Bid-YTW : 4.84 % |
| MFC.PR.I | FixedReset | -2.21 % | YTW SCENARIO Maturity Type : Hard Maturity Maturity Date : 2025-01-31 Maturity Price : 25.00 Evaluated at bid price : 21.25 Bid-YTW : 6.07 % |
| MFC.PR.L | FixedReset | -2.04 % | YTW SCENARIO Maturity Type : Hard Maturity Maturity Date : 2025-01-31 Maturity Price : 25.00 Evaluated at bid price : 19.73 Bid-YTW : 6.54 % |
| IFC.PR.C | FixedReset | -1.66 % | YTW SCENARIO Maturity Type : Hard Maturity Maturity Date : 2025-01-31 Maturity Price : 25.00 Evaluated at bid price : 18.90 Bid-YTW : 7.29 % |
| BNS.PR.Q | FixedReset | -1.46 % | YTW SCENARIO Maturity Type : Hard Maturity Maturity Date : 2022-01-31 Maturity Price : 25.00 Evaluated at bid price : 24.25 Bid-YTW : 3.61 % |
| BAM.PF.A | FixedReset | -1.43 % | YTW SCENARIO Maturity Type : Limit Maturity Maturity Date : 2045-10-30 Maturity Price : 20.68 Evaluated at bid price : 20.68 Bid-YTW : 4.68 % |
| FTS.PR.G | FixedReset | -1.36 % | YTW SCENARIO Maturity Type : Limit Maturity Maturity Date : 2045-10-30 Maturity Price : 18.15 Evaluated at bid price : 18.15 Bid-YTW : 4.30 % |
| BAM.PR.K | Floater | -1.34 % | YTW SCENARIO Maturity Type : Limit Maturity Maturity Date : 2045-10-30 Maturity Price : 11.05 Evaluated at bid price : 11.05 Bid-YTW : 4.31 % |
| TRP.PR.A | FixedReset | -1.27 % | YTW SCENARIO Maturity Type : Limit Maturity Maturity Date : 2045-10-30 Maturity Price : 15.60 Evaluated at bid price : 15.60 Bid-YTW : 4.62 % |
| IAG.PR.G | FixedReset | -1.21 % | YTW SCENARIO Maturity Type : Hard Maturity Maturity Date : 2025-01-31 Maturity Price : 25.00 Evaluated at bid price : 21.14 Bid-YTW : 6.06 % |
| BNS.PR.R | FixedReset | -1.18 % | YTW SCENARIO Maturity Type : Hard Maturity Maturity Date : 2022-01-31 Maturity Price : 25.00 Evaluated at bid price : 24.36 Bid-YTW : 3.78 % |
| MFC.PR.G | FixedReset | -1.14 % | YTW SCENARIO Maturity Type : Hard Maturity Maturity Date : 2025-01-31 Maturity Price : 25.00 Evaluated at bid price : 21.75 Bid-YTW : 5.71 % |
| BAM.PF.G | FixedReset | -1.13 % | YTW SCENARIO Maturity Type : Limit Maturity Maturity Date : 2045-10-30 Maturity Price : 21.03 Evaluated at bid price : 21.03 Bid-YTW : 4.63 % |
| MFC.PR.K | FixedReset | -1.10 % | YTW SCENARIO Maturity Type : Hard Maturity Maturity Date : 2025-01-31 Maturity Price : 25.00 Evaluated at bid price : 19.83 Bid-YTW : 6.38 % |
| CM.PR.P | FixedReset | -1.09 % | YTW SCENARIO Maturity Type : Limit Maturity Maturity Date : 2045-10-30 Maturity Price : 19.10 Evaluated at bid price : 19.10 Bid-YTW : 4.22 % |
| PVS.PR.D | SplitShare | -1.06 % | YTW SCENARIO Maturity Type : Hard Maturity Maturity Date : 2021-10-08 Maturity Price : 25.00 Evaluated at bid price : 23.35 Bid-YTW : 6.00 % |
| BAM.PR.N | Perpetual-Discount | 1.12 % | YTW SCENARIO Maturity Type : Limit Maturity Maturity Date : 2045-10-30 Maturity Price : 20.83 Evaluated at bid price : 20.83 Bid-YTW : 5.77 % |
| SLF.PR.J | FloatingReset | 1.50 % | YTW SCENARIO Maturity Type : Hard Maturity Maturity Date : 2025-01-31 Maturity Price : 25.00 Evaluated at bid price : 13.50 Bid-YTW : 9.33 % |
| TRP.PR.C | FixedReset | 1.70 % | YTW SCENARIO Maturity Type : Limit Maturity Maturity Date : 2045-10-30 Maturity Price : 13.15 Evaluated at bid price : 13.15 Bid-YTW : 4.49 % |
| TD.PF.E | FixedReset | 2.00 % | YTW SCENARIO Maturity Type : Limit Maturity Maturity Date : 2045-10-30 Maturity Price : 21.59 Evaluated at bid price : 21.93 Bid-YTW : 4.19 % |
| TRP.PR.G | FixedReset | 2.36 % | YTW SCENARIO Maturity Type : Limit Maturity Maturity Date : 2045-10-30 Maturity Price : 21.42 Evaluated at bid price : 21.71 Bid-YTW : 4.39 % |
| PWF.PR.T | FixedReset | 2.92 % | YTW SCENARIO Maturity Type : Limit Maturity Maturity Date : 2045-10-30 Maturity Price : 21.47 Evaluated at bid price : 21.47 Bid-YTW : 3.91 % |
| TRP.PR.B | FixedReset | 3.38 % | YTW SCENARIO Maturity Type : Limit Maturity Maturity Date : 2045-10-30 Maturity Price : 12.85 Evaluated at bid price : 12.85 Bid-YTW : 4.12 % |
| MFC.PR.J | FixedReset | 3.98 % | YTW SCENARIO Maturity Type : Hard Maturity Maturity Date : 2025-01-31 Maturity Price : 25.00 Evaluated at bid price : 20.88 Bid-YTW : 6.02 % |
| Volume Highlights | |||
| Issue | Index | Shares Traded |
Notes |
| PVS.PR.E | SplitShare | 121,330 | Recent new issue. YTW SCENARIO Maturity Type : Hard Maturity Maturity Date : 2022-10-31 Maturity Price : 25.00 Evaluated at bid price : 24.32 Bid-YTW : 6.01 % |
| RY.PR.Z | FixedReset | 80,294 | YTW SCENARIO Maturity Type : Limit Maturity Maturity Date : 2045-10-30 Maturity Price : 19.62 Evaluated at bid price : 19.62 Bid-YTW : 4.06 % |
| BNS.PR.Z | FixedReset | 57,435 | Desjardins crossed 50,000 at 20.50. YTW SCENARIO Maturity Type : Hard Maturity Maturity Date : 2022-01-31 Maturity Price : 25.00 Evaluated at bid price : 20.50 Bid-YTW : 5.75 % |
| TRP.PR.E | FixedReset | 41,272 | RBC crossed 12,000 at 19.48. YTW SCENARIO Maturity Type : Limit Maturity Maturity Date : 2045-10-30 Maturity Price : 19.15 Evaluated at bid price : 19.15 Bid-YTW : 4.44 % |
| TRP.PR.D | FixedReset | 40,718 | YTW SCENARIO Maturity Type : Limit Maturity Maturity Date : 2045-10-30 Maturity Price : 18.87 Evaluated at bid price : 18.87 Bid-YTW : 4.44 % |
| NA.PR.S | FixedReset | 35,353 | YTW SCENARIO Maturity Type : Limit Maturity Maturity Date : 2045-10-30 Maturity Price : 19.90 Evaluated at bid price : 19.90 Bid-YTW : 4.24 % |
| There were 35 other index-included issues trading in excess of 10,000 shares. | |||
| Wide Spread Highlights | ||
| Issue | Index | Quote Data and Yield Notes |
| BAM.PR.T | FixedReset | Quote: 17.02 – 17.80 Spot Rate : 0.7800 Average : 0.4590 YTW SCENARIO |
| BAM.PF.E | FixedReset | Quote: 19.50 – 20.35 Spot Rate : 0.8500 Average : 0.5648 YTW SCENARIO |
| TRP.PR.D | FixedReset | Quote: 18.87 – 19.45 Spot Rate : 0.5800 Average : 0.3922 YTW SCENARIO |
| IAG.PR.G | FixedReset | Quote: 21.14 – 21.62 Spot Rate : 0.4800 Average : 0.3444 YTW SCENARIO |
| MFC.PR.L | FixedReset | Quote: 19.73 – 20.10 Spot Rate : 0.3700 Average : 0.2465 YTW SCENARIO |
| W.PR.J | Perpetual-Discount | Quote: 24.31 – 24.70 Spot Rate : 0.3900 Average : 0.2715 YTW SCENARIO |