Greece finally shut down its banking system:
Greece moved to avert the collapse of its financial system, shutting lenders and imposing capital controls as of Monday, a measure that will deepen the recession and risk driving the nation toward an exit from the euro.
The move to husband resources followed the breakdown of aid talks with the international creditors late Friday and the European Central Bank decision to freeze its lifeline to Greek banks. On the streets, lines at ATMs and gas stations signified how daily life was about to be disrupted.
With cash flooding out at a record pace and its financial backstop gone, Greece would become the second euro-area country, after Cyprus in 2013, to declare a bank holiday and impose capital controls. European officials, meantime, discussed quarantining Greece from the rest of the currency bloc, while keeping it from spinning out of the euro’s orbit.
…
The optimism vanished after midnight on Friday when Tsipras shocked his counterparts across the region with his call for a July 5 referendum on the austerity demanded by creditors, just days before the June 30 expiry of the current bailout and a $1.7 billion payment due to the IMF.
In the aftermath, Greeks lined up this weekend to get access to as much of their money as they could. Two senior Greek bank executives said as many as 500 of the country’s more than 7,000 ATMs had run out of cash as of Saturday morning. Skai television reported as much as 1 billion euros ($1.1 billion) was withdrawn.
Greek bank deposits shrank by 30 billion euros between January and May this year to 129.9 billion euros, according to data released by Bank of Greece on its website on Thursday.
…
On Sunday night, long queues formed at numerous gas stations in Athens, reflecting doubts over the country’s ability to keep importing fuel. Lines at ATMs receded, as machines emptied.
That means that a Fairfax bet has gone bad:
Investors led by Canada’s Fairfax, which previously made successful bets on Bank of Ireland during the financial crisis, in April last year bought about 1.3 billion shares in Eurobank, according to the firm’s 2014 letter to shareholders. The stake amounts to about 9 percent of the share capital today and is valued at about 191 million euros. The shares are now worth less than half the 31 cents that investors in the share sale paid.
And there are various apocalyptic scenarios being touted:
It has the potential to prompt a Greek withdrawal from NATO, increase the influx of refugees into Europe and threaten Greek support for international sanctions against Russia over Ukraine.
“Greece spiraling into chaos would be a significant strategic disruption for Europe and therefore for the U.S.,” retired U.S. Admiral James Stavridis, a former NATO supreme allied commander, said in an interview. “There’s more to this crisis than money and the financial markets.”
…
If Greece ultimately is pushed off the euro currency for defaulting on its debt, it could seek revenge by pulling out of the North Atlantic Treaty Organization, blocking European Union sanctions on Russia or forcing the U.S. from its naval base in Crete, said Stavridis, a Greek-American who is dean of the Fletcher School of Law and Diplomacy at Tufts University in Massachusetts.
“A Greece that feels unloved and pushed out is less likely to be helpful” to the U.S. and Europe, he said.
But it’s an ill wind that blows nobody any good:
What is a crisis in Greece is an opportunity for Seamus Fahy 1,700 miles away in Dublin.
Fahy is offering a 15 percent discount for Greeks who want to store cash and valuables at Merrion Vaults, where 3,000 deposit boxes are protected underground in Dublin’s city center. He says he’s had about 20 Greek customers in recent months as concern mounted about how long the nation could stay in the euro region.
“If you lived in Athens, and had 200,000 euros, wouldn’t you try to get it out?” asks Fahy, a diamond dealer who opened the vaults in 2013, just off one of the city’s main Georgian-era squares, close to the Irish prime minister’s complex in Dublin.
But it’s no fun being Greek:
Uncertain what might happen next, with banks and financial markets closed, across Athens people wasted little time Monday, rushing to the nearest A.T.M. to withdraw their new daily maximum of 60 euros, determined to raise every last cent while they could.
…
Anecdotally, how people said they would vote in the referendum had little to do with those considerations, but broke down largely along lines of age and class. Older and more affluent Greeks leaned toward voting yes and younger and poorer Greeks leaned toward no, essentially as a protest of what they viewed as foreign oppression.
Whatever the outcome, Athenians were busy adapting to the new reality on Monday, focusing more on getting through the week than worrying too far into the future. People were emptying supermarket shelves, filling up containers at gas stations and lining up at automated teller machines, hoping that the supply of hard cash would not run out before it was their turn.
Meanwhile Element Financial, proud issuer of EFN.PR.A, EFN.PR.C, EFN.PR.E and EFN.PR.G, has bought another automobile fleet operation:
Canada’s Element Financial Corp said it will buy General Electric Co’s fleet management operations in the United States, Mexico, Australia and New Zealand for $8.6-billion ($6.98-billion (U.S.) in cash.
GE also signed a memorandum of understanding to sell its European fleet businesses to Arval, a fully-owned subsidiary of BNP Paribas.
Reuters reported on Friday that Element was close to buying a large chunk of GE’s vehicle fleet management business.
GE has said the business includes $9-billion in assets. The sale would be part of a plan it unveiled in April to divest about $200 billion in GE Capital assets as it moves away from finance and focuses on manufacturing industrial equipment.
… and that’s just a start:
Element Financial Corp.’s $8.6-billion acquisition of part of General Electric Co.’s fleet management business is not the end of the company’s growth plans, according to chief executive Steve Hudson, who went so far as to name his next acquisition targets.
“This message of growth at Element is: It’s not over, it’s not over, it’s not over,” said Mr. Hudson, on a conference call with analysts Monday. “They say you have to say something three times,” he added.
None of the EFN issues are tracked by HIMIPref™ because they don’t have a credit rating. With any luck that will change in the future as they visit the capital markets more often. A credit rating is important because the threat of a highly visible public spanking serves to concentrate the minds of management and the board.
I am pleased to see that the US is slowly grinding towards T+2 settlement:
Recently, an industry-led committee of members across the securities industry issued a white paper outlining the timeline and actions required to move from a three-day (T+3) trade settlement cycle to a two-day (T+2) trade settlement cycle for securities transactions in the United States by the third quarter 2017.[1] We applaud industry’s leadership in seeking changes to mitigate risks and improve capital efficiency.
Earlier this year, the Commission’s Investor Advisory Committee encouraged the Commission and market participants to move forward on reducing the settlement cycle, which would improve investor protections and reduce systemic risks.[2]
We look forward to working with our fellow Commissioners and the staff, as well as partnering with market participants to shorten the settlement cycle as soon as possible.
Footnotes:
[1] See “Shortening the Settlement Cycle: The Move to T+2” available at LINK. Currently, the Commission’s rules require settlement of trades in equities, corporate and municipal bonds, and unit investment trusts (UIT) three business days after a trade is executed, which is commonly referred to as T+3. Trade settlement is the date upon which security ownership transfers.
[2] See “Recommendation of the Investor Advisory Committee: Shortening the Trade Settlement Cycle in U.S. Financial Markets (February 12, 2015)” available at LINK.
I’ve been advocating for T+1 for over twenty years now. I mean, just what exactly is the problem? Everything’s electronic, it’s not like we have to send guys rooting through the vaults for street name certificates any more. Shorter settlement will decrease exposure to counterparty bankruptcy.
The next obvious step is allowing all investment managers to instruct custodians electronically. A username + password is no easier to forge than a signature and all but a very small part of the volume can be subjected to a sanity check.
Alberta is increasing its minimum wage:
Alberta, one of the lowest payers of minimum wage in Canada, is becoming one of the highest.
Jobs Minister Lori Sigurdson announced Monday that the $10.20 per hour minimum wage will rise by $1 to $11.20 an hour on Oct. 1.
…
Sigurdson said the decision was as much about social policy as economics.
“We believe minimum wage should at least allow people to meet their basic needs,” Sigurdson told reporters.
“Paying people a decent minimum wage will translate into a better life for low-income workers and, as a result, a better life for their families and for all Albertans.”
She also said the NDP government remains on track to hike the rate to $15 an hour by 2018, in keeping with its campaign promise in the May 5 election.
Super, although the rationale is nonsensical. Alberta’s productivity growth is a disgrace:
Labour productivity growth in Ontario’s business sector in the 2000-2012 period, at 0.5 per cent per year, was the second lowest among the provinces, higher only than Alberta’s annual growth rate of 0.4 per cent (Chart II).
…
It is well known that Canada’s labour productivity gap with the United States has widened significantly (Baldwin and Gu, 2009). This is also true for Ontario. In real terms, labour productivity in Ontario’s business sector declined relative to the United States from 88.3 per cent in 1987 to 71.6 per cent in 2012.
Labour productivity growth in Ontario’s business sector was only one-third of the U.S. average over the 2000-2012 period (0.5 per cent versus 1.6 per cent). All eight Great Lake states (Illinois, Indiana, Michigan, New York, Ohio, Minnesota, Pennsylvania, and Wisconsin) had considerably stronger labour productivity growth than Ontario.
A higher minimum wage will force increased automation on marginal companies, or they’ll go bankrupt and good riddance. A reliance on cheap labour and favourable exchange rates is no way for Canadians to get rich.
Brookfield Renewable Energy Partners L.P., proud (indirect) issuer of BRF.PR.A, BRF.PR.B, BRF.PR.C, BRF.PR.E and BRF.PR.F, has followed up its June 23 announcement of a Normal Course Issuer Bid by announcing:
that, in connection with Brookfield Renewable Power Preferred Equity Inc.’s (“BRP Equity”) previously announced normal course issuer bid program, BRP Equity has entered into an automatic purchase plan with its designated broker to allow for purchases of its Series 1 Class A Preference Shares, Series 2 Class A Preference Shares and Series 3 Class A Preference Shares. The plan will commence on July 1, 2015 and terminate on August 6, 2015.
From time to time, when BRP Equity does not possess material non-public information about itself or its securities, it may enter into automatic purchase plans with its broker to allow for the purchase of preferred shares at times when BRP Equity ordinarily would not be active in the market due to its own internal trading blackout periods and insider trading rules. Any such plans entered into with BRP Equity’s broker will be adopted in accordance with the requirements of applicable Canadian securities laws. The series of preferred shares subject to an automatic purchase plan may vary. Outside of these periods, preferred shares will be repurchased in accordance with management’s discretion, subject to applicable law.
I haven’t seen one of these before and must confess I don’t know exactly how they work. But it would seem to indicate that the company is more serious about its NCIB than issuers usually are.
It was a violently mixed day for the Canadian preferred share market, with PerpetualDiscounts down 38bp, FixedResets off 28bp and DeemedRetractibles gaining 34bp. FixedResets dominated a very lengthy Performance Highlights table (on the bad side), joined by a healthy dollop of PerpetualDiscounts; SLF DeemedRetractibles were a feature of the good part of the table, although I can’t think why. Volume was very high.
For as long as the FixedReset market is so violently unsettled, I’ll keep publishing updates of the more interesting and meaningful series of FixedResets’ Implied Volatilities. This doesn’t include Enbridge because although Enbridge has a large number of issues outstanding, all of which are quite liquid, the range of Issue Reset Spreads is too small for decent conclusions. The low is 212bp (ENB.PR.H; second-lowest is ENB.PR.D at 237bp) and the high is a mere 268 for ENB.PF.G.
Remember that all rich /cheap assessments are:
» based on Implied Volatility Theory only
» are relative only to other FixedResets from the same issuer
» assume constant GOC-5 yield
» assume constant Implied Volatility
» assume constant spread
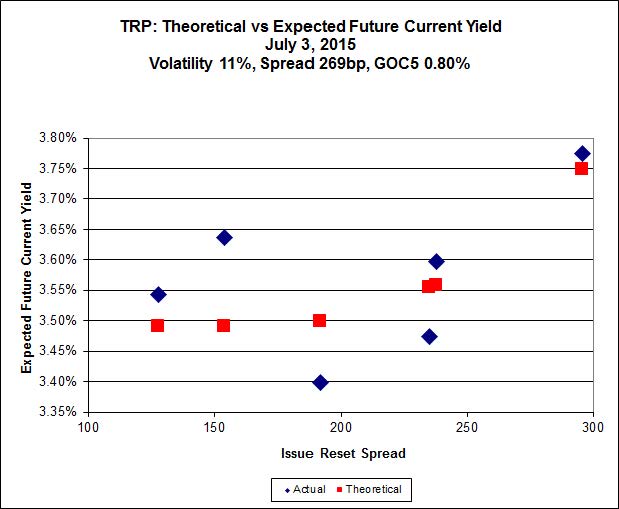
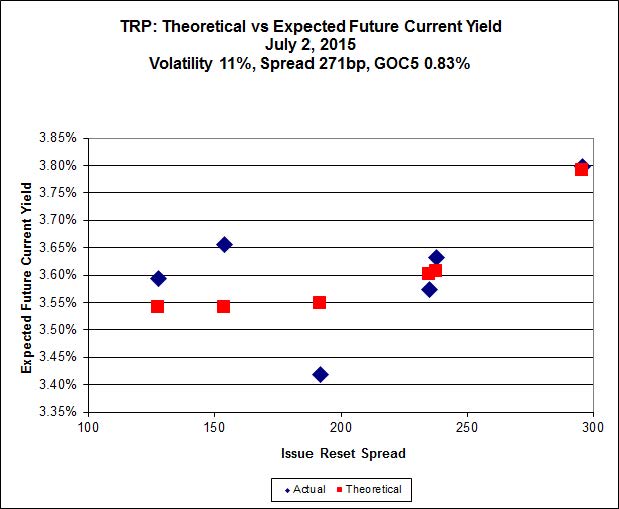
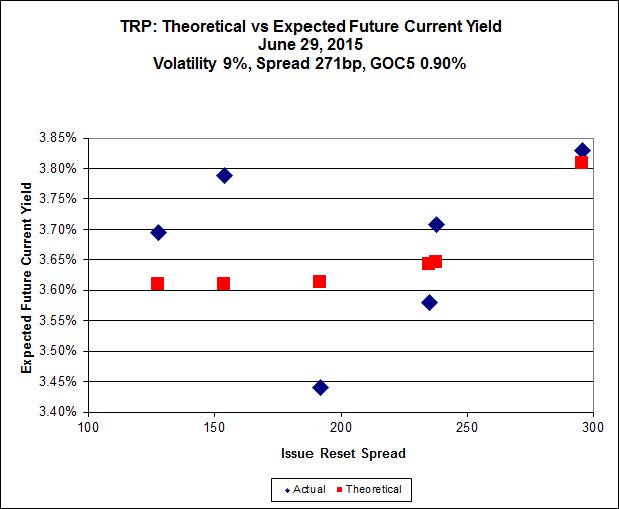
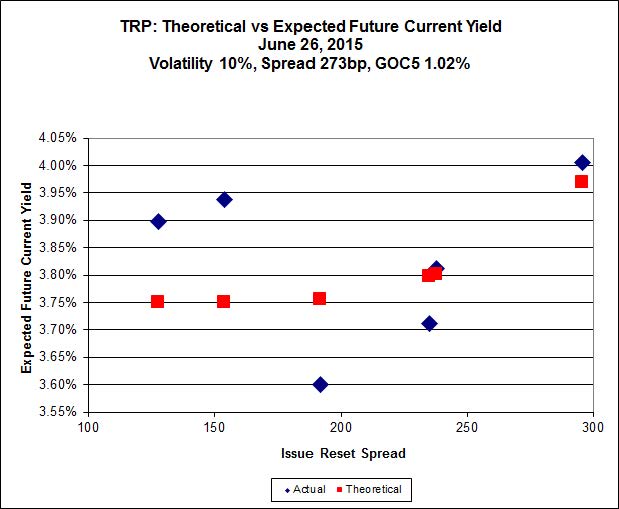
Here’s TRP:
 Click for Big
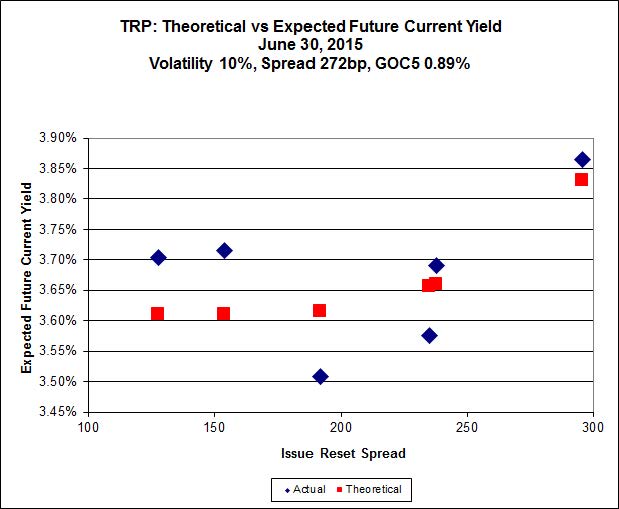
TRP.PR.A, which resets 2019-12-31 at +192, is bid at 20.49 to be $0.97 rich, while TRP.PR.C, resetting 2016-1-30 at +154, is $0.80 cheap at its bid price of 16.10.
 Click for Big
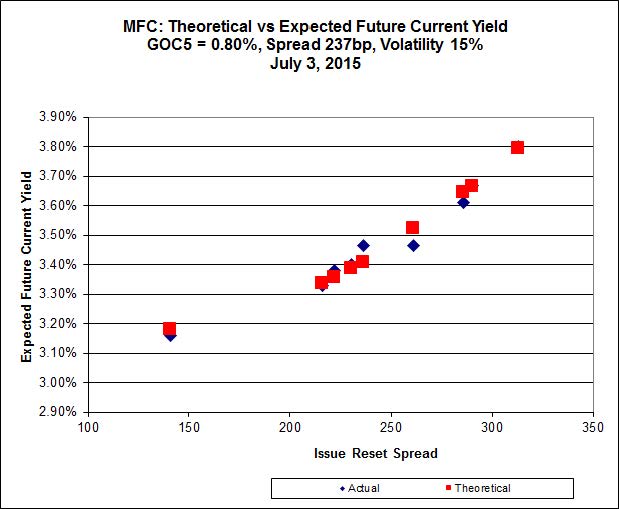
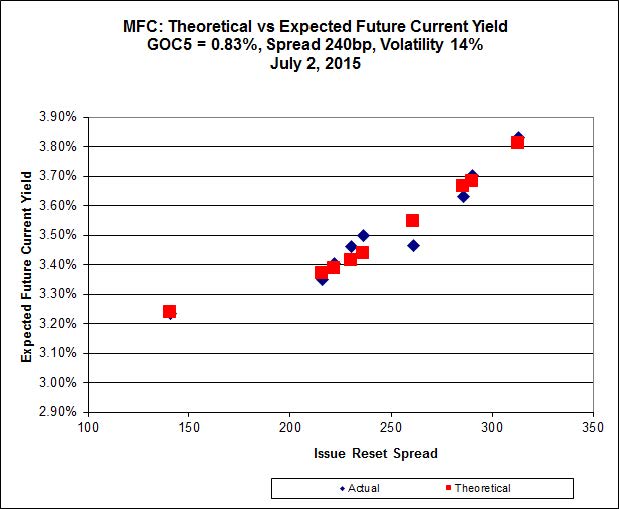
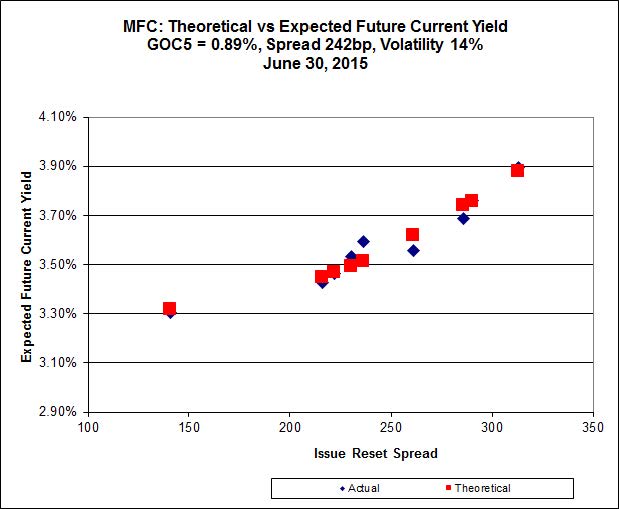
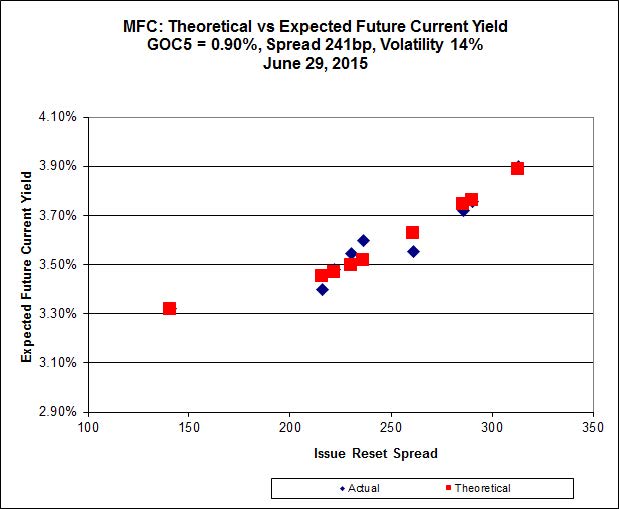
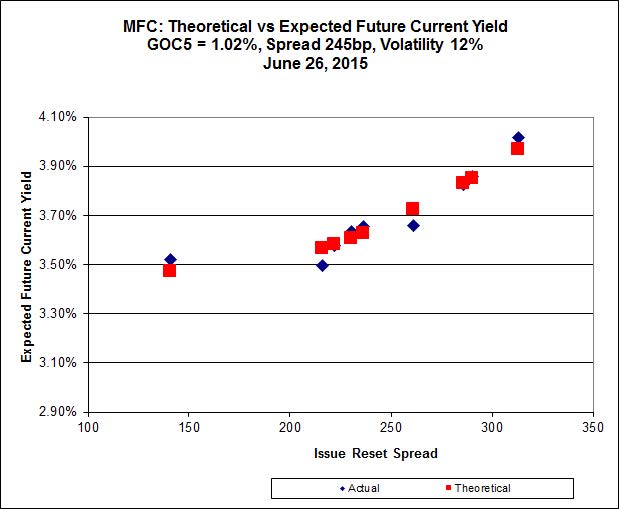
Another excellent fit, but the numbers are perplexing. Implied Volatility for MFC continues to be a conundrum. It is still too high if we consider that NVCC rules will never apply to these issues; it is still too low if we consider them to be NVCC non-compliant issues (and therefore with Deemed Maturities in the call schedule). The lowest spread issue, MFC.PR.F, is again noticeably off the line defined by the higher-spread issues.
Most expensive is MFC.PR.J, resetting at +261bp on 2018-3-19, bid at 24.71 to be $0.51 rich, while MFC.PR.M, resetting at +236bp on 2019-12-19, is bid at 22.65 to be $0.53 cheap.
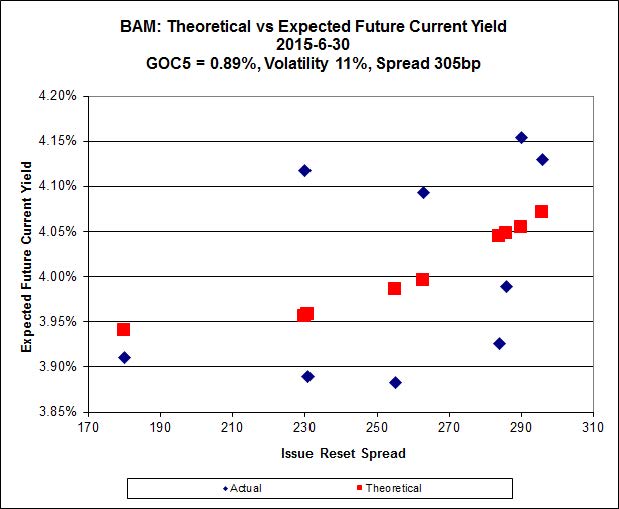
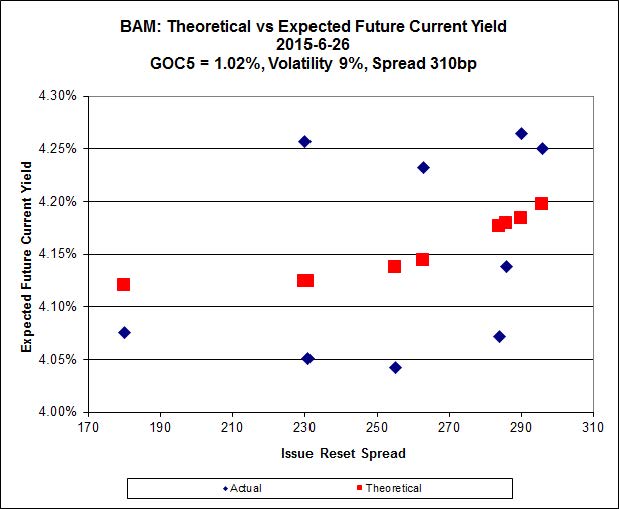
 Click for Big
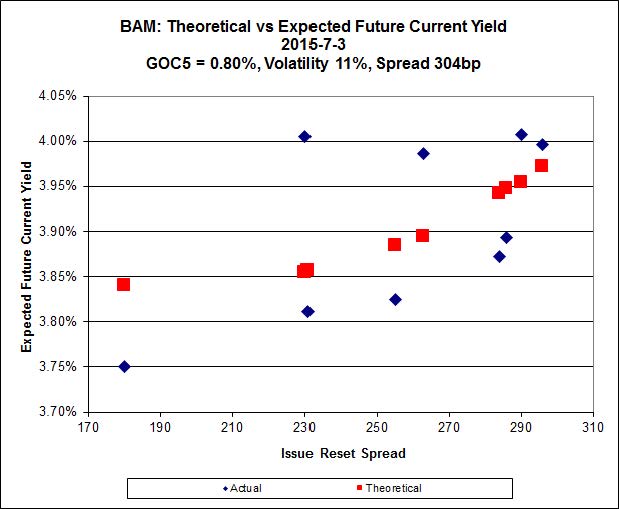
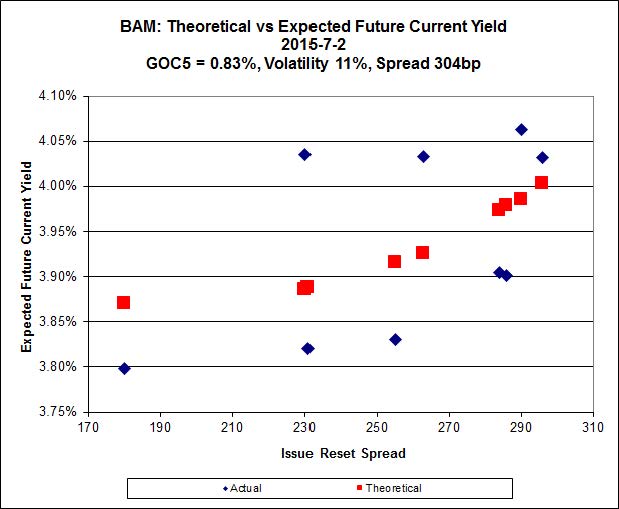
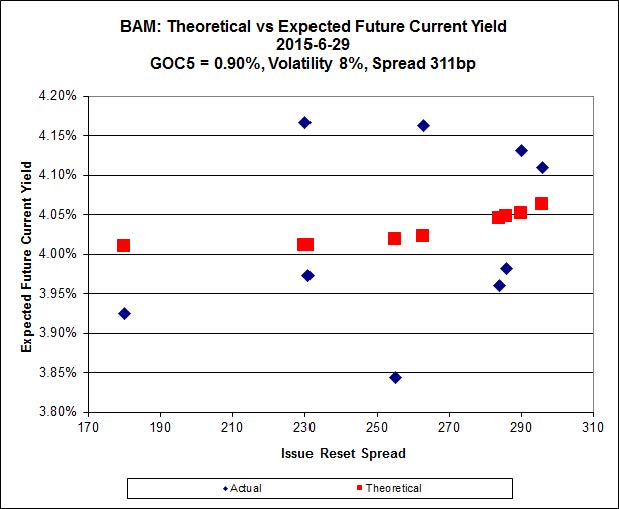
The cheapest issue relative to its peers is BAM.PR.R, resetting at +230bp on 2016-6-30, bid at 19.20 to be $0.74 cheap. BAM.PF.E, resetting at +255bp 2020-3-31 is bid at 22.44 and appears to be $0.98 rich.
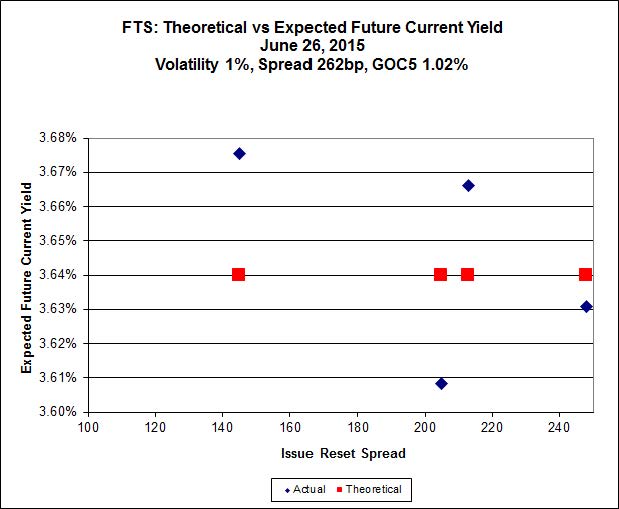
 Click for Big
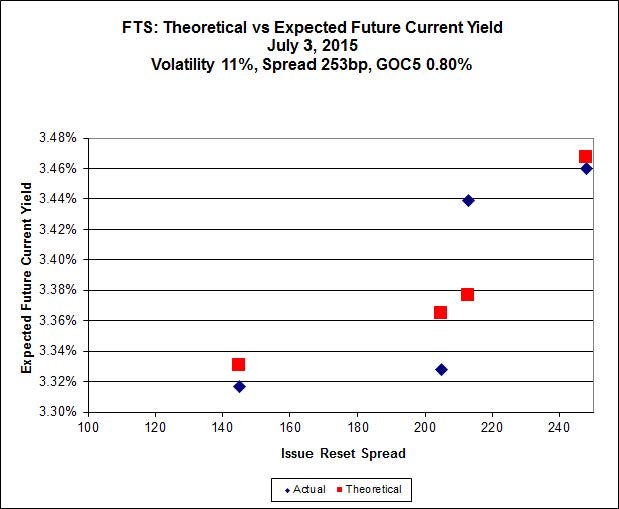
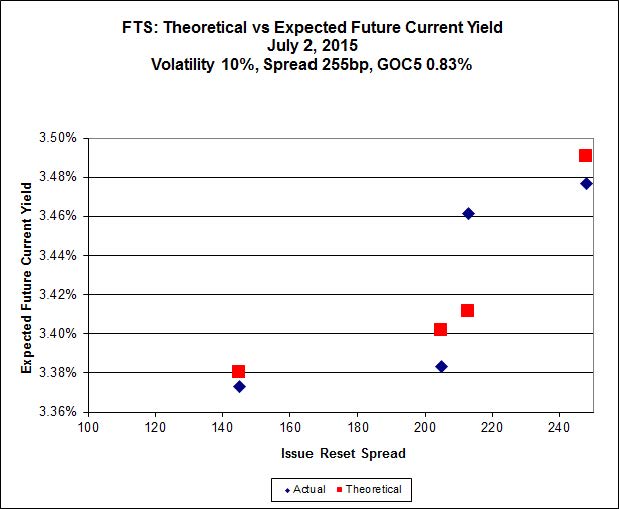
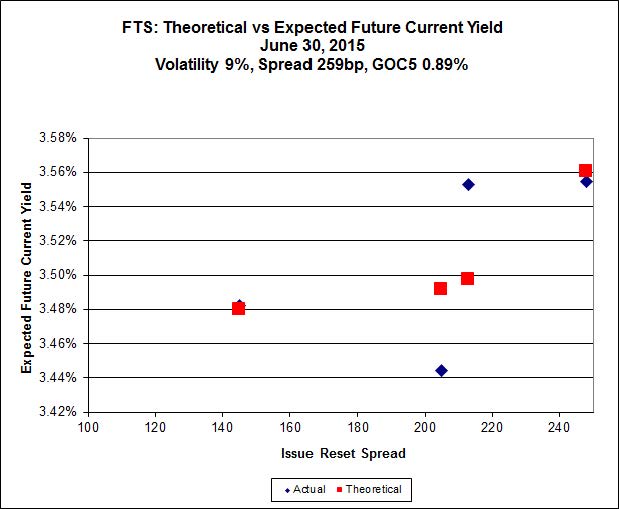
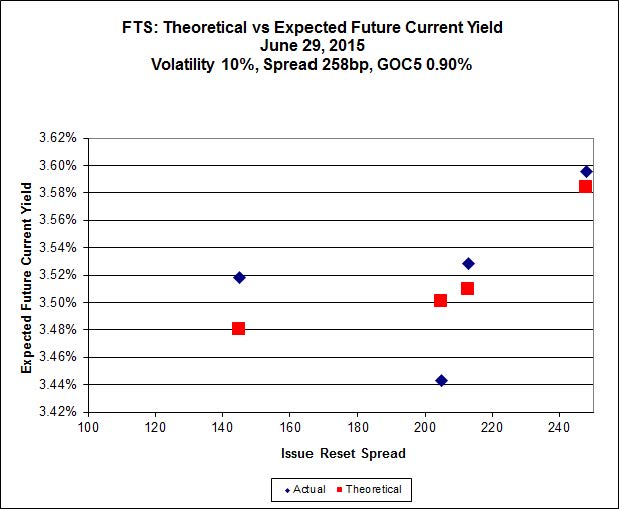
FTS.PR.H, with a spread of +145bp, and bid at 16.70, looks $0.18 cheap and resets 2020-6-1. FTS.PR.K, with a spread of +205bp and resetting 2019-3-1, is bid at 21.42 and is $0.35 rich.
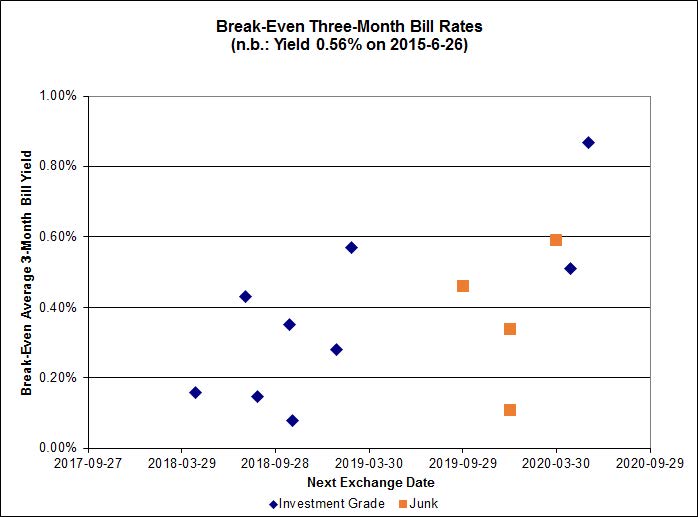
 Click for Big
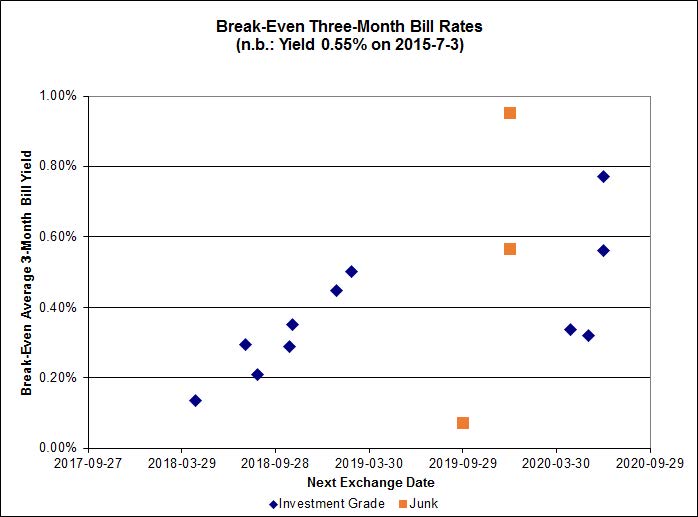
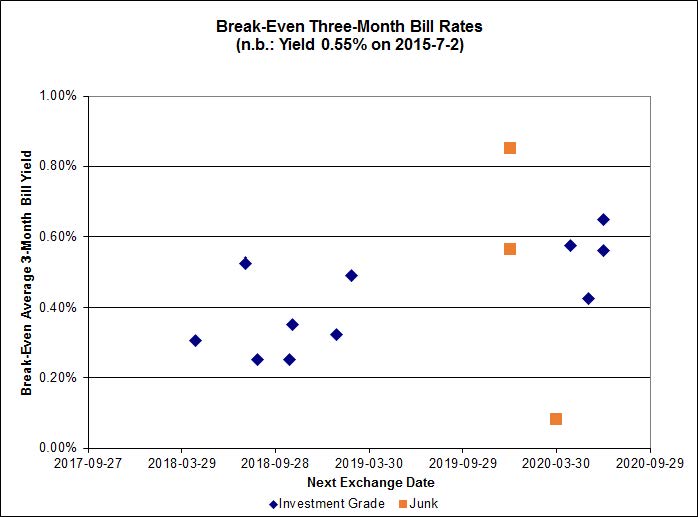
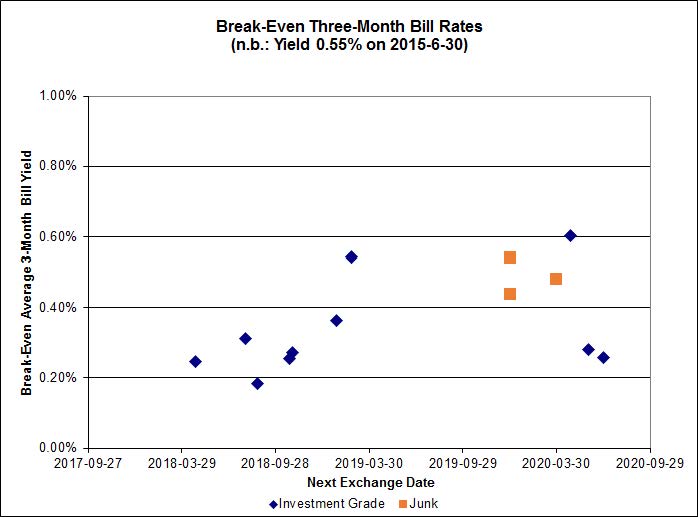
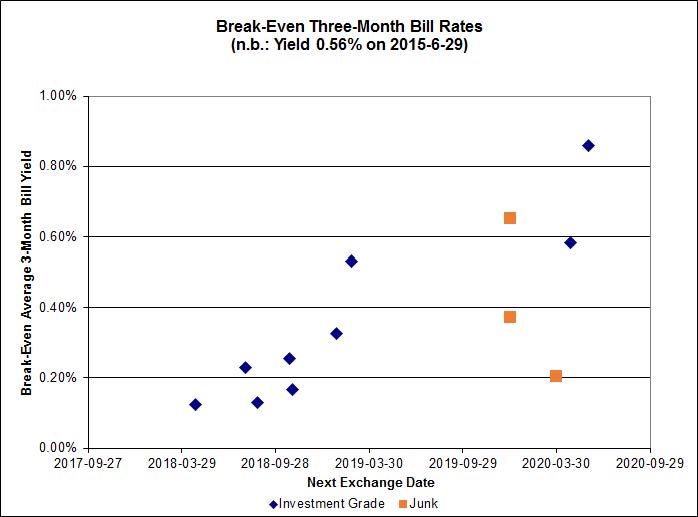
Investment-grade pairs predict an average three-month bill yield over the next five-odd years of about 0.25%, including the outlier TRP.PR.A / TRP.PR.F at -0.67%. On the junk side there are three outliers: FFH.PR.E / FFH.PR.F at -0.70%; BRF.PR.A / BRF.PR.B at -0.62%; and DC.PR.B / DC.PR.D at -0.24%.
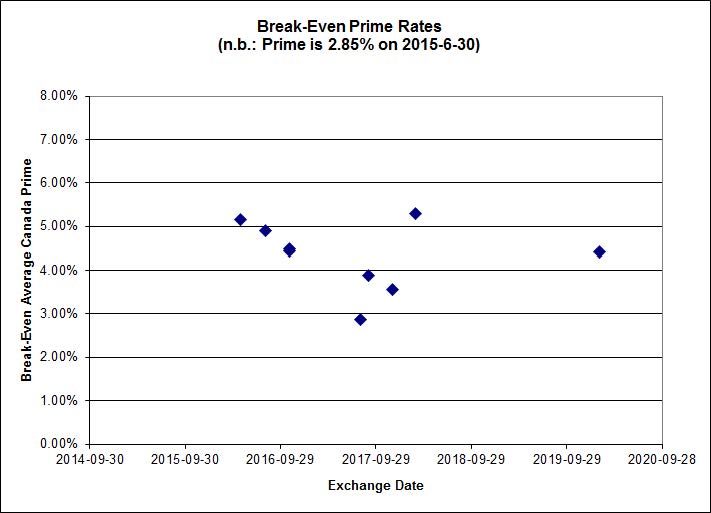
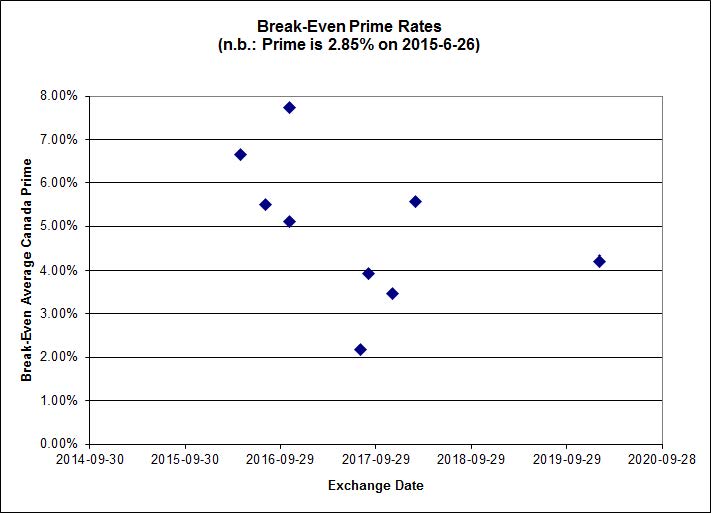
 Click for Big
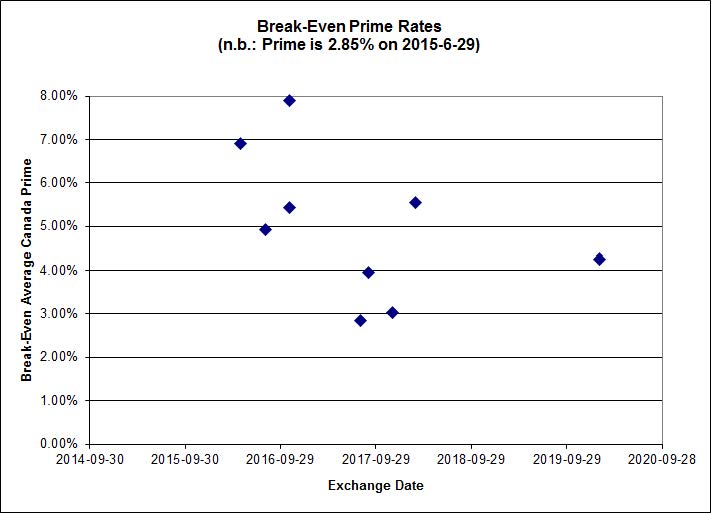
Shall we just say that this exhibits a high level of confidence in the continued rapacity of Canadian banks?
HIMIPref™ Preferred Indices
These values reflect the December 2008 revision of the HIMIPref™ Indices
Values are provisional and are finalized monthly |
| Index |
Mean
Current
Yield
(at bid) |
Median
YTW |
Median
Average
Trading
Value |
Median
Mod Dur
(YTW) |
Issues |
Day’s Perf. |
Index Value |
| Ratchet |
0.00 % |
0.00 % |
0 |
0.00 |
0 |
1.6770 % |
2,196.7 |
| FixedFloater |
0.00 % |
0.00 % |
0 |
0.00 |
0 |
1.6770 % |
3,840.8 |
| Floater |
3.53 % |
3.52 % |
61,538 |
18.46 |
3 |
1.6770 % |
2,335.2 |
| OpRet |
4.80 % |
-4.51 % |
22,663 |
0.08 |
1 |
-0.2733 % |
2,773.7 |
| SplitShare |
4.60 % |
4.87 % |
71,459 |
3.25 |
3 |
-0.2943 % |
3,244.5 |
| Interest-Bearing |
0.00 % |
0.00 % |
0 |
0.00 |
0 |
-0.2733 % |
2,536.3 |
| Perpetual-Premium |
5.49 % |
4.79 % |
64,971 |
2.33 |
19 |
-0.0781 % |
2,514.6 |
| Perpetual-Discount |
5.30 % |
5.21 % |
119,414 |
15.05 |
15 |
-0.3811 % |
2,659.2 |
| FixedReset |
4.56 % |
3.74 % |
233,855 |
16.02 |
88 |
-0.2822 % |
2,326.6 |
| Deemed-Retractible |
5.02 % |
4.38 % |
112,282 |
0.88 |
34 |
0.3374 % |
2,615.5 |
| FloatingReset |
2.85 % |
3.28 % |
58,478 |
6.01 |
9 |
-0.1329 % |
2,331.6 |
| Performance Highlights |
| Issue |
Index |
Change |
Notes |
| FTS.PR.M |
FixedReset |
-2.49 % |
YTW SCENARIO
Maturity Type : Limit Maturity
Maturity Date : 2045-06-29
Maturity Price : 22.58
Evaluated at bid price : 23.50
Bid-YTW : 3.73 % |
| MFC.PR.M |
FixedReset |
-2.03 % |
YTW SCENARIO
Maturity Type : Hard Maturity
Maturity Date : 2025-01-31
Maturity Price : 25.00
Evaluated at bid price : 22.65
Bid-YTW : 4.86 % |
| PWF.PR.P |
FixedReset |
-1.89 % |
YTW SCENARIO
Maturity Type : Limit Maturity
Maturity Date : 2045-06-29
Maturity Price : 18.20
Evaluated at bid price : 18.20
Bid-YTW : 3.61 % |
| HSE.PR.E |
FixedReset |
-1.80 % |
YTW SCENARIO
Maturity Type : Limit Maturity
Maturity Date : 2045-06-29
Maturity Price : 22.80
Evaluated at bid price : 24.01
Bid-YTW : 4.62 % |
| BAM.PR.T |
FixedReset |
-1.70 % |
YTW SCENARIO
Maturity Type : Limit Maturity
Maturity Date : 2045-06-29
Maturity Price : 20.20
Evaluated at bid price : 20.20
Bid-YTW : 4.17 % |
| BAM.PF.B |
FixedReset |
-1.67 % |
YTW SCENARIO
Maturity Type : Limit Maturity
Maturity Date : 2045-06-29
Maturity Price : 21.20
Evaluated at bid price : 21.20
Bid-YTW : 4.36 % |
| RY.PR.Z |
FixedReset |
-1.56 % |
YTW SCENARIO
Maturity Type : Limit Maturity
Maturity Date : 2045-06-29
Maturity Price : 22.14
Evaluated at bid price : 22.66
Bid-YTW : 3.62 % |
| HSE.PR.A |
FixedReset |
-1.54 % |
YTW SCENARIO
Maturity Type : Limit Maturity
Maturity Date : 2045-06-29
Maturity Price : 16.00
Evaluated at bid price : 16.00
Bid-YTW : 4.28 % |
| BAM.PR.R |
FixedReset |
-1.54 % |
YTW SCENARIO
Maturity Type : Limit Maturity
Maturity Date : 2045-06-29
Maturity Price : 19.20
Evaluated at bid price : 19.20
Bid-YTW : 4.34 % |
| ELF.PR.G |
Perpetual-Discount |
-1.35 % |
YTW SCENARIO
Maturity Type : Limit Maturity
Maturity Date : 2045-06-29
Maturity Price : 21.54
Evaluated at bid price : 21.80
Bid-YTW : 5.45 % |
| CU.PR.D |
Perpetual-Discount |
-1.30 % |
YTW SCENARIO
Maturity Type : Limit Maturity
Maturity Date : 2045-06-29
Maturity Price : 23.23
Evaluated at bid price : 23.60
Bid-YTW : 5.23 % |
| FTS.PR.F |
Perpetual-Discount |
-1.28 % |
YTW SCENARIO
Maturity Type : Limit Maturity
Maturity Date : 2045-06-29
Maturity Price : 22.96
Evaluated at bid price : 23.20
Bid-YTW : 5.33 % |
| CU.PR.E |
Perpetual-Discount |
-1.25 % |
YTW SCENARIO
Maturity Type : Limit Maturity
Maturity Date : 2045-06-29
Maturity Price : 23.32
Evaluated at bid price : 23.70
Bid-YTW : 5.21 % |
| ELF.PR.F |
Perpetual-Premium |
-1.24 % |
YTW SCENARIO
Maturity Type : Limit Maturity
Maturity Date : 2045-06-29
Maturity Price : 24.00
Evaluated at bid price : 24.25
Bid-YTW : 5.47 % |
| VNR.PR.A |
FixedReset |
-1.17 % |
YTW SCENARIO
Maturity Type : Limit Maturity
Maturity Date : 2045-06-29
Maturity Price : 22.94
Evaluated at bid price : 23.70
Bid-YTW : 4.02 % |
| ENB.PR.D |
FixedReset |
-1.13 % |
YTW SCENARIO
Maturity Type : Limit Maturity
Maturity Date : 2045-06-29
Maturity Price : 17.50
Evaluated at bid price : 17.50
Bid-YTW : 4.89 % |
| MFC.PR.N |
FixedReset |
-1.10 % |
YTW SCENARIO
Maturity Type : Hard Maturity
Maturity Date : 2025-01-31
Maturity Price : 25.00
Evaluated at bid price : 22.58
Bid-YTW : 4.83 % |
| ENB.PF.A |
FixedReset |
-1.09 % |
YTW SCENARIO
Maturity Type : Limit Maturity
Maturity Date : 2045-06-29
Maturity Price : 20.00
Evaluated at bid price : 20.00
Bid-YTW : 4.76 % |
| MFC.PR.K |
FixedReset |
-1.06 % |
YTW SCENARIO
Maturity Type : Hard Maturity
Maturity Date : 2025-01-31
Maturity Price : 25.00
Evaluated at bid price : 22.41
Bid-YTW : 4.77 % |
| MFC.PR.L |
FixedReset |
-1.05 % |
YTW SCENARIO
Maturity Type : Hard Maturity
Maturity Date : 2025-01-31
Maturity Price : 25.00
Evaluated at bid price : 22.51
Bid-YTW : 4.79 % |
| TD.PF.C |
FixedReset |
-1.02 % |
YTW SCENARIO
Maturity Type : Limit Maturity
Maturity Date : 2045-06-29
Maturity Price : 21.80
Evaluated at bid price : 22.21
Bid-YTW : 3.74 % |
| PWF.PR.T |
FixedReset |
1.14 % |
YTW SCENARIO
Maturity Type : Limit Maturity
Maturity Date : 2045-06-29
Maturity Price : 23.25
Evaluated at bid price : 24.88
Bid-YTW : 3.39 % |
| GWO.PR.H |
Deemed-Retractible |
1.21 % |
YTW SCENARIO
Maturity Type : Hard Maturity
Maturity Date : 2025-01-31
Maturity Price : 25.00
Evaluated at bid price : 23.45
Bid-YTW : 5.73 % |
| MFC.PR.B |
Deemed-Retractible |
1.30 % |
YTW SCENARIO
Maturity Type : Hard Maturity
Maturity Date : 2025-01-31
Maturity Price : 25.00
Evaluated at bid price : 22.53
Bid-YTW : 6.08 % |
| IAG.PR.G |
FixedReset |
1.42 % |
YTW SCENARIO
Maturity Type : Hard Maturity
Maturity Date : 2025-01-31
Maturity Price : 25.00
Evaluated at bid price : 25.00
Bid-YTW : 3.89 % |
| TRP.PR.G |
FixedReset |
1.45 % |
YTW SCENARIO
Maturity Type : Limit Maturity
Maturity Date : 2045-06-29
Maturity Price : 23.20
Evaluated at bid price : 25.20
Bid-YTW : 3.71 % |
| SLF.PR.E |
Deemed-Retractible |
1.52 % |
YTW SCENARIO
Maturity Type : Hard Maturity
Maturity Date : 2025-01-31
Maturity Price : 25.00
Evaluated at bid price : 22.71
Bid-YTW : 5.79 % |
| BAM.PF.E |
FixedReset |
1.63 % |
YTW SCENARIO
Maturity Type : Limit Maturity
Maturity Date : 2045-06-29
Maturity Price : 21.95
Evaluated at bid price : 22.44
Bid-YTW : 4.10 % |
| SLF.PR.A |
Deemed-Retractible |
1.65 % |
YTW SCENARIO
Maturity Type : Hard Maturity
Maturity Date : 2025-01-31
Maturity Price : 25.00
Evaluated at bid price : 23.46
Bid-YTW : 5.62 % |
| SLF.PR.C |
Deemed-Retractible |
1.95 % |
YTW SCENARIO
Maturity Type : Hard Maturity
Maturity Date : 2025-01-31
Maturity Price : 25.00
Evaluated at bid price : 22.43
Bid-YTW : 5.90 % |
| SLF.PR.B |
Deemed-Retractible |
1.98 % |
YTW SCENARIO
Maturity Type : Hard Maturity
Maturity Date : 2025-01-31
Maturity Price : 25.00
Evaluated at bid price : 23.67
Bid-YTW : 5.55 % |
| BAM.PR.C |
Floater |
4.74 % |
YTW SCENARIO
Maturity Type : Limit Maturity
Maturity Date : 2045-06-29
Maturity Price : 14.15
Evaluated at bid price : 14.15
Bid-YTW : 3.52 % |
| Volume Highlights |
| Issue |
Index |
Shares
Traded |
Notes |
| HSE.PR.G |
FixedReset |
141,625 |
Recent new issue.
YTW SCENARIO
Maturity Type : Limit Maturity
Maturity Date : 2045-06-29
Maturity Price : 22.90
Evaluated at bid price : 24.30
Bid-YTW : 4.55 % |
| TD.PF.B |
FixedReset |
76,228 |
TD crossed 70,000 at 22.82.
YTW SCENARIO
Maturity Type : Limit Maturity
Maturity Date : 2045-06-29
Maturity Price : 22.26
Evaluated at bid price : 22.87
Bid-YTW : 3.62 % |
| ENB.PR.Y |
FixedReset |
59,313 |
TD crossed 45,000 at 18.00.
YTW SCENARIO
Maturity Type : Limit Maturity
Maturity Date : 2045-06-29
Maturity Price : 17.87
Evaluated at bid price : 17.87
Bid-YTW : 4.88 % |
| SLF.PR.A |
Deemed-Retractible |
57,158 |
Desjardins crossed 50,000 at 23.35.
YTW SCENARIO
Maturity Type : Hard Maturity
Maturity Date : 2025-01-31
Maturity Price : 25.00
Evaluated at bid price : 23.46
Bid-YTW : 5.62 % |
| PWF.PR.L |
Perpetual-Premium |
51,000 |
Scotia crossed 50,000 at 25.04.
YTW SCENARIO
Maturity Type : Limit Maturity
Maturity Date : 2045-06-29
Maturity Price : 24.67
Evaluated at bid price : 24.95
Bid-YTW : 5.18 % |
| RY.PR.N |
Perpetual-Discount |
46,750 |
Recent new issue.
YTW SCENARIO
Maturity Type : Call
Maturity Date : 2024-11-24
Maturity Price : 25.00
Evaluated at bid price : 25.25
Bid-YTW : 4.84 % |
| There were 55 other index-included issues trading in excess of 10,000 shares. |
| Wide Spread Highlights |
| Issue |
Index |
Quote Data and Yield Notes |
| ELF.PR.F |
Perpetual-Premium |
Quote: 24.25 – 24.96
Spot Rate : 0.7100
Average : 0.4669
YTW SCENARIO
Maturity Type : Limit Maturity
Maturity Date : 2045-06-29
Maturity Price : 24.00
Evaluated at bid price : 24.25
Bid-YTW : 5.47 % |
| TD.PF.C |
FixedReset |
Quote: 22.21 – 22.75
Spot Rate : 0.5400
Average : 0.3679
YTW SCENARIO
Maturity Type : Limit Maturity
Maturity Date : 2045-06-29
Maturity Price : 21.80
Evaluated at bid price : 22.21
Bid-YTW : 3.74 % |
| FTS.PR.M |
FixedReset |
Quote: 23.50 – 24.08
Spot Rate : 0.5800
Average : 0.4321
YTW SCENARIO
Maturity Type : Limit Maturity
Maturity Date : 2045-06-29
Maturity Price : 22.58
Evaluated at bid price : 23.50
Bid-YTW : 3.73 % |
| FTS.PR.I |
FloatingReset |
Quote: 16.50 – 17.00
Spot Rate : 0.5000
Average : 0.3577
YTW SCENARIO
Maturity Type : Limit Maturity
Maturity Date : 2045-06-29
Maturity Price : 16.50
Evaluated at bid price : 16.50
Bid-YTW : 3.60 % |
| RY.PR.Z |
FixedReset |
Quote: 22.66 – 23.23
Spot Rate : 0.5700
Average : 0.4300
YTW SCENARIO
Maturity Type : Limit Maturity
Maturity Date : 2045-06-29
Maturity Price : 22.14
Evaluated at bid price : 22.66
Bid-YTW : 3.62 % |
| RY.PR.H |
FixedReset |
Quote: 22.60 – 23.02
Spot Rate : 0.4200
Average : 0.2919
YTW SCENARIO
Maturity Type : Limit Maturity
Maturity Date : 2045-06-29
Maturity Price : 22.09
Evaluated at bid price : 22.60
Bid-YTW : 3.67 % |