The rate cut has caused increased concern over housing prices:
The move overrides concerns from real estate executives and some economists that lower rates will lead to increased borrowing, skyrocketing prices and put housing markets in Toronto and Vancouver at risk of a correction.
“The risks are growing. We get more of a speculative run-up in prices, especially in Vancouver and Toronto,” Robert Kavcic, senior economist at Bank of Montreal, said by phone after the rate announcement. “In the last six months, price activity has gotten heated, especially in those two markets. This would only reinforce that.”
…
“It’s going to put more fuel on the fire for potentially people who may not really have the ability to buy real estate,” Ross McCredie, CEO of Sotheby’s International Realty Canada said in an interview July 8. “When they’re buying, the baseline is that interest rates are going to stay this low for a very long period of time. It’s a scary place to be a buyer.’
Toronto and Vancouver home prices have defied expectations. The average cost of purchasing a condo, townhouse or low-rise property in Toronto, Canada’s largest city, has jumped 38 percent in the five years to June, according to the Canadian Real Estate Association. Toronto sales reached a record in each of the last three months. In Vancouver, single-family home prices rallied 35 percent to C$1.1 million in June from June 2010.
… and there was an immediate effect on the dollar:
Commodity currencies slumped amid speculation an interest-rate cut from the Bank of Canada may augur more monetary stimulus by resource-producing nations.
The Canadian dollar fell to its lowest since 2009 as policy makers lowered borrowing costs to stimulate an economy struggling with the declining price of oil, its major export. The New Zealand and Australian currencies also tumbled to multi-year lows.
…
Canada’s dollar, known as the loonie for the image of aquatic bird on the C$1 coin, slid as much as 1.8 percent.
The New Zealand dollar slumped as much as 1.7 percent while Australia’s currency lost as much as 1.3. South Africa’s rand, the Norwegian krone and Mexico’s peso also slid.
However, there is some encouraging news from the cult of the start-up:
It seems barely a week goes by without news of another Canadian startup scoring a huge venture capital financing deal. Preliminary data published today by Thomson Reuters backs that up: The venture capital scene is enjoying its biggest financing boom in over a decade.
Thomson Reuters said Tuesday the second quarter of 2015 was the best three-month period for VC investments in Canadian companies in 10 years. In fact, the last 12 months through June 30 rank as the best one-year period for VC investments into Canadian companies since 2002, when the country was at the dawn of a long, bleak stretch of relative quiet on the startup financing scene in Canada. Venture capital-backed companies raised $2.6-billion during the past 12 months, compared to $2.4-billion in calendar 2014 and less than $1.6-billion in each of 2011 and 2012.
Greater Toronto Area companies dominated the top five list of biggest disclosed VC deals in the first half of 2015, led by financial software firm Real Matters ($60-million raised), pharma company Northern Biologics ($36-million) and ex-Montreal e-commerce firm VarageSale ($34-million).
Assiduous Readers will remember that I attribute a great deal of the increase in Treasury volatility to the increased transparency that has come about with electronic trading and an increase in the use of exchange-traded futures contracts. So naturally, since the problem has been caused by increased transparency, the regulators want to solve the problem with increased transparency, but there is some pushback:
“It’s the market for U.S. government debt — how is there not more transparency in the trading and pricing we have today?” said Kevin McPartland, head of research for market structure and technology at Greenwich Associates, a Stamford, Connecticut-based financial-services consulting firm. “Of course, the next conversation that starts is about what impact that has on liquidity.”
…
Michael Spencer, chief executive officer of interdealer broker ICAP Plc, warned this week about the potential for more volatility in Treasuries. He attributed the price swings to the scaling back of trading by Wall Street banks known as primary dealers and an increase in electronic trading.
…
Some of the largest investors in company debt say too much transparency can hinder their ability to trade large blocks. AllianceBernstein Holding LP, BlackRock Inc. and Pacific Investment Management Co. urged regulators in a May letter to consider loosening time requirements for disclosing large transactions because the information could tip off rivals.
Turnover of interest-rate-linked securities in other markets that publicly report trades has surged. Trading in interest-rate futures has climbed 81 percent in the past 10 years. This year, a record $335 billion of the contracts has changed hands on average each day, according to CME Group Inc. data. The comparable figure for Treasuries is $430 billion.
One idea that keeps coming up is GDP-linked bonds:
This study proposes that the Government of Canada issue a new debt security, the “Trill,” which would essentially offer Canadian investors an equity stake in the Canadian economy. The Trill is so-named because its coupon payment would be one-trillionth of Canada’s GDP. Similar to shares issued by corporations paying a fraction of corporate earnings in dividends, the Trill would pay a fraction of the “earnings” of Canada. Coupon payments would rise and fall with the GDP.
For average investors, the Trill would be a useful new source of income, offering both exposure to income growth and protection against inflation. This security would also appeal to large institutional investors. Pension funds have a need to match their long-term liabilities with assets that can provide stable, long-term cash flows. Currently, a large part of fund assets are held in nominal fixed-coupon Government of Canada securities. These securities do not provide protection from inflation and the limited numbers of real return bonds the government issues do not provide exposure to income growth.
The BoC has published a discussion paper by Martin Brooke, Rhys Mendes, Alex Pienkowski and Eric Santor titled Sovereign Default and State-Contingent Debt:
The sovereign debt restructuring in Greece and the events surrounding the IMF-EU support packages for Ireland, Portugal and Cyprus have exposed fault lines in the existing practices for sovereign debt crisis resolution – perhaps most importantly, an overreliance on official sector liquidity support. This paper argues that the current approach is suboptimal for five main reasons: i) it increases the risk of moral hazard; ii) it incentivises short-term lending, which can increase the risk of liquidity crises; iii) it puts an inequitable amount of taxpayer resources at risk; iv) substantial official sector holdings of an insolvent sovereign’s debt can complicate negotiated debt writedowns; and, v) it can delay necessary reforms, thereby requiring larger policy adjustments to be implemented when action is eventually taken.
In response to these deficiencies, this paper argues that, for reasons of equity and efficiency, private creditors should play a greater role in risk-sharing and helping to resolve sovereign debt crises. We propose the introduction of two complementary types of state-contingent bonds – ‘sovereign cocos’ and ‘GDP-linked bonds’.
Sovereign cocos are bonds that would automatically extend in repayment maturity when a country receives official sector emergency liquidity assistance. This predictable and transparent means of bailing-in creditors would increase market discipline on sovereigns to prudently manage their debt, ex ante, thus reducing the incidence of crises. And, it would reduce the size of official sector support packages once a crisis has hit, as amortising debt would no longer need to be covered by program financing.
GDP-linked bonds are debt instruments that directly link principal and interest payments to the level of a country’s nominal GDP. They provide a natural complement to sovereign cocos. While sovereign cocos are primarily designed to tackle liquidity crises, GDP-linked bonds help reduce the likelihood of solvency crises. This is because GDP-linked bonds provide a form of ‘recession insurance’ that reduces principal and interest payments when a country is hit by a negative growth shock. This helps to both stabilise the debt-to-GDP ratio and increase a sovereign’s capacity to borrow at sustainable interest rates. While all countries might experience some benefit from the use of GDP-linked debt, economies with higher GDP growth volatility (such as emerging market economies) or countries where monetary policy is constrained (such as those in a monetary union) are likely to benefit most.
Should ‘sovereign Cocos’ ever be issued in the UK, it will be interesting to see whether UK investors would be permitted to buy them! But this is all by way of introduction, since there may be a new example of GDP-linkers:
As debt talks intensify between Ukraine and its creditors, securities that pay out if economic growth exceeds expectations will probably be on the agenda, echoing deals done by Argentina and Greece in the past decade.
Ukraine’s restructuring proposal includes a “value-recovery instrument,” the Finance Ministry said last month, while a person familiar with a bondholder plan submitted in May said it has a debt-for-equity swap element. Both securities feature interest payments linked to gross domestic product and are also referred to as GDP-linked warrants.
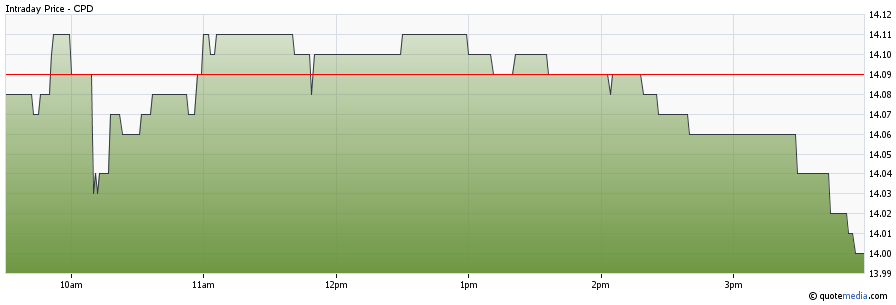
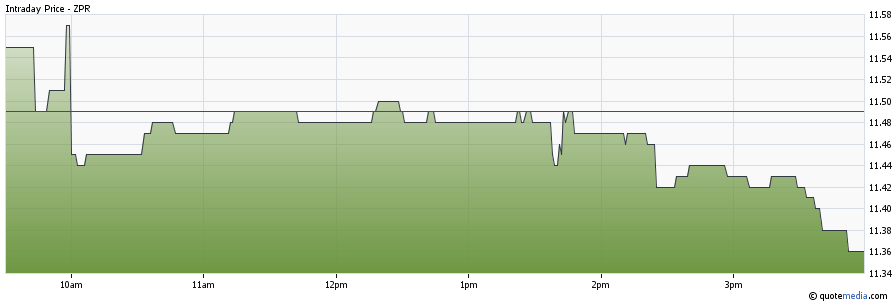
For most of the day it was looking as if the preferred share market was taking the rate cut in stride; then 2pm happened.
CPD
 Click for Big
ZPR
 Click for Big
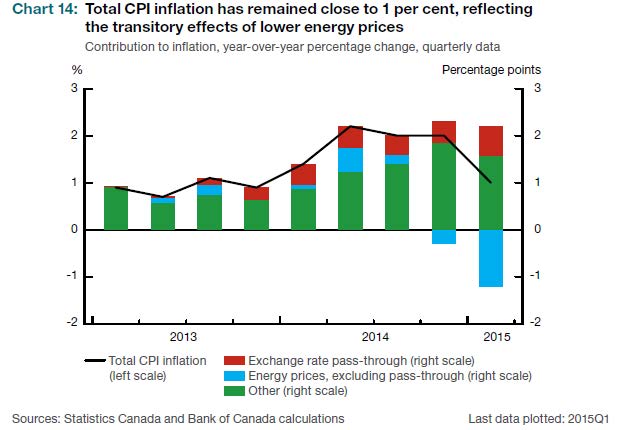
It was a mixed day for the Canadian preferred share market, with PerpetualDiscounts off 13bp, FixedResets down 47bp and DeemedRetractibles gaining 5bp. Floaters got whacked again. The Performance Highlights table is enormous again, stuffed full of FixedReset losers. Volume was average.
PerpetualDiscounts now yield 5.39%, equivalent to 7.01% interest at the standard equivalency factor of 1.3x. Long corporates now yield about 4.1%, so the pre-tax interest-equivalent spread (in this context, the “Seniority Spread”) is now about 290bp, a bit of a bounce-back from the 305bp reported July 8.
For as long as the FixedReset market is so violently unsettled, I’ll keep publishing updates of the more interesting and meaningful series of FixedResets’ Implied Volatilities. This doesn’t include Enbridge because although Enbridge has a large number of issues outstanding, all of which are quite liquid, the range of Issue Reset Spreads is too small for decent conclusions. The low is 212bp (ENB.PR.H; second-lowest is ENB.PR.D at 237bp) and the high is a mere 268 for ENB.PF.G.
Remember that all rich /cheap assessments are:
» based on Implied Volatility Theory only
» are relative only to other FixedResets from the same issuer
» assume constant GOC-5 yield
» assume constant Implied Volatility
» assume constant spread
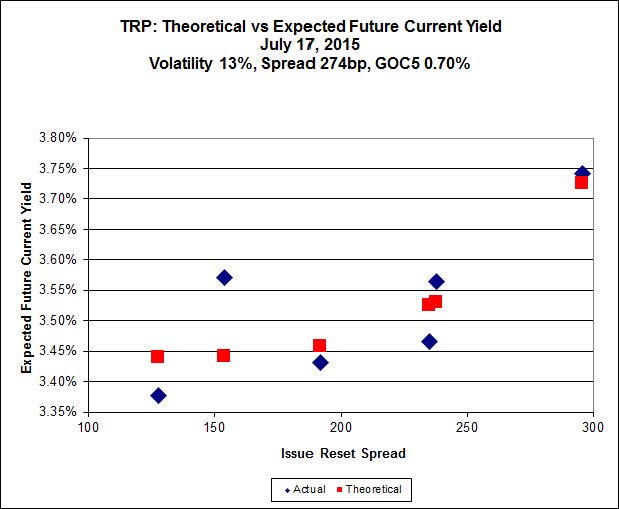
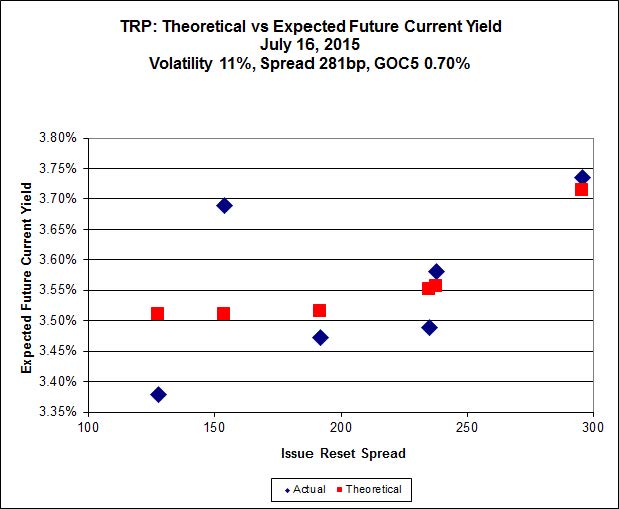
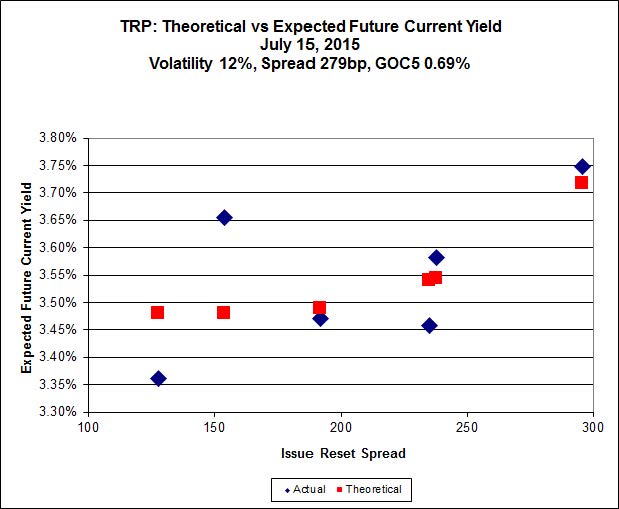
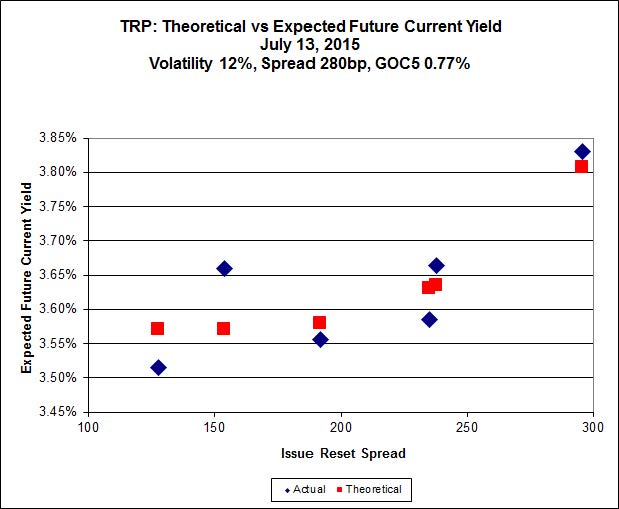
Here’s TRP:
 Click for Big
TRP.PR.E, which resets 2019-10-30 at +235, is bid at 21.98 to be $0.51 rich, while TRP.PR.C, resetting 2016-1-30 at +154, is $0.77 cheap at its bid price of 15.30.
 Click for Big
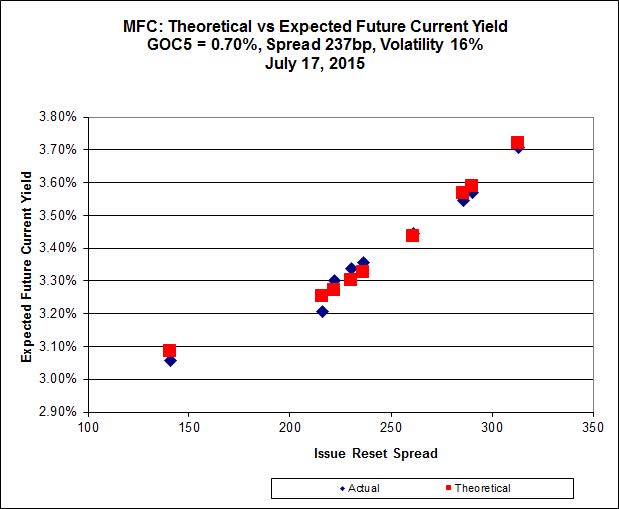
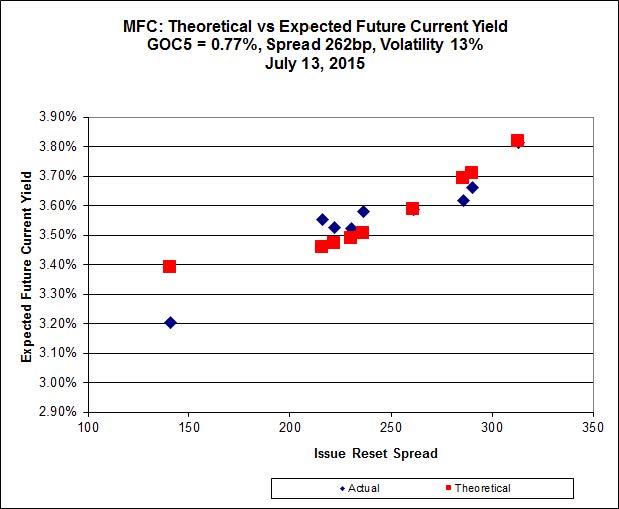
Most expensive is MFC.PR.F, resetting at +141bp on 2016-6-19, bid at 17.00 to be $1.02 rich, while MFC.PR.K, resetting at +222bp on 2018-9-19, is bid at 20.59 to be $0.83 cheap.
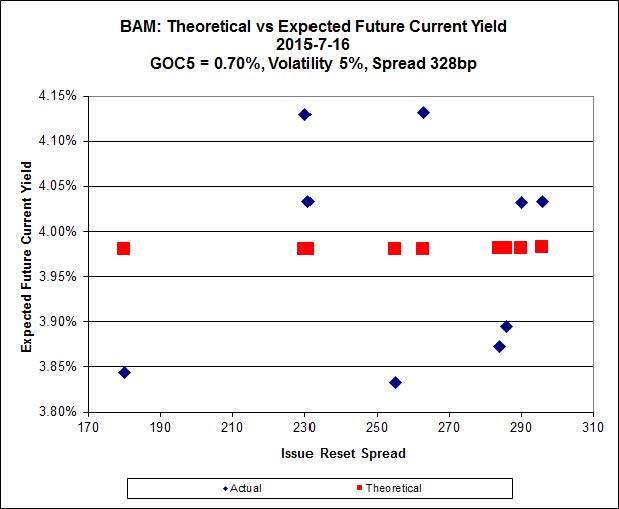
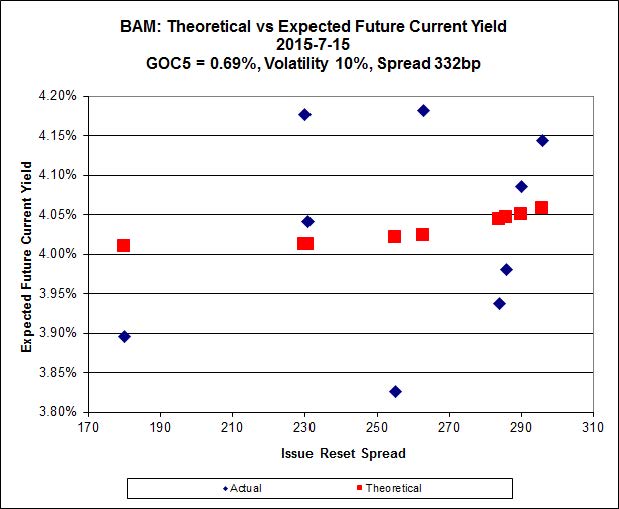
 Click for Big
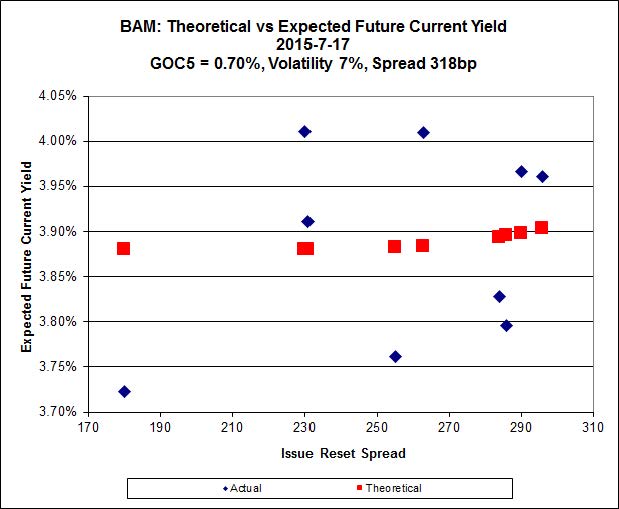
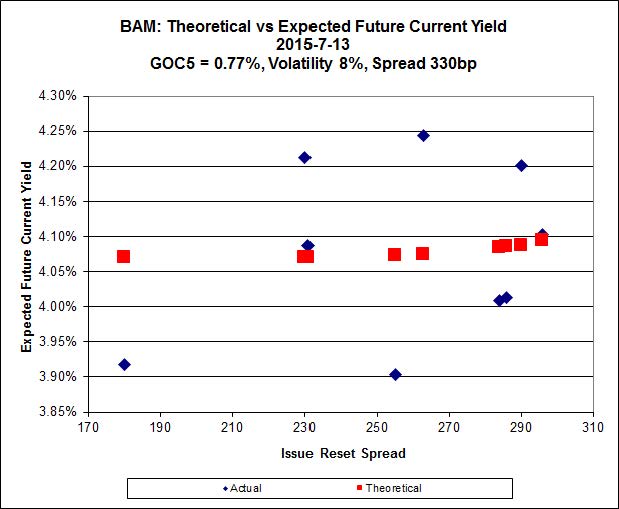
The cheapest issue relative to its peers is BAM.PF.B, resetting at +263bp on 2019-3-31, bid at 19.85 to be $0.78 cheap. BAM.PF.E, resetting at +255bp on 2020-3-31 is bid at 21.17 and appears to be $1.02 rich.
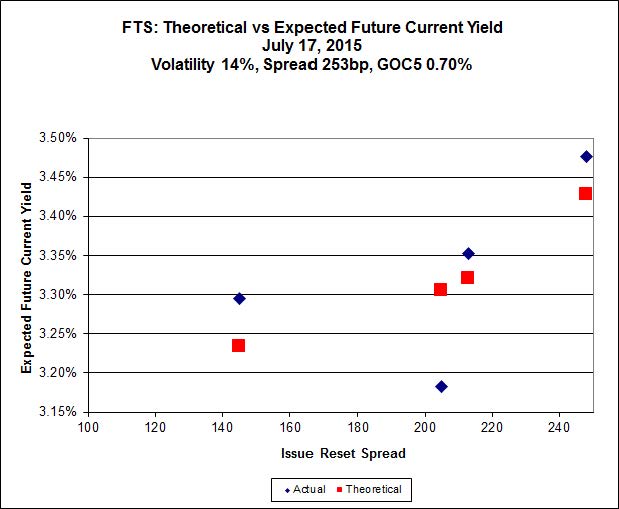
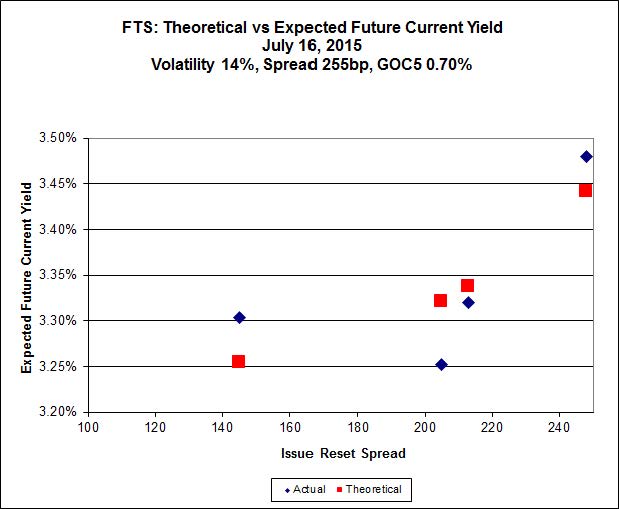
 Click for Big
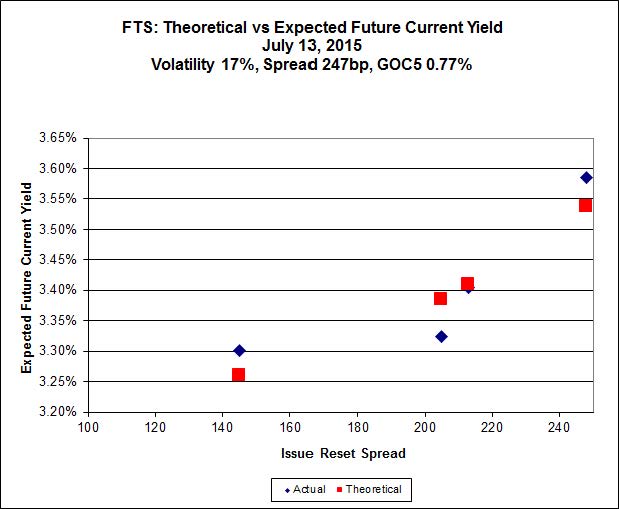
FTS.PR.K, with a spread of +205bp, and bid at 21.19, looks $0.44 expensive and resets 2019-3-1. FTS.PR.M, with a spread of +248bp and resetting 2019-12-1, is bid at 22.86 and is $0.28 cheap.

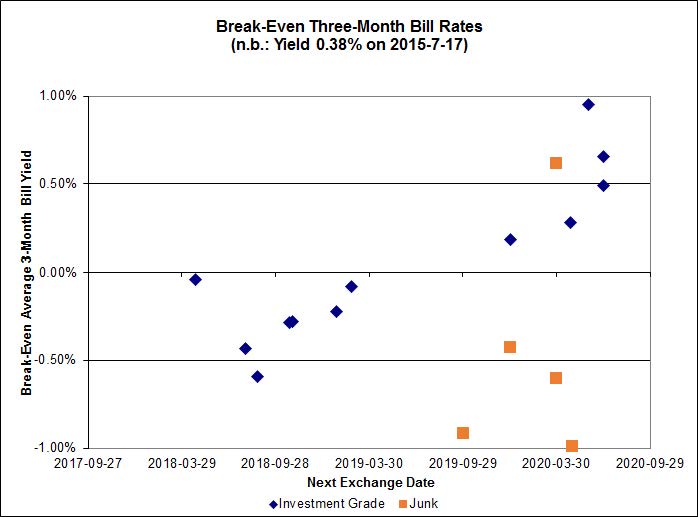
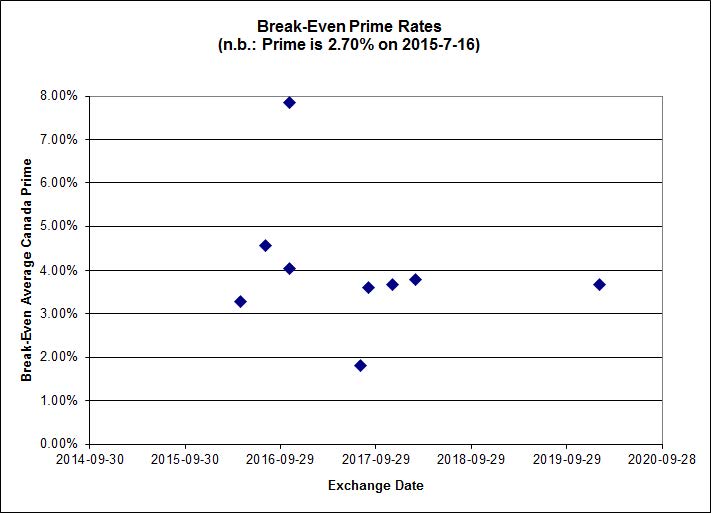
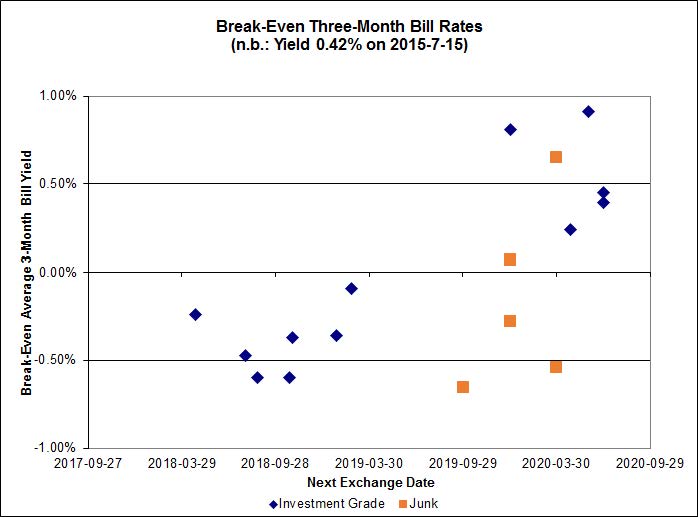
Click for Big
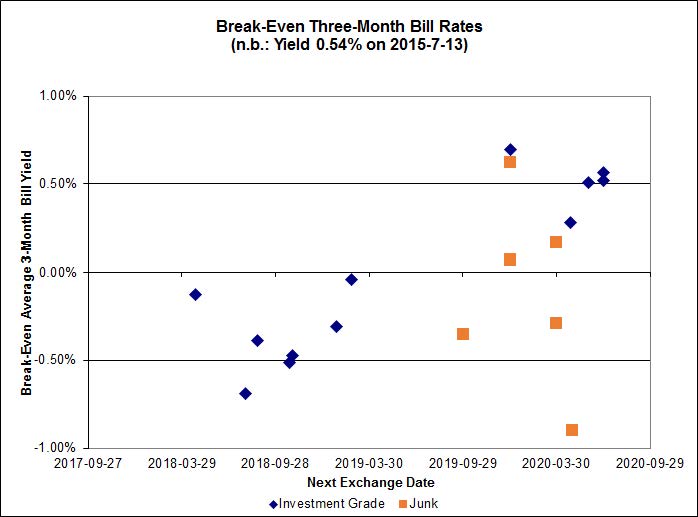
There is only one outlier; one of the junk pairs is below -1.00%.
Investment-grade pairs predict an average three-month bill yield over the next five-odd years of 0.01% (which seems a little extreme!).
 Click for Big
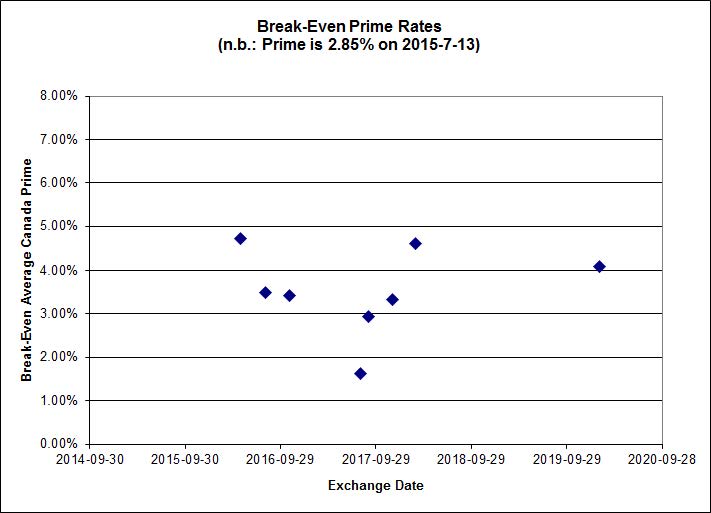
Shall we just say that this exhibits a high level of confidence in the continued rapacity of Canadian banks?
HIMIPref™ Preferred Indices
These values reflect the December 2008 revision of the HIMIPref™ Indices
Values are provisional and are finalized monthly |
| Index |
Mean
Current
Yield
(at bid) |
Median
YTW |
Median
Average
Trading
Value |
Median
Mod Dur
(YTW) |
Issues |
Day’s Perf. |
Index Value |
| Ratchet |
0.00 % |
0.00 % |
0 |
0.00 |
0 |
-1.5354 % |
2,058.0 |
| FixedFloater |
0.00 % |
0.00 % |
0 |
0.00 |
0 |
-1.5354 % |
3,598.3 |
| Floater |
3.76 % |
3.84 % |
61,068 |
17.78 |
3 |
-1.5354 % |
2,187.8 |
| OpRet |
0.00 % |
0.00 % |
0 |
0.00 |
0 |
-0.3217 % |
2,762.5 |
| SplitShare |
4.61 % |
4.88 % |
68,464 |
3.20 |
3 |
-0.3217 % |
3,237.5 |
| Interest-Bearing |
0.00 % |
0.00 % |
0 |
0.00 |
0 |
-0.3217 % |
2,526.0 |
| Perpetual-Premium |
5.52 % |
3.87 % |
73,790 |
0.29 |
13 |
-0.0670 % |
2,511.4 |
| Perpetual-Discount |
5.43 % |
5.39 % |
89,306 |
14.85 |
21 |
-0.1260 % |
2,637.0 |
| FixedReset |
4.70 % |
3.84 % |
221,991 |
15.82 |
88 |
-0.4660 % |
2,236.9 |
| Deemed-Retractible |
5.04 % |
4.97 % |
111,295 |
3.13 |
34 |
0.0505 % |
2,609.2 |
| FloatingReset |
2.53 % |
3.23 % |
49,887 |
6.06 |
10 |
-0.2784 % |
2,270.8 |
| Performance Highlights |
| Issue |
Index |
Change |
Notes |
| GWO.PR.N |
FixedReset |
-4.37 % |
YTW SCENARIO
Maturity Type : Hard Maturity
Maturity Date : 2025-01-31
Maturity Price : 25.00
Evaluated at bid price : 15.54
Bid-YTW : 8.00 % |
| VNR.PR.A |
FixedReset |
-4.05 % |
YTW SCENARIO
Maturity Type : Limit Maturity
Maturity Date : 2045-07-15
Maturity Price : 21.44
Evaluated at bid price : 21.78
Bid-YTW : 4.24 % |
| BAM.PR.C |
Floater |
-3.19 % |
YTW SCENARIO
Maturity Type : Limit Maturity
Maturity Date : 2045-07-15
Maturity Price : 13.07
Evaluated at bid price : 13.07
Bid-YTW : 3.84 % |
| BAM.PR.Z |
FixedReset |
-3.12 % |
YTW SCENARIO
Maturity Type : Limit Maturity
Maturity Date : 2045-07-15
Maturity Price : 21.61
Evaluated at bid price : 22.02
Bid-YTW : 4.44 % |
| BIP.PR.A |
FixedReset |
-2.63 % |
YTW SCENARIO
Maturity Type : Limit Maturity
Maturity Date : 2045-07-15
Maturity Price : 21.54
Evaluated at bid price : 21.86
Bid-YTW : 5.05 % |
| SLF.PR.J |
FloatingReset |
-2.48 % |
YTW SCENARIO
Maturity Type : Hard Maturity
Maturity Date : 2025-01-31
Maturity Price : 25.00
Evaluated at bid price : 15.70
Bid-YTW : 7.47 % |
| ENB.PR.Y |
FixedReset |
-2.40 % |
YTW SCENARIO
Maturity Type : Limit Maturity
Maturity Date : 2045-07-15
Maturity Price : 16.70
Evaluated at bid price : 16.70
Bid-YTW : 5.12 % |
| MFC.PR.K |
FixedReset |
-2.37 % |
YTW SCENARIO
Maturity Type : Hard Maturity
Maturity Date : 2025-01-31
Maturity Price : 25.00
Evaluated at bid price : 20.59
Bid-YTW : 5.81 % |
| MFC.PR.N |
FixedReset |
-2.28 % |
YTW SCENARIO
Maturity Type : Hard Maturity
Maturity Date : 2025-01-31
Maturity Price : 25.00
Evaluated at bid price : 21.40
Bid-YTW : 5.49 % |
| PWF.PR.P |
FixedReset |
-2.22 % |
YTW SCENARIO
Maturity Type : Limit Maturity
Maturity Date : 2045-07-15
Maturity Price : 16.73
Evaluated at bid price : 16.73
Bid-YTW : 3.65 % |
| NA.PR.W |
FixedReset |
-2.09 % |
YTW SCENARIO
Maturity Type : Limit Maturity
Maturity Date : 2045-07-15
Maturity Price : 21.10
Evaluated at bid price : 21.10
Bid-YTW : 3.84 % |
| IFC.PR.A |
FixedReset |
-1.97 % |
YTW SCENARIO
Maturity Type : Hard Maturity
Maturity Date : 2025-01-31
Maturity Price : 25.00
Evaluated at bid price : 17.94
Bid-YTW : 7.29 % |
| TRP.PR.C |
FixedReset |
-1.93 % |
YTW SCENARIO
Maturity Type : Limit Maturity
Maturity Date : 2045-07-15
Maturity Price : 15.25
Evaluated at bid price : 15.25
Bid-YTW : 3.90 % |
| HSE.PR.E |
FixedReset |
-1.92 % |
YTW SCENARIO
Maturity Type : Limit Maturity
Maturity Date : 2045-07-15
Maturity Price : 22.29
Evaluated at bid price : 23.00
Bid-YTW : 4.78 % |
| BMO.PR.Q |
FixedReset |
-1.72 % |
YTW SCENARIO
Maturity Type : Hard Maturity
Maturity Date : 2022-01-31
Maturity Price : 25.00
Evaluated at bid price : 22.80
Bid-YTW : 3.93 % |
| BAM.PF.F |
FixedReset |
-1.63 % |
YTW SCENARIO
Maturity Type : Limit Maturity
Maturity Date : 2045-07-15
Maturity Price : 21.88
Evaluated at bid price : 22.30
Bid-YTW : 4.31 % |
| PWF.PR.S |
Perpetual-Discount |
-1.57 % |
YTW SCENARIO
Maturity Type : Limit Maturity
Maturity Date : 2045-07-15
Maturity Price : 22.82
Evaluated at bid price : 23.13
Bid-YTW : 5.19 % |
| SLF.PR.I |
FixedReset |
-1.54 % |
YTW SCENARIO
Maturity Type : Hard Maturity
Maturity Date : 2025-01-31
Maturity Price : 25.00
Evaluated at bid price : 23.63
Bid-YTW : 4.42 % |
| BNS.PR.D |
FloatingReset |
-1.46 % |
YTW SCENARIO
Maturity Type : Hard Maturity
Maturity Date : 2022-01-31
Maturity Price : 25.00
Evaluated at bid price : 21.63
Bid-YTW : 3.81 % |
| MFC.PR.J |
FixedReset |
-1.41 % |
YTW SCENARIO
Maturity Type : Hard Maturity
Maturity Date : 2025-01-31
Maturity Price : 25.00
Evaluated at bid price : 23.00
Bid-YTW : 4.70 % |
| BAM.PR.B |
Floater |
-1.37 % |
YTW SCENARIO
Maturity Type : Limit Maturity
Maturity Date : 2045-07-15
Maturity Price : 13.69
Evaluated at bid price : 13.69
Bid-YTW : 3.66 % |
| BAM.PR.X |
FixedReset |
-1.36 % |
YTW SCENARIO
Maturity Type : Limit Maturity
Maturity Date : 2045-07-15
Maturity Price : 15.98
Evaluated at bid price : 15.98
Bid-YTW : 4.42 % |
| CU.PR.G |
Perpetual-Discount |
-1.31 % |
YTW SCENARIO
Maturity Type : Limit Maturity
Maturity Date : 2045-07-15
Maturity Price : 21.60
Evaluated at bid price : 21.91
Bid-YTW : 5.19 % |
| ENB.PR.D |
FixedReset |
-1.27 % |
YTW SCENARIO
Maturity Type : Limit Maturity
Maturity Date : 2045-07-15
Maturity Price : 16.39
Evaluated at bid price : 16.39
Bid-YTW : 5.10 % |
| BAM.PR.R |
FixedReset |
-1.21 % |
YTW SCENARIO
Maturity Type : Limit Maturity
Maturity Date : 2045-07-15
Maturity Price : 17.90
Evaluated at bid price : 17.90
Bid-YTW : 4.51 % |
| MFC.PR.M |
FixedReset |
-1.04 % |
YTW SCENARIO
Maturity Type : Hard Maturity
Maturity Date : 2025-01-31
Maturity Price : 25.00
Evaluated at bid price : 21.80
Bid-YTW : 5.32 % |
| TRP.PR.A |
FixedReset |
1.13 % |
YTW SCENARIO
Maturity Type : Limit Maturity
Maturity Date : 2045-07-15
Maturity Price : 18.80
Evaluated at bid price : 18.80
Bid-YTW : 3.81 % |
| BAM.PF.A |
FixedReset |
1.24 % |
YTW SCENARIO
Maturity Type : Limit Maturity
Maturity Date : 2045-07-15
Maturity Price : 21.71
Evaluated at bid price : 21.97
Bid-YTW : 4.38 % |
| Volume Highlights |
| Issue |
Index |
Shares
Traded |
Notes |
| SLF.PR.G |
FixedReset |
72,336 |
Nesbitt crossed blocks of 40,000 and 20,000, both at 16.30.
YTW SCENARIO
Maturity Type : Hard Maturity
Maturity Date : 2025-01-31
Maturity Price : 25.00
Evaluated at bid price : 16.20
Bid-YTW : 7.51 % |
| RY.PR.I |
FixedReset |
54,200 |
RBC crossed 50,000 at 25.21.
YTW SCENARIO
Maturity Type : Hard Maturity
Maturity Date : 2022-01-31
Maturity Price : 25.00
Evaluated at bid price : 25.16
Bid-YTW : 3.16 % |
| RY.PR.H |
FixedReset |
48,160 |
Scotia crossed 24,200 at 21.90.
YTW SCENARIO
Maturity Type : Limit Maturity
Maturity Date : 2045-07-15
Maturity Price : 21.50
Evaluated at bid price : 21.76
Bid-YTW : 3.74 % |
| TRP.PR.A |
FixedReset |
44,098 |
RBC crossed 23,300 at 18.90; TD crossed 10,000 at the same price.
YTW SCENARIO
Maturity Type : Limit Maturity
Maturity Date : 2045-07-15
Maturity Price : 18.80
Evaluated at bid price : 18.80
Bid-YTW : 3.81 % |
| BAM.PF.C |
Perpetual-Discount |
43,920 |
RBC crossed 35,000 at 20.26.
YTW SCENARIO
Maturity Type : Limit Maturity
Maturity Date : 2045-07-15
Maturity Price : 20.23
Evaluated at bid price : 20.23
Bid-YTW : 6.06 % |
| ENB.PR.H |
FixedReset |
32,870 |
YTW SCENARIO
Maturity Type : Limit Maturity
Maturity Date : 2045-07-15
Maturity Price : 15.85
Evaluated at bid price : 15.85
Bid-YTW : 4.98 % |
| There were 33 other index-included issues trading in excess of 10,000 shares. |
| Wide Spread Highlights |
| Issue |
Index |
Quote Data and Yield Notes |
| VNR.PR.A |
FixedReset |
Quote: 21.78 – 22.65
Spot Rate : 0.8700
Average : 0.5330
YTW SCENARIO
Maturity Type : Limit Maturity
Maturity Date : 2045-07-15
Maturity Price : 21.44
Evaluated at bid price : 21.78
Bid-YTW : 4.24 % |
| BAM.PR.Z |
FixedReset |
Quote: 22.02 – 22.70
Spot Rate : 0.6800
Average : 0.4535
YTW SCENARIO
Maturity Type : Limit Maturity
Maturity Date : 2045-07-15
Maturity Price : 21.61
Evaluated at bid price : 22.02
Bid-YTW : 4.44 % |
| IFC.PR.A |
FixedReset |
Quote: 17.94 – 18.57
Spot Rate : 0.6300
Average : 0.4345
YTW SCENARIO
Maturity Type : Hard Maturity
Maturity Date : 2025-01-31
Maturity Price : 25.00
Evaluated at bid price : 17.94
Bid-YTW : 7.29 % |
| GWO.PR.N |
FixedReset |
Quote: 15.54 – 16.08
Spot Rate : 0.5400
Average : 0.3524
YTW SCENARIO
Maturity Type : Hard Maturity
Maturity Date : 2025-01-31
Maturity Price : 25.00
Evaluated at bid price : 15.54
Bid-YTW : 8.00 % |
| MFC.PR.K |
FixedReset |
Quote: 20.59 – 21.35
Spot Rate : 0.7600
Average : 0.6063
YTW SCENARIO
Maturity Type : Hard Maturity
Maturity Date : 2025-01-31
Maturity Price : 25.00
Evaluated at bid price : 20.59
Bid-YTW : 5.81 % |
| BIP.PR.A |
FixedReset |
Quote: 21.86 – 22.25
Spot Rate : 0.3900
Average : 0.2450
YTW SCENARIO
Maturity Type : Limit Maturity
Maturity Date : 2045-07-15
Maturity Price : 21.54
Evaluated at bid price : 21.86
Bid-YTW : 5.05 % |