On April 23, the OSC announced:
Today the Ontario Securities Commission (OSC) published The Canadian Fixed Income Market Report and OSC Staff Notice 21-708 – OSC Staff Report on the Canadian Fixed Income Market and Next Steps to Enhance Regulation and Transparency of Fixed Income Markets. Together, these materials summarize the OSC’s study of the fixed income markets and set out the steps the OSC will take to enhance the transparency and regulation of fixed income markets.
…
“With this report, we have compiled research that confirms our focus on enhanced post-trade transparency and regulation of the fixed income markets in Canada,” said Howard Wetston, Q.C., Chair and CEO of the OSC. “Our priority now is to develop regulation that will promote more informed decision-making for market participants regardless of size, improve market integrity and ensure that the market is fair and equitable to all investors.”
The Staff Notice stated:
In light of the observations in the Report, Staff considered steps that could be taken at this time to enhance fixed income regulation to achieve the following objectives:
- 1. Facilitate more informed decision making among all market participants, irrespective of their size;
- 2. Improve market integrity; and
- 3. Ensure that the market is fair and equitable for all investors
…
In the coming year, we will take additional steps to facilitate more informed decision making by market participants for all fixed income securities, specifically:
- a. Monitoring the implementation of new CSA cost and performance reporting rules in National Instrument 31-103 Registration Requirements, Exemptions and Ongoing Registrant Obligations, which will help retail investors better understand the cost of their fixed income transactions, and which will be fully implemented by July 2016; and
- b. Working with the CSA to make it easier for investors to find relevant documents for fixed income offerings, especially trust indentures and credit agreements, in the SEDAR system.
Subject to determining exactly what they mean, I don’t have a huge amount of problems with their second intention, to make more information available on SEDAR (although I suspect that they will not address my perennial complaint regarding their prohibition on linking directly to these public documents). As a caveat to that, however, I’ll say that I suspect it won’t make an atom’s worth of difference: it became apparent to me about ten years ago that nobody other than the lawyers ever read bond prospectuses; if there was any information anywhere other than on Bloomberg, it didn’t really exist. And Bloomberg’s information was grossly circumscribed; the summary omitted a lot of interesting stuff, like call schedules.
I will note that my direct experience of the institutional bond market is getting pretty rusty, but I was managing a small – but still institutionally sized – corporate bond portfolio in 2007/8; things were not much different than they were in the ’90’s; the big difference was that all the dealer crap came by eMail rather than fax and snail-mail. They could improve access to information quite easily by clarifying the rules about offering memoranda; on at least one occasion, I refused to consider buying an offered bond that fit the portfolio needs quite admirably, according to the basic information available, because the only documentation the dealer had (and this dealer was the original underwriter of the deal) was the offering memorandum and they refused to send me a copy on the grounds that OSC rules forbid the dissemination of the document.
All that being said, it is a pity that the report itself was written with the purpose of providing a veneer of respectability for the next OSC implementation of mission creep. For all that the report, titled The Canadian Fixed Income Market: 2014, is quite a good collection of references.
Furthermore, a significant number of bonds, ranging from 23-47%, are privately placed and only available to accredited investors.[Footnote]
Footnote reads: Based on an analysis of FP Infomart data from 2010-2013. These securities can only be traded and held by accredited investors.
Many of these private placements will be small issues, issued to institutions like pension funds and insurance companies on a bespoke basis, but it is a great pity that this characteristic was not followed up in an effort to determine why issuers choose to issue bonds privately. For example, on September 23, 2014 I noted:
However, as has been pointed out by Ron Mendel of Hartford Investment Management in his admirable essay Private Placement Debt: Diversification, yield potential in a complementary IG asset:
Private placement investors require additional yield relative to comparable public bond issues, as lenders demand greater yield to compensate for increased liquidity risk as well as the underwriting and monitoring costs. This premium is variable over time and is a function of technical, supply and demand characteristics, credit fundamentals and insurance liability requirements. The typical liquidity premium historically ranges between 25 – 45 basis points.
For those wanting some more opinion regarding private placements, the nomenclature in the states is “144a bonds” (or 144(a)), after the rule by which our wise masters graciously permit money to be borrowed and lent privately.
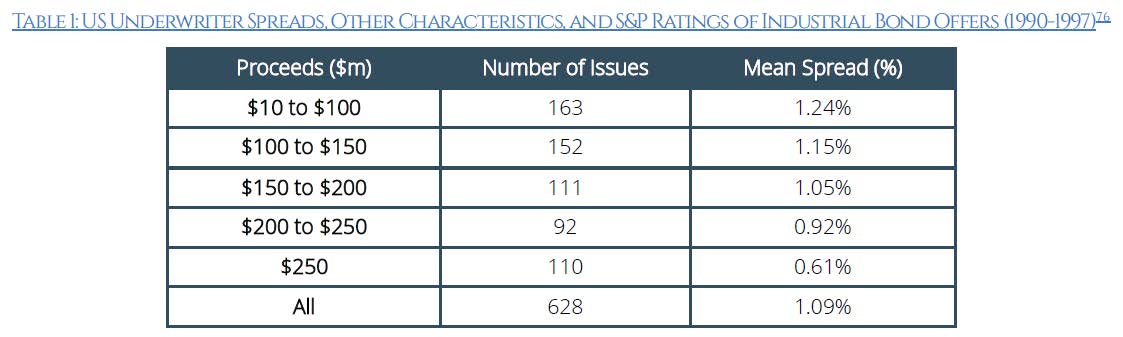
So why are there private placements? One answer is the price of underwriting a public issue, as a (now rather dated) paper by Oya Altınkılıç and Robert S. Hansen, titled Are There Economies of Scale in Underwriting Fees? Evidence of Rising External Financing Costs reports:
 Click for Big
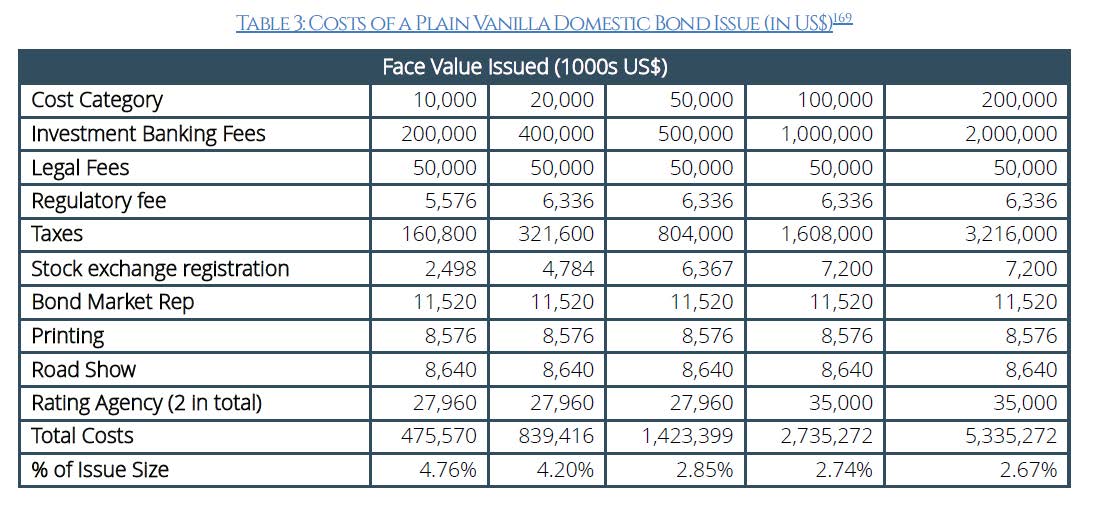
That’s not the end of it, as they show with some data for Chilean issues listed in the US market, taken from a paper by Sara Zervos titled The Transactions Costs of Primary Market Issuance: The Case of Brazil, Chile, and Mexico:
 Click for Big
Wow! Issuance costs of nearly 5% on a small issue is something fierce! While Canadian issuers will not have to deal with such an obscene amount of taxes on a bond issue, I suspect that the legal cost quoted …:
While legal fees can range according to any complications that arise, most parties quoted an approximate $50,000 for completing a straightforward deal.
… is absurdly low in today’s environment, particularly for smaller issuers that do not have a shelf prospectus in place. If we look at the recent Split Share offering by Brompton (a cookie-cutter SplitShare Corporation), found on SEDAR at “Brompton Oil Split Corp. Jan 30 2015 15:09:40 ET Final long form prospectus – English PDF 991 K” (not allowed to link!) we find:
The Company will pay the expenses incurred in connection with the offering of Preferred Shares and Class A Shares by the Company, estimated to be $725,000.
That was before selling fees of 3% (preferred) and 6% (Capital Units). An old buddy of mine blew his brains out with an ETF … spent about $750,000 and couldn’t sell the issue. So basically I think this report suffers by not examining issuance costs more – and yes, I know that legal fees aren’t public information and are therefore beyond the scope of this report. I don’t care. If they’re going to talk about costs of issue, they should have at least highlighted the fact that the cost information presented is both non-Canadian and dated.
I will also note that the information presented in the report does not differentiate by term; if we look at the information presented on SEDAR as “TELUS Corporation Mar 24 2015 17:34:26 ET Underwriting or agency agreements (or amendment thereto) PDF 275 K ” (not allowed to link!) we find:
(i) up to Cdn.$250,000,000 principal amount of Series CS Notes at a price of Cdn.$999.62 per Cdn.$1,000 principal amount of 1.50% Notes, Series CS due March 27, 2018 (the “Series CS Notes”) plus accrued interest, if any, from March 27, 2015 to the date of delivery, (ii) up to Cdn.$1,000,000,000 principal amount of Series CT Notes at a price of Cdn.$997.31 per Cdn.$1,000 principal amount of 2.35% Notes, Series CT due March 28, 2022 (the “Series CT Notes”) plus accrued interest, if any, from March 27, 2015 to the date of delivery, and (iii) up to Cdn.$500,000,000 principal amount of Series CU Notes at a price of Cdn.$999.72 per Cdn.$1,000 principal amount of 4.40% Notes, Series CU due January 29, 2046 (the “Series CU Notes”)
…
the Company agrees to pay to the Agents, at the Closing Date a fee of (i) Cdn. $2.50 per Cdn. $1,000 principal amount of Series CS Notes actually sold, (ii) Cdn. $3.70 per Cdn. $1,000 principal amount of Series CT Notes actually sold, and (iii) Cdn. $5.00 per Cdn. $1,000 principal amount of Series CU Notes actually sold, in each case exclusive of any applicable goods and services tax or any similar applicable tax.
So the underwriting costs in this case were 25bp for the Short-Term notes, 37bp for the Medium-Term notes and 50bp for the Long-Term notes.
But anyway, the main thrust of the report is to detail the difficulties retail investors have in building a portfolio of directly held bonds, e.g.:
In a 2010 study of US corporate bond trades, researchers observed that transaction costs were ten to twenty times lower for trades of $500,000 or more than for trades up to $100,000.[Footnotes]
[Footnotes read]: Transactions under $100,000 are considered to be retail transactions. See Appendix I: Additional Background, “Table 4: Spreads by Trade Size – Corporate Bonds (November 2008-April 2010)”.
Equivalent Canadian data is not available; however, we would expect to see a large disparity in Canada as well.
They do acknowledge concerns about transparency:
Negotiated Markets
In the fixed income market, there are many differentiated securities that do not trade very frequently. This leads to high search costs for each transaction since the market for individual securities tends to be concentrated among a small number of participants (fragmented liquidity).
This is one of the reasons the fixed income market operates as a negotiated market, where buyers and sellers negotiate the price of each transaction.
To facilitate the matching of buyers and sellers, dealers (or market makers) can help facilitate a transaction by serving as the trade counterparty. The market maker then assumes inventory risk while it looks for a seller (or buyer) to net out its position.
Complete transparency can deter market makers from participating for a number of reasons. One concern is that buyers or sellers can gain bargaining power over market makers. This could allow them to determine a market maker’s position and cost information, which drastically reduces the market maker’s potential profit.
The other concern is the free-rider effect: in a negotiated market, the initial search costs are high, but the marginal cost of disseminating and using this information is (or close to) zero. Full transparency can reduce bid-ask spreads but also reduces the incentive for market makers to participate because they rely on these spreads to compensate for their search efforts. While spreads in the fixed income market appear high relative to those in the equity market, one could argue that it is more appropriate to compare the fixed income market to other negotiated markets such as those for real estate and private equity, where both search and transaction costs can be significantly higher.
They acknowledge disputes about the effects of TRACE, without actually defining what they mean by liquidity:
A consensus on lower transaction costs with a continuing debate on liquidity Empirical evidence, gathered after the rollout of the TRACE system, showed that post-trade transparency lowered transaction costs in the fixed income market without decreasing liquidity.[Footnotes] As a corollary, these findings indicate that greater price transparency, leads to less information asymmetry and lower economic rents,[Footnote] which makes the market more efficient.[Footnote] However, in a more recent study, researchers argue that while post-trade transparency has reduced transaction costs in the fixed income market, it has had a negative impact on liquidity, particularly for less frequently traded bonds.[Footnote]
Footnotes read:
See Edwards, Amy K., Lawrence E. Harris, and Michael S. Piwowar. “Corporate Bond Market Transaction Costs and Transparency.” The Journal of Finance 62.3 (2007): 1421-451. Web. 24 July 2014. <[LINK]>; Learner, Heidi. “An Examination of Transparency in European Bond Markets.” An Examination of Transparency in European Bond Markets. CFA Institute, Oct. 2011. Web. 06 Apr. 2015. <[LINK}>;and M. Goldstein, E. Hotchkiss, and E. Sirri, “Transparency and Liquidity: A Controlled Experiment on Corporate Bonds,” Babson College working paper, 2005, <[LINK]>.
See International Comparisons, “Comparing Transparency” for additional details related to TRACE.
Economic rent represents the return on an asset in excess of the amount needed to keep it productive in a competitive market. Alternatively economic rent is the return that can be eliminated by competition. Rent-seeking actors are those that enter a market to capture economic rents.
Large traders can obtain a proprietary advantage by keeping the traded prices of bonds hidden. See United States. Library of Congress. Congressional Research Service. Does Price Transparency Improve Market Efficiency? Implications of Empirical Evidence in Other Markets for the Health Sector. By D. Andrew Austin and Jane G. Gravelle. United States Congress, 24 July 2007. Web. 31 July 2014. <[LINK]>.
Asquith, Paul, Thomas R. Covert, and Parag Pathak. The Effects of Mandatory Transparency in Financial Market Design: Evidence from the Corporate Bond Market. Working paper. SSRN, 5 Sept. 2013. Web. 25 Nov. 2014. <[LINK]>
I reviewed the last of these papers in the post TRACE and the Bond Market. And I’m pretty upset that they did not include the observations of Bessembinder and Maxwell (which I reviewed in the post TRACE and Corporate Bond Market Transparency) in this section, although they’re clearly aware of this paper since they cited it twice. One observation is critical and was conveniently ignored; it was:
Market participants with whom we spoke, including both dealers and the traders at investment firms who are their customers, were nearly unanimous in the view that trading is more difficult after the introduction of TRACE. Whereas it may have previously been possible to complete a sizeable bond purchase with a single phone call to a dealer who held sufficient quantities of the bond in inventory, the post-TRACE environment may involve communications with multiple dealers, and delays as the dealers search for counterparties. A bond trader with a major insurance company told us that there is less liquidity, in that market makers carried less “product,” and it has become more difficult to locate bonds for purchase in the post-TRACE environment. A bond trader for a major investment company responded to the publication of Bessembinder, Maxwell, and Venkataraman (2006) by sending the authors an unsolicited e-mail stating: “I want to be able to execute a trade even if a bond dealer does not have a simultaneous counterparty lined up…. [T]oo much price transparency reduces dealers’ willingness to commit capital…. [T]he focus on the bid-ask spread is too narrow, and a case of being penny-wise and pound-foolish.”
However, having acknowledged (however imperfectly) a debate about liquidity, the authors of the OSC paper immediately start advocating for greater transparency:
Why is price transparency important?
Markets can operate more efficiently when pricing is transparent for both buyers and sellers. Price transparency helps to ensure the buyer can make a more informed purchase, especially in financial markets that involve an intermediary, and helps sellers by making it easier to gauge demand. Price transparency also helps to prevent price discrimination in the market, where different people pay different prices for otherwise identical goods or services.
Why are prices in some markets less transparent than others?
1. Search costs. There are opportunity, including time, and monetary costs to acquire information; and
2. Privacy. Some participants are concerned that any increase in transparency might have a negative effect on their ability to manage their positions. However, it is not clear if these privacy concerns should dominate if most participants do not intend to trade the securities.
What are some of the arguments for greater transparency in the fixed income market?
1. The internet has significantly reduced search costs for consumers across many industries ranging from consumer retail to stock markets by reducing the marginal cost of information dissemination close to zero; and
2. Given that fixed income markets are generally not liquid, many participants in the market are buy-and-hold investors, so it is not clear if the privacy concerns are valid for investors that do not intend to trade these bonds.
And then there’s the usual whining:
Transparency depends on the investor’s level of sophistication … The market is relatively transparent to institutional investors … There is limited information available to retail investors … COSTS TO INVESTORS ARE NOT TRANSPARENT
In short, as I stated at the beginning of this post, the report itself was written with the purpose of providing a veneer of respectability for the next OSC implementation of mission creep. There is very little attempt to address the issue of ‘what is the corporate bond market for’ and an overarching bias towards the idea that greater transparency is always good. Well, maybe it’s good for retail investors, but is it good for the capital markets? Is it good for issuers who seek to raise funds to invest in fixed assets? As Assiduous Readers know, I take the view that it ain’t. Retail investors are well served by ETFs and, to a lesser extent (because of the fees!), by mutual funds; I have explained in the past Why only millionaires should invest in bonds directly. I have advocated for a version of Treasury Direct to be established in Canada, but those are for Canada bonds; and it’s in the context of creating something more useful than CSBs for small retail investors.
All in all, if the OSC really wants to know how investors get abused in the bond marketplace, they would be better advised to investigate manipulation of the bond indices.
But my prediction is that increased transparency will in fact come to the Canadian corporate bond market and quote spreads will in fact tighten and all the morons will be very, very happy. As a corollary to this, the market will become thinner, therefore more volatile and less liquid (when we define liquidity along the lines of ‘the ability to perform a 1-million pv transaction in a reasonable time without significant market impact); therefore investors will want higher spreads, therefore more issuers will head to the States and build fewer factories. We might also see an increase in the bespoke market, where issuers do more financing by with tiny issues sold in their entirety to insurance companies and pension plans. But the allegedly good part is a headline and the bad parts are only statistics, so who cares?
Morningstar had an article on the paper, titled Regulators: Retail investors deserve true bond transparency, which makes it clear that facts don’t matter; increased transparency and the degradation of Canada’s tiny corporate bond market is a foregone conclusion:
”We believe there is a need for additional transparency, both to regulators and to market participants, as well as enhanced regulation,” says Susan Greenglass, director of market regulation at the OSC.
In the Bank of Canada’s December 2003 Financial System Review, Tran-Minh Vu wrote Transparency in the Canadian Fixed-Income Market: Opportunities and Constraints which included a very peculiar assertion:
In Canada, because of the decentralized nature of the fixed-income market, customers typically contact several dealers to obtain the best price.[Footnote]
Footnote reads: Because they are primarily institutional investors, customers usually have a fiduciary duty to obtain at least three quotes from different dealers.
Let’s just say I’d like to see some supporting documentation for both parts of that quotation!