The big news of the day was the FOMC press release:
Information received since the Federal Open Market Committee met in March suggests that economic growth slowed during the winter months, in part reflecting transitory factors. The pace of job gains moderated, and the unemployment rate remained steady. A range of labor market indicators suggests that underutilization of labor resources was little changed. Growth in household spending declined; households’ real incomes rose strongly, partly reflecting earlier declines in energy prices, and consumer sentiment remains high. Business fixed investment softened, the recovery in the housing sector remained slow, and exports declined. Inflation continued to run below the Committee’s longer-run objective, partly reflecting earlier declines in energy prices and decreasing prices of non-energy imports. Market-based measures of inflation compensation remain low; survey-based measures of longer-term inflation expectations have remained stable.
The word “transitory” was bad for bonds:
U.S. government debt declined a third day as a rout in European bonds made U.S. securities less attractive. Yields briefly dropped after the Fed said a first-quarter economic slowdown was transitory, with the selloff recommencing as traders looked in vain for some direction in the central bank’s policy statement.
“They’re like everyone else, looking at the data and saying ‘we think it’s transitory,’” said New York-based Jack Flaherty, who manages the $17 billion GAM Unconstrained Bond Strategy. “But their crystal ball is no better than anyone else’s.”
The yield on the 10-year note rose four basis points, or 0.04 percentage point, to 2.04 percent as of 5 p.m. in New York, according to Bloomberg Bond Trader data. The price of the benchmark 2 percent security due in February 2025 fell 10/32, or $3.13 per $1,000 face value, to 99 21/32.
Yields touched 2.08 percent, the highest since March 16, still below the 2014 close of 2.17 percent.
Rout in European bonds? That sounds interesting:
German 10-year bond yields rose 12 basis points, or 0.12 percentage point, to a seven-week high of 0.29 percent as of the London close. That’s the biggest jump since January 2013. The 0.5 percent bund due in February 2025 fell 1.195, or 11.95 euros per 1,000-euro face amount, to 102.075.
The volume of bund futures contracts traded climbed to 1,099,253, the most since March 5.
Germany got bids of 3.649 billion euros at its notes auction, short of the 4 billion-euro sales goal. It’s the first time an auction of five-year debt missed the target since Jan. 21 and the third bond sale that was technically uncovered this year, according to data compiled by Bloomberg. The nation sold the securities due in 2020 at an average yield of minus 0.07 percent.
Adding to the supply pressure, Italy auctioned 8.25 billion euros of debt on Wednesday, while Portugal sold 2.5 billion euros of 10- and 30-year bonds via banks.
Bonds extended losses across Europe amid signs inflation is reviving in the region, reducing the value of fixed payments on bonds.
So at least Bernanke will have interesting things to discuss:
Pimco has hired former Federal Reserve chairman Ben Bernanke as a senior adviser, the bond fund manager said Wednesday.
It’s the latest private venture for Bernanke, who since his departure from the nation’s central bank last year has been on the speaking circuit and was recently hired by a major hedge fund as an adviser as well.
Bernanke will provide economic advice to Pimco’s fund managers and will occasionally interact with the firm’s clients, the Newport Beach, Calif.-based company said.
In response to higher bond yields and particularly higher anticipated GOC-5 rates, the Canadian preferred share market roared ahead today, albeit rather unevenly, with PerpetualDiscounts up 9bp, FixedResets winning 91bp and DeemedRetractibles gaining 7bp. The Performance Highlights table is, um, about what you would expect, with no losers. Volume was above average, with more than usual inter-dealer block trades.
For as long as the FixedReset market is so violently unsettled, I’ll keep publishing updates of the more interesting and meaningful series of FixedResets’ Implied Volatilities. This doesn’t include Enbridge because although Enbridge has a large number of issues outstanding, all of which are quite liquid, the range of Issue Reset Spreads is too small for decent conclusions. The low is 212bp (ENB.PR.H; second-lowest is ENB.PR.D at 237bp) and the high is a mere 268 for ENB.PF.G.
Remember that all rich /cheap assessments are:
» based on Implied Volatility Theory only
» are relative only to other FixedResets from the same issuer
» assume constant GOC-5 yield
» assume constant Implied Volatility
» assume constant spread
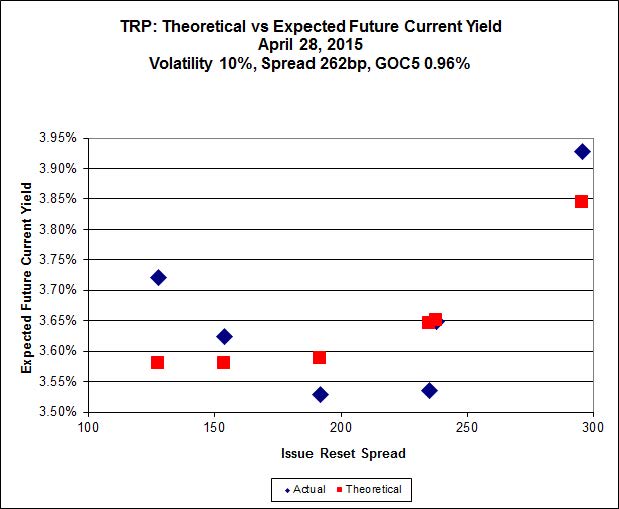
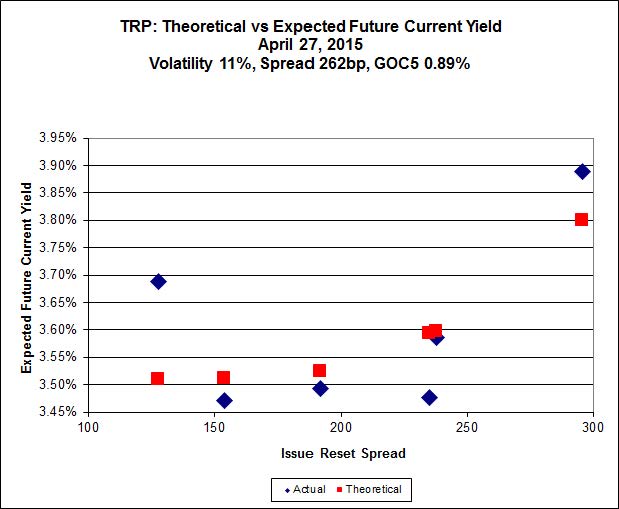
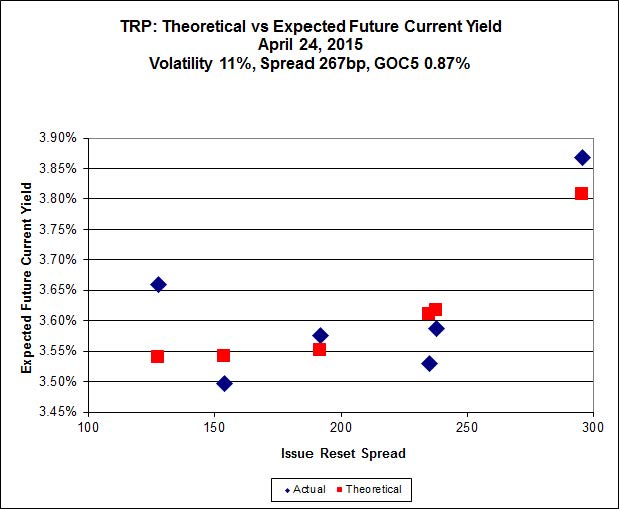
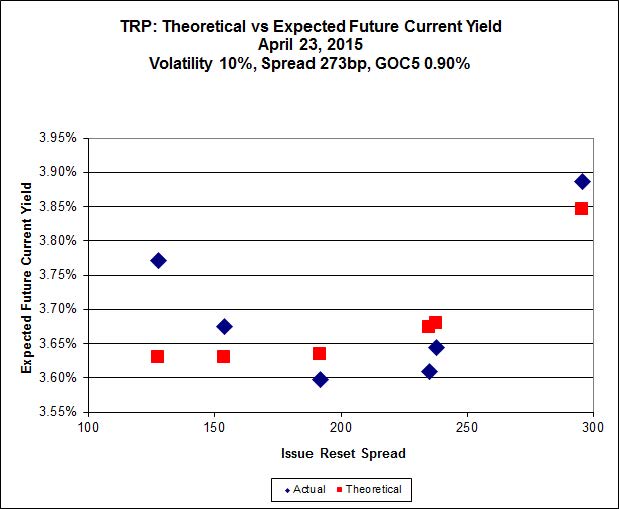
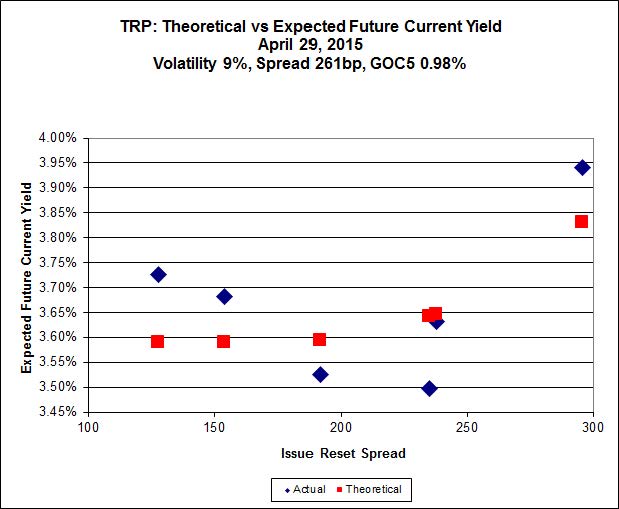
Here’s TRP:
Click for Big
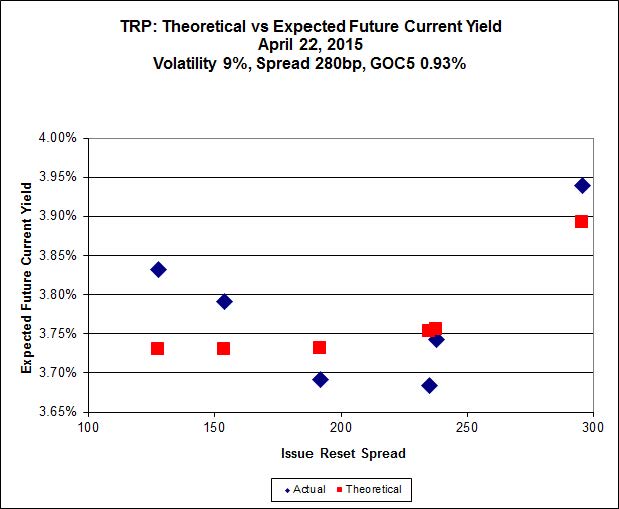
TRP.PR.E, which resets 2019-10-30 at +235, is bid at 23.81 to be $0.95 rich, while TRP.PR.G, resetting 2020-11-30 at +296, is $0.71 cheap at its bid price of 25.00.
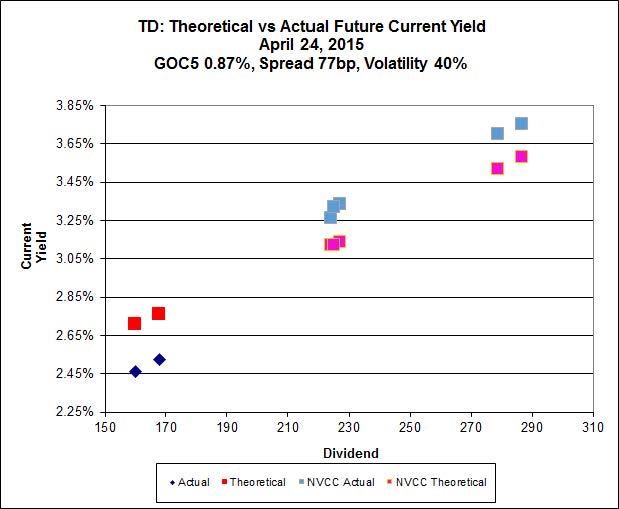
Click for Big
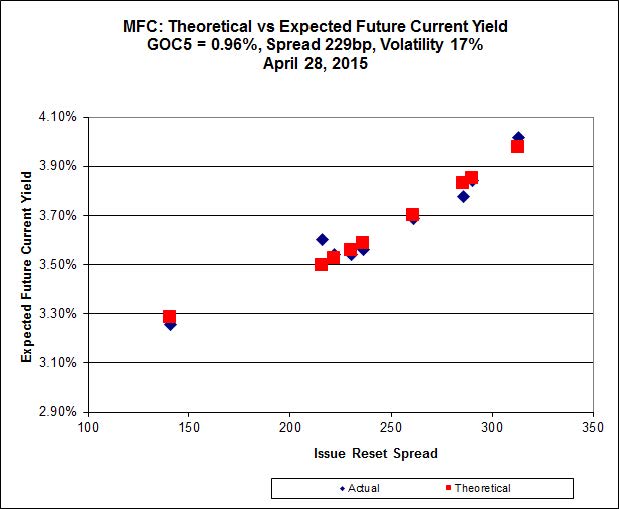
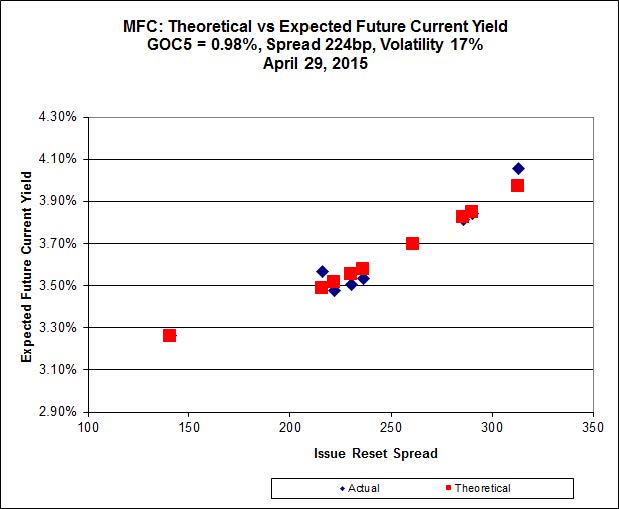
Another excellent fit, but the numbers are perplexing. Implied Volatility for MFC continues to be a conundrum. It is still too high if we consider that NVCC rules will never apply to these issues; it is still too low if we consider them to be NVCC non-compliant issues (and therefore with Deemed Maturities in the call schedule).
Most expensive is MFC.PR.N, resetting at +230 on 2020-3-19, bid at 23.40 to be $0.31 rich, while MFC.PR.H, resetting at +313bp on 2017-3-19, is bid at 25.35 to be $0.52 cheap.
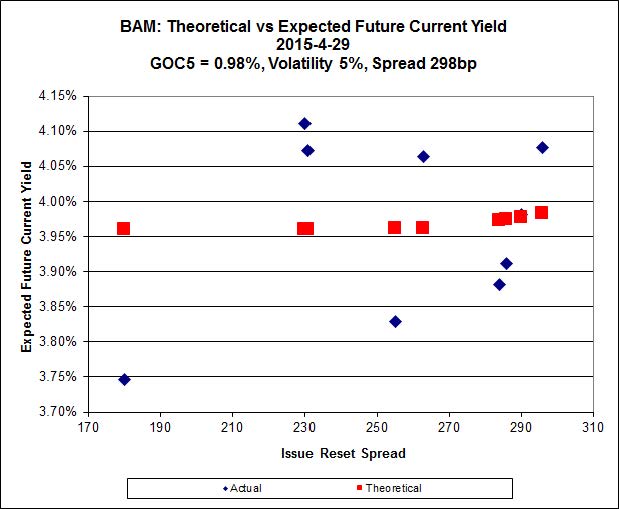
Click for Big
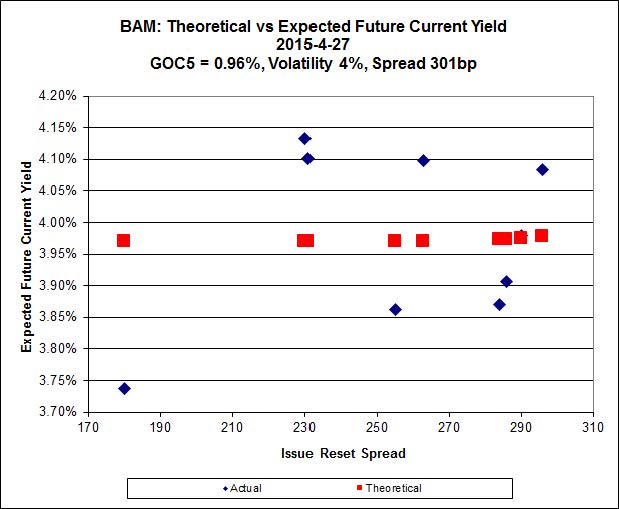
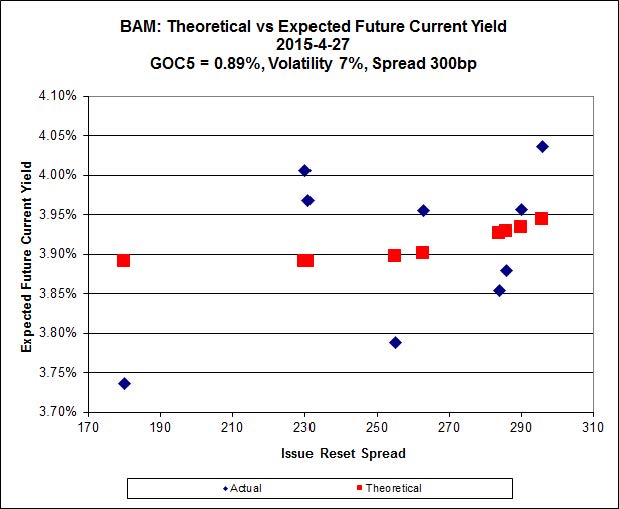
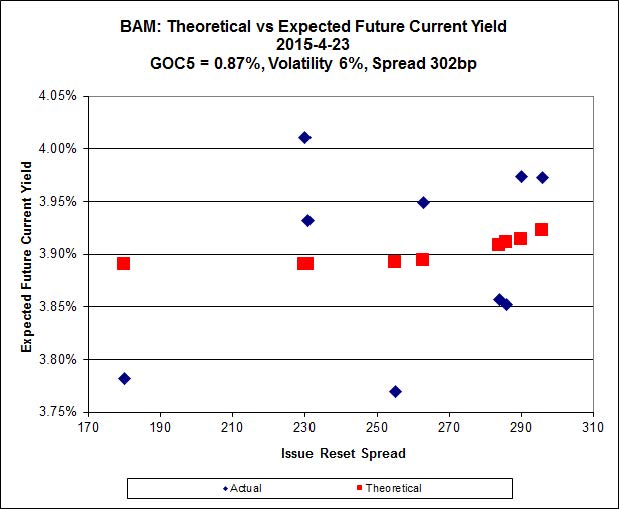
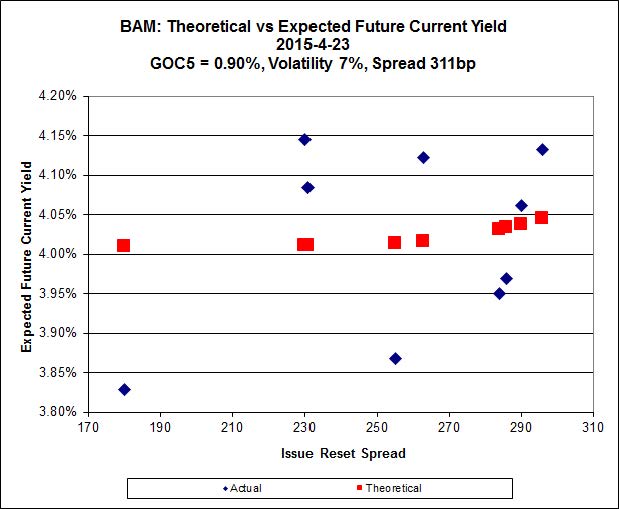
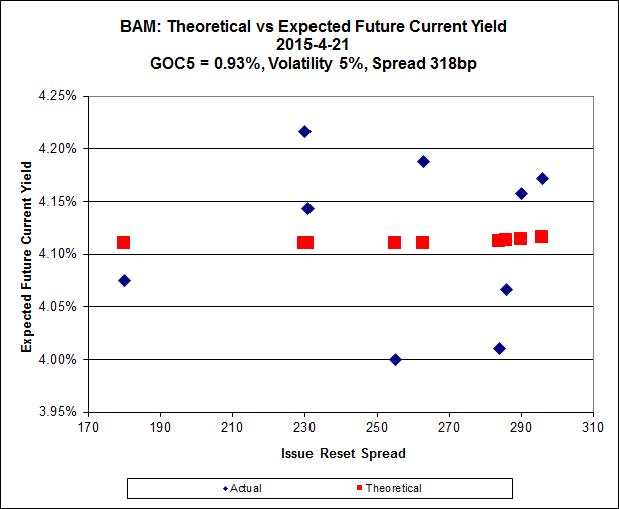
The cheapest issue relative to its peers is BAM.PR.R, resetting at +230bp on 2016-6-30, bid at 19.95 to be $0.76 cheap. BAM.PR.X, resetting at +180bp 2017-6-30 is bid at 18.55 and appears to be $1.00 rich.

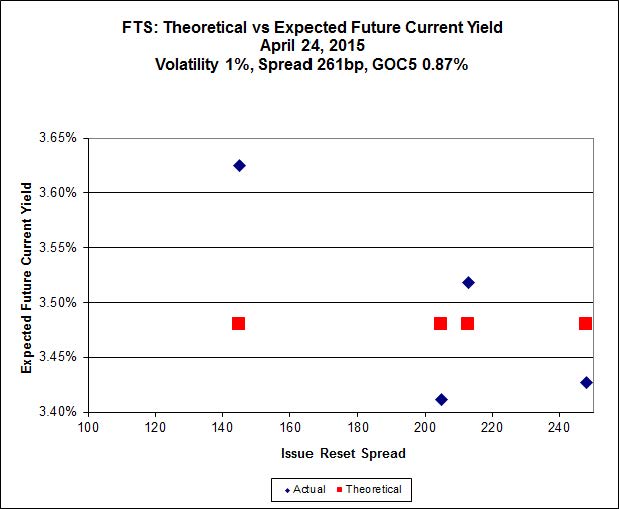
Click for Big
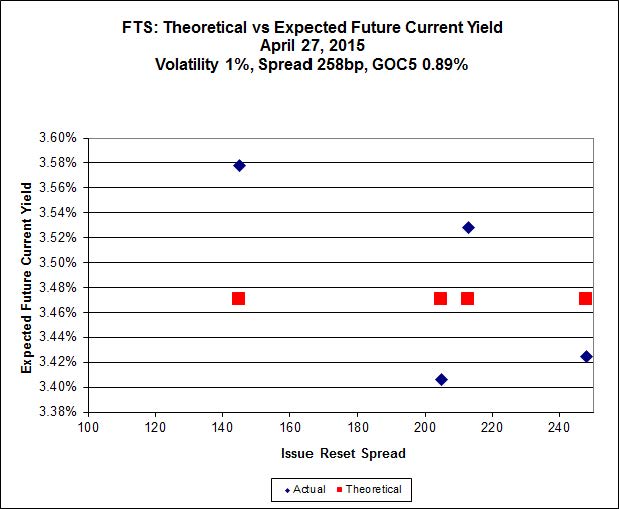
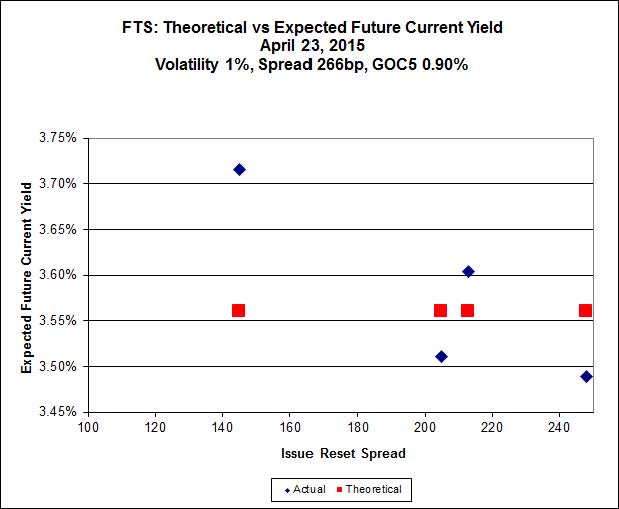
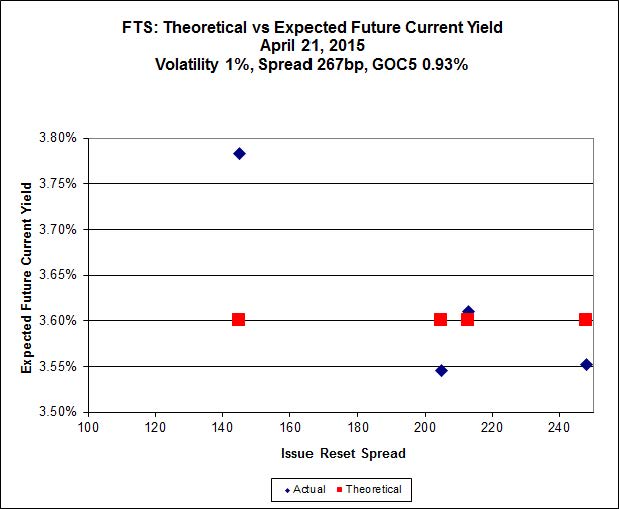
FTS.PR.H, with a spread of +145bp, and bid at 16.20, looks $0.91 cheap and resets 2015-6-1. FTS.PR.M, with a spread of +248bp and resetting 2019-12-1, is bid at 24.95 and is $0.58 rich.
Click for Big
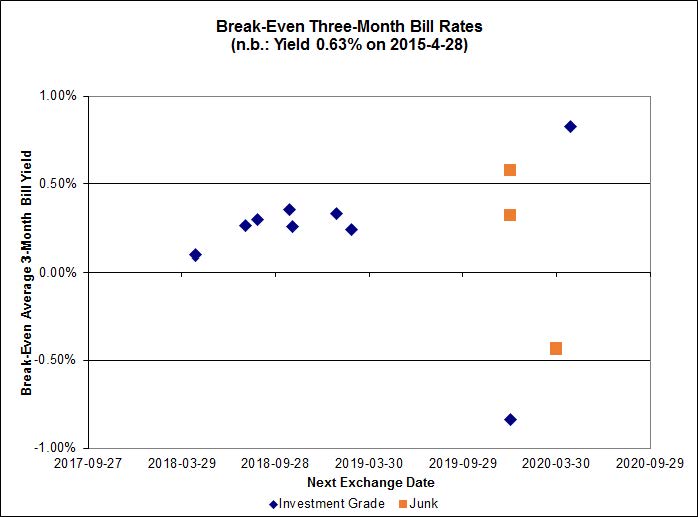
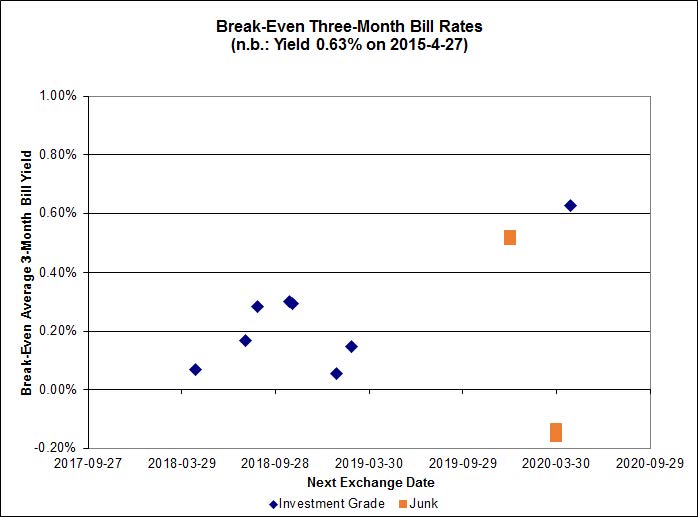
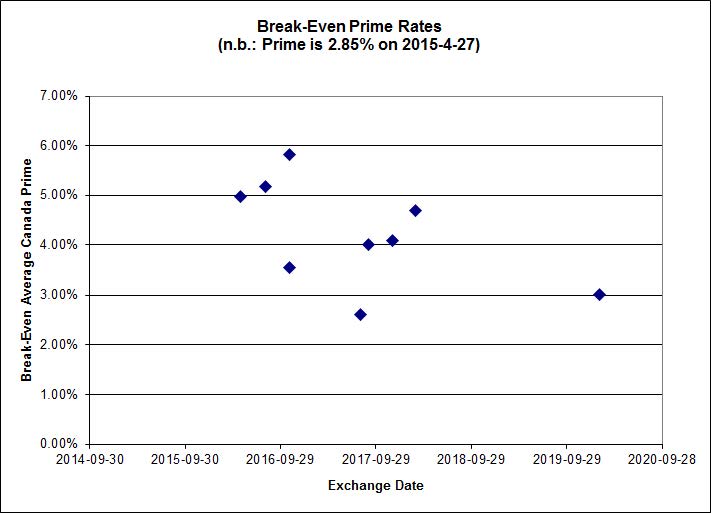
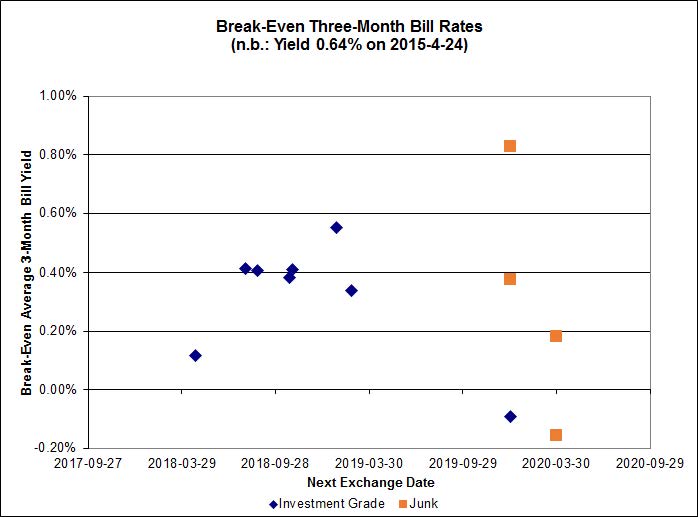
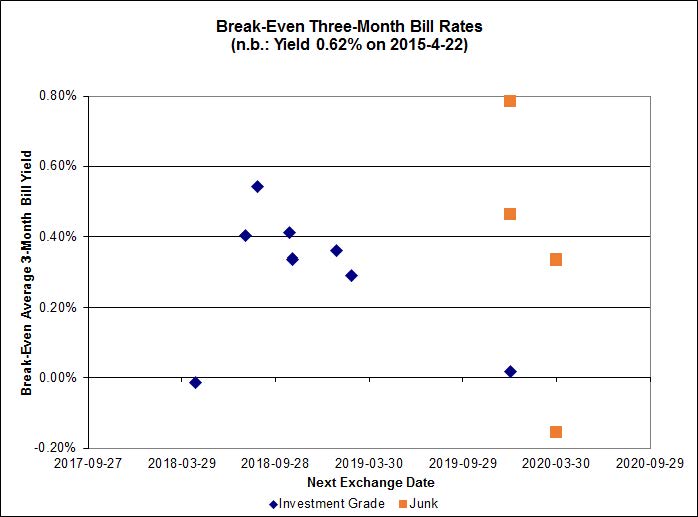
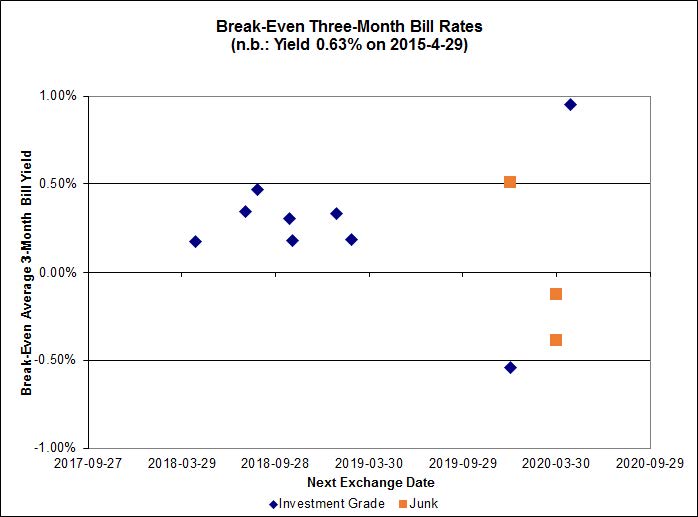
Investment-grade pairs now predict an average over the next five years of about 0.25%, but TRP.PR.A / TRP.PR.F is an outlier at -0.54% and the new BNS.PR.Y / BNS.PR.D pair is at +0.95%. The DC.PR.B / DC.PR.D pair retains its customary outlier status, with a breakeven rate of -1.52%.
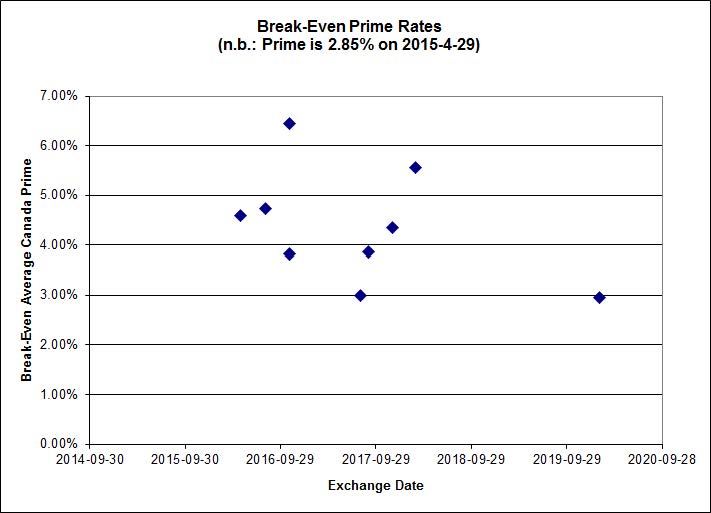
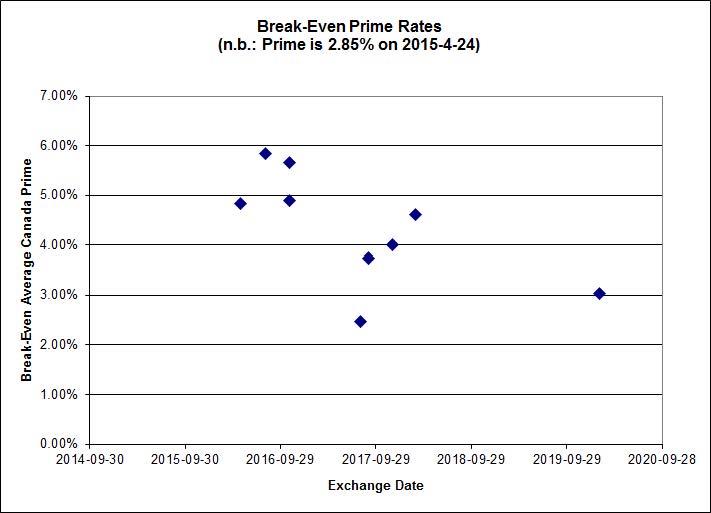
Click for Big
Shall we just say that this exhibits a high level of confidence in the continued rapacity of Canadian banks?
| HIMIPref™ Preferred Indices These values reflect the December 2008 revision of the HIMIPref™ Indices Values are provisional and are finalized monthly |
|||||||
| Index | Mean Current Yield (at bid) |
Median YTW |
Median Average Trading Value |
Median Mod Dur (YTW) |
Issues | Day’s Perf. | Index Value |
| Ratchet | 0.00 % | 0.00 % | 0 | 0.00 | 0 | 2.3897 % | 2,229.7 |
| FixedFloater | 0.00 % | 0.00 % | 0 | 0.00 | 0 | 2.3897 % | 3,898.6 |
| Floater | 3.26 % | 3.42 % | 55,665 | 18.71 | 4 | 2.3897 % | 2,370.4 |
| OpRet | 4.42 % | -6.02 % | 39,596 | 0.09 | 2 | 0.1376 % | 2,769.1 |
| SplitShare | 4.57 % | 4.55 % | 68,452 | 3.38 | 3 | 0.0934 % | 3,228.0 |
| Interest-Bearing | 0.00 % | 0.00 % | 0 | 0.00 | 0 | 0.1376 % | 2,532.1 |
| Perpetual-Premium | 5.32 % | 3.53 % | 70,686 | 0.09 | 25 | 0.0206 % | 2,520.3 |
| Perpetual-Discount | 5.13 % | 5.29 % | 137,780 | 14.96 | 9 | 0.0852 % | 2,779.8 |
| FixedReset | 4.45 % | 3.74 % | 285,909 | 16.52 | 86 | 0.9057 % | 2,383.7 |
| Deemed-Retractible | 4.93 % | 2.91 % | 112,075 | 0.32 | 36 | 0.0688 % | 2,648.4 |
| FloatingReset | 2.51 % | 3.07 % | 72,413 | 6.22 | 9 | 0.4494 % | 2,319.4 |
| Performance Highlights | |||
| Issue | Index | Change | Notes |
| TRP.PR.D | FixedReset | 1.05 % | YTW SCENARIO Maturity Type : Limit Maturity Maturity Date : 2045-04-29 Maturity Price : 22.42 Evaluated at bid price : 23.13 Bid-YTW : 3.64 % |
| IAG.PR.G | FixedReset | 1.05 % | YTW SCENARIO Maturity Type : Hard Maturity Maturity Date : 2025-01-31 Maturity Price : 25.00 Evaluated at bid price : 25.00 Bid-YTW : 3.92 % |
| BNS.PR.D | FloatingReset | 1.12 % | YTW SCENARIO Maturity Type : Hard Maturity Maturity Date : 2022-01-31 Maturity Price : 25.00 Evaluated at bid price : 22.51 Bid-YTW : 3.23 % |
| BAM.PR.R | FixedReset | 1.17 % | YTW SCENARIO Maturity Type : Limit Maturity Maturity Date : 2045-04-29 Maturity Price : 19.95 Evaluated at bid price : 19.95 Bid-YTW : 4.19 % |
| ENB.PR.Y | FixedReset | 1.23 % | YTW SCENARIO Maturity Type : Limit Maturity Maturity Date : 2045-04-29 Maturity Price : 19.69 Evaluated at bid price : 19.69 Bid-YTW : 4.43 % |
| BAM.PR.T | FixedReset | 1.35 % | YTW SCENARIO Maturity Type : Limit Maturity Maturity Date : 2045-04-29 Maturity Price : 20.20 Evaluated at bid price : 20.20 Bid-YTW : 4.15 % |
| FTS.PR.M | FixedReset | 1.38 % | YTW SCENARIO Maturity Type : Limit Maturity Maturity Date : 2045-04-29 Maturity Price : 23.18 Evaluated at bid price : 24.95 Bid-YTW : 3.44 % |
| BAM.PF.B | FixedReset | 1.42 % | YTW SCENARIO Maturity Type : Limit Maturity Maturity Date : 2045-04-29 Maturity Price : 21.84 Evaluated at bid price : 22.21 Bid-YTW : 4.12 % |
| BMO.PR.T | FixedReset | 1.45 % | YTW SCENARIO Maturity Type : Limit Maturity Maturity Date : 2045-04-29 Maturity Price : 22.76 Evaluated at bid price : 23.85 Bid-YTW : 3.35 % |
| BAM.PF.E | FixedReset | 1.45 % | YTW SCENARIO Maturity Type : Limit Maturity Maturity Date : 2045-04-29 Maturity Price : 22.31 Evaluated at bid price : 23.05 Bid-YTW : 3.96 % |
| MFC.PR.M | FixedReset | 1.46 % | YTW SCENARIO Maturity Type : Hard Maturity Maturity Date : 2025-01-31 Maturity Price : 25.00 Evaluated at bid price : 23.64 Bid-YTW : 4.34 % |
| BNS.PR.Z | FixedReset | 1.47 % | YTW SCENARIO Maturity Type : Hard Maturity Maturity Date : 2022-01-31 Maturity Price : 25.00 Evaluated at bid price : 22.84 Bid-YTW : 3.88 % |
| FTS.PR.G | FixedReset | 1.50 % | YTW SCENARIO Maturity Type : Limit Maturity Maturity Date : 2045-04-29 Maturity Price : 21.39 Evaluated at bid price : 21.72 Bid-YTW : 3.66 % |
| MFC.PR.L | FixedReset | 1.57 % | YTW SCENARIO Maturity Type : Hard Maturity Maturity Date : 2025-01-31 Maturity Price : 25.00 Evaluated at bid price : 22.00 Bid-YTW : 5.10 % |
| ENB.PF.A | FixedReset | 1.59 % | YTW SCENARIO Maturity Type : Limit Maturity Maturity Date : 2045-04-29 Maturity Price : 21.43 Evaluated at bid price : 21.69 Bid-YTW : 4.37 % |
| MFC.PR.N | FixedReset | 1.69 % | YTW SCENARIO Maturity Type : Hard Maturity Maturity Date : 2025-01-31 Maturity Price : 25.00 Evaluated at bid price : 23.40 Bid-YTW : 4.40 % |
| TRP.PR.E | FixedReset | 1.71 % | YTW SCENARIO Maturity Type : Limit Maturity Maturity Date : 2045-04-29 Maturity Price : 22.73 Evaluated at bid price : 23.81 Bid-YTW : 3.55 % |
| TD.PF.A | FixedReset | 1.76 % | YTW SCENARIO Maturity Type : Limit Maturity Maturity Date : 2045-04-29 Maturity Price : 22.92 Evaluated at bid price : 24.25 Bid-YTW : 3.30 % |
| ENB.PR.D | FixedReset | 1.79 % | YTW SCENARIO Maturity Type : Limit Maturity Maturity Date : 2045-04-29 Maturity Price : 19.85 Evaluated at bid price : 19.85 Bid-YTW : 4.30 % |
| ENB.PR.P | FixedReset | 1.83 % | YTW SCENARIO Maturity Type : Limit Maturity Maturity Date : 2045-04-29 Maturity Price : 20.60 Evaluated at bid price : 20.60 Bid-YTW : 4.32 % |
| IFC.PR.C | FixedReset | 1.86 % | YTW SCENARIO Maturity Type : Hard Maturity Maturity Date : 2025-01-31 Maturity Price : 25.00 Evaluated at bid price : 24.70 Bid-YTW : 3.84 % |
| SLF.PR.H | FixedReset | 2.11 % | YTW SCENARIO Maturity Type : Hard Maturity Maturity Date : 2025-01-31 Maturity Price : 25.00 Evaluated at bid price : 21.75 Bid-YTW : 4.93 % |
| ENB.PF.C | FixedReset | 2.16 % | YTW SCENARIO Maturity Type : Limit Maturity Maturity Date : 2045-04-29 Maturity Price : 21.47 Evaluated at bid price : 21.76 Bid-YTW : 4.35 % |
| ENB.PR.F | FixedReset | 2.23 % | YTW SCENARIO Maturity Type : Limit Maturity Maturity Date : 2045-04-29 Maturity Price : 20.14 Evaluated at bid price : 20.14 Bid-YTW : 4.40 % |
| BMO.PR.Q | FixedReset | 2.25 % | YTW SCENARIO Maturity Type : Hard Maturity Maturity Date : 2022-01-31 Maturity Price : 25.00 Evaluated at bid price : 23.14 Bid-YTW : 3.62 % |
| ENB.PF.G | FixedReset | 2.28 % | YTW SCENARIO Maturity Type : Limit Maturity Maturity Date : 2045-04-29 Maturity Price : 21.59 Evaluated at bid price : 21.95 Bid-YTW : 4.36 % |
| ENB.PR.B | FixedReset | 2.35 % | YTW SCENARIO Maturity Type : Limit Maturity Maturity Date : 2045-04-29 Maturity Price : 19.60 Evaluated at bid price : 19.60 Bid-YTW : 4.35 % |
| MFC.PR.K | FixedReset | 2.45 % | YTW SCENARIO Maturity Type : Hard Maturity Maturity Date : 2025-01-31 Maturity Price : 25.00 Evaluated at bid price : 23.00 Bid-YTW : 4.46 % |
| TRP.PR.F | FloatingReset | 2.47 % | YTW SCENARIO Maturity Type : Limit Maturity Maturity Date : 2045-04-29 Maturity Price : 18.70 Evaluated at bid price : 18.70 Bid-YTW : 3.43 % |
| ENB.PR.H | FixedReset | 2.49 % | YTW SCENARIO Maturity Type : Limit Maturity Maturity Date : 2045-04-29 Maturity Price : 18.50 Evaluated at bid price : 18.50 Bid-YTW : 4.37 % |
| ENB.PF.E | FixedReset | 2.53 % | YTW SCENARIO Maturity Type : Limit Maturity Maturity Date : 2045-04-29 Maturity Price : 21.53 Evaluated at bid price : 21.86 Bid-YTW : 4.35 % |
| ENB.PR.J | FixedReset | 2.59 % | YTW SCENARIO Maturity Type : Limit Maturity Maturity Date : 2045-04-29 Maturity Price : 21.55 Evaluated at bid price : 21.81 Bid-YTW : 4.22 % |
| PWF.PR.P | FixedReset | 2.82 % | YTW SCENARIO Maturity Type : Limit Maturity Maturity Date : 2045-04-29 Maturity Price : 18.25 Evaluated at bid price : 18.25 Bid-YTW : 3.53 % |
| IFC.PR.A | FixedReset | 2.87 % | YTW SCENARIO Maturity Type : Hard Maturity Maturity Date : 2025-01-31 Maturity Price : 25.00 Evaluated at bid price : 20.78 Bid-YTW : 5.40 % |
| BAM.PR.B | Floater | 3.16 % | YTW SCENARIO Maturity Type : Limit Maturity Maturity Date : 2045-04-29 Maturity Price : 14.70 Evaluated at bid price : 14.70 Bid-YTW : 3.42 % |
| CIU.PR.C | FixedReset | 3.16 % | YTW SCENARIO Maturity Type : Limit Maturity Maturity Date : 2045-04-29 Maturity Price : 16.00 Evaluated at bid price : 16.00 Bid-YTW : 3.69 % |
| BAM.PR.K | Floater | 3.77 % | YTW SCENARIO Maturity Type : Limit Maturity Maturity Date : 2045-04-29 Maturity Price : 14.57 Evaluated at bid price : 14.57 Bid-YTW : 3.45 % |
| BAM.PR.C | Floater | 3.91 % | YTW SCENARIO Maturity Type : Limit Maturity Maturity Date : 2045-04-29 Maturity Price : 14.60 Evaluated at bid price : 14.60 Bid-YTW : 3.44 % |
| SLF.PR.G | FixedReset | 4.55 % | YTW SCENARIO Maturity Type : Hard Maturity Maturity Date : 2025-01-31 Maturity Price : 25.00 Evaluated at bid price : 17.25 Bid-YTW : 6.73 % |
| GWO.PR.N | FixedReset | 4.77 % | YTW SCENARIO Maturity Type : Hard Maturity Maturity Date : 2025-01-31 Maturity Price : 25.00 Evaluated at bid price : 18.00 Bid-YTW : 6.19 % |
| Volume Highlights | |||
| Issue | Index | Shares Traded |
Notes |
| TD.PF.E | FixedReset | 309,500 | Recent new issue. YTW SCENARIO Maturity Type : Limit Maturity Maturity Date : 2045-04-29 Maturity Price : 23.16 Evaluated at bid price : 25.08 Bid-YTW : 3.60 % |
| TRP.PR.G | FixedReset | 133,186 | Nesbitt sold 12,900 to RBC at 25.00, crossed 40,000 at 25.00, then crossed another 40,000 at 25.01. YTW SCENARIO Maturity Type : Limit Maturity Maturity Date : 2045-04-29 Maturity Price : 23.13 Evaluated at bid price : 25.00 Bid-YTW : 3.74 % |
| ENB.PR.D | FixedReset | 94,550 | RBC sold 17,700 to anonymous at 19.70, crossed 25,000 at 19.85, and crossed 10,000 at 19.76. YTW SCENARIO Maturity Type : Limit Maturity Maturity Date : 2045-04-29 Maturity Price : 19.85 Evaluated at bid price : 19.85 Bid-YTW : 4.30 % |
| CM.PR.Q | FixedReset | 92,970 | Scotia bought blocks of 19,000 and 10,000 from CIBC at 25.00, and bought 20,000 from RBC at the same price. YTW SCENARIO Maturity Type : Limit Maturity Maturity Date : 2045-04-29 Maturity Price : 23.08 Evaluated at bid price : 24.80 Bid-YTW : 3.60 % |
| CM.PR.P | FixedReset | 80,600 | RBC crossed 50,000 at 24.00; TD crossed 12,000 at the same price. YTW SCENARIO Maturity Type : Limit Maturity Maturity Date : 2045-04-29 Maturity Price : 22.79 Evaluated at bid price : 24.00 Bid-YTW : 3.32 % |
| ENB.PR.B | FixedReset | 74,764 | RBC bought 34,600 from Desjardins at 19.60. YTW SCENARIO Maturity Type : Limit Maturity Maturity Date : 2045-04-29 Maturity Price : 19.60 Evaluated at bid price : 19.60 Bid-YTW : 4.35 % |
| There were 41 other index-included issues trading in excess of 10,000 shares. | |||
| Wide Spread Highlights | ||
| Issue | Index | Quote Data and Yield Notes |
| FTS.PR.K | FixedReset | Quote: 21.60 – 21.99 Spot Rate : 0.3900 Average : 0.2868 YTW SCENARIO |
| ENB.PR.B | FixedReset | Quote: 19.60 – 19.84 Spot Rate : 0.2400 Average : 0.1496 YTW SCENARIO |
| BAM.PR.K | Floater | Quote: 14.57 – 14.88 Spot Rate : 0.3100 Average : 0.2279 YTW SCENARIO |
| GWO.PR.Q | Deemed-Retractible | Quote: 25.50 – 25.75 Spot Rate : 0.2500 Average : 0.1706 YTW SCENARIO |
| IAG.PR.G | FixedReset | Quote: 25.00 – 25.35 Spot Rate : 0.3500 Average : 0.2722 YTW SCENARIO |
| RY.PR.I | FixedReset | Quote: 25.29 – 25.50 Spot Rate : 0.2100 Average : 0.1334 YTW SCENARIO |