Shareholder activism is rearing its head:
Bond investors face growing risk as activist shareholders are targeting more companies in 2015 than last year, threatening further damage to corporate credit quality, according to Moody’s Investors Service.
…
Investors have sought change at 54 companies including General Motors Co. and MGM Resorts International this year, up from 43 during the same period in 2014, Moody’s said. The record 222 companies targeted last year was up from 220 in 2013. Assets managed by activist hedge funds increased to about $120 billion in 2014 from about $105 billion in 2013, according to Hedge Fund Research data cited by Moody’s.They’re lured by the “huge cash pile” at U.S. non-financial companies, which had $1.65 trillion on their balance sheets in October 2014, according to the report. Technology companies, which as of October carried more than half of the cash held by the largest non-financial U.S. companies, accounted for 20 percent of shareholder activism last year. Along with its cash, the sector’s minimal dividends and low debt levels will continue to draw attention from these investors, Moody’s said.
The bureaucrats at the IMF have recommended hiring more bureaucrats:
Bond funds may be exposing customers and the financial system to more risk than some investors realize as money managers seek higher returns in less liquid assets, the International Monetary Fund said in a report recommending improved oversight.
“The role of fixed-income funds, which entail larger contagion risks than traditional equity investment, has expanded considerably,” the IMF said Wednesday in a chapter on asset managers in its latest Global Financial Stability Report.
…
While the U.S. mutual fund industry’s regulation regime is based primarily on disclosure, the IMF proposed enhancing “liquidity rules, the definition of liquid assets, investment restrictions, and reporting and disclosure rules.” Not enough is known about the use of leverage and derivatives, said Gaston Gelos, chief of the IMF division that worked on the chapter.
…
While asset managers act as a “spare tire” in world’s financial system, providing financing even when banks are distressed, the industry raises risks that call for changes in regulated and oversight, the IMF said.“Easy redemption options can create risks of runs because of the presence of a first-mover advantage,” the IMF said. “The destabilization of prices in certain asset segments (particularly bonds) can affect other parts of the financial system through funding markets and balance sheet and collateral channels.”
I have tried several times to download the report, but it appears that all their technology budget got spent on junkets; the download hangs pretty quickly. It might work in a couple of days.
Meanwhile it appears that yes, next time might be different:
The gap between how easy it is to trade mutual-fund shares and how hard it is to buy and sell assets such as high-yield bonds and leveraged loans is widening.
In 2015 alone, a year in which the Federal Reserve says it’s still planning to raise interest rates, investors have poured $46 billion into mutual funds and exchange-traded funds focused on corporate bonds, according to data compiled by Wells Fargo & Co.
They now own about 22 percent of outstanding high-yield bonds, up from about 12 percent in 2006, data compiled by JPMorgan Chase & Co. show.
While the size of the U.S. bond market has swelled 23 percent since the end of 2007 through the end of last year, trading has fallen 28 percent in the period, according to data compiled by the Securities Industry & Financial Markets Association.
Warnings about potential scarcity of liquidity when it’s at a premium have moved from academic circles and crackpot blogs to the mainstream:
JPMorgan Chase & Co. head Jamie Dimon said last year’s volatility in U.S. Treasuries is a “warning shot” to investors and that the next financial crisis could be exacerbated by a shortage of the securities.
The Oct. 15 gyration, when Treasury yields fluctuated by almost 0.4 percentage point, was an “unprecedented move” that would have serious consequences in a stressed environment, Dimon, the New York-based bank’s chairman and chief executive officer, said in a letter Wednesday to shareholders. Treasuries are supposed to be among the most stable securities.
Dimon, 59, cited the incident as he waded into a debate about whether bank regulations implemented after the 2008 financial crisis exacerbate price declines by limiting the ability of Wall Street banks to make markets. It’s just a matter of time until some political, economic or market event triggers another financial crisis, he said, without predicting one is imminent.
Hat tip to Assiduous Reader JP for bringing the above to my attention. JP sends me many interesting links, unlike you other bums.
Power Financial sees an opportunity in the robo-advisor business:
Power Financial Corp., which has built an empire around financial planning and investment advice, is now plugging into the world of robots by investing up to $30-million in Wealthsimple Financial Inc.
The partnership of the robo-adviser firm and a major financial institution is the first of its kind in Canada. It will help Power Financial to target more millennials and other Canadians who are less likely to invest through traditional channels, and instead opt for low-cost robo-advisers that provide automated online portfolio management. Under the agreement, pending regulatory approval, Power Financial will initially invest $10-million into Wealthsimple, with an option to put in another $20-million over the next 12 months. Power Financial could potentially make further investments over the next three years under the deal.
It was a mixed day for the Canadian preferred share market, with PerpetualDiscounts off 12bp FixedResets down 15bp and DeemedRetractibles gaining 2bp. The Performance Highlights table continues to reflect a lot of churn in the market. Volume was slightly above average.
For as long as the FixedReset market is so violently unsettled, I’ll keep publishing updates of the more interesting and meaningful series of FixedResets’ Implied Volatilities. This doesn’t include Enbridge because although Enbridge has a large number of issues outstanding, all of which are quite liquid, the range of Issue Reset Spreads is too small for decent conclusions. The low is 212bp (ENB.PR.H; second-lowest is ENB.PR.D at 237bp) and the high is a mere 268 for ENB.PF.G.
Remember that all rich /cheap assessments are:
» based on Implied Volatility Theory only
» are relative only to other FixedResets from the same issuer
» assume constant GOC-5 yield
» assume constant Implied Volatility
» assume constant spread
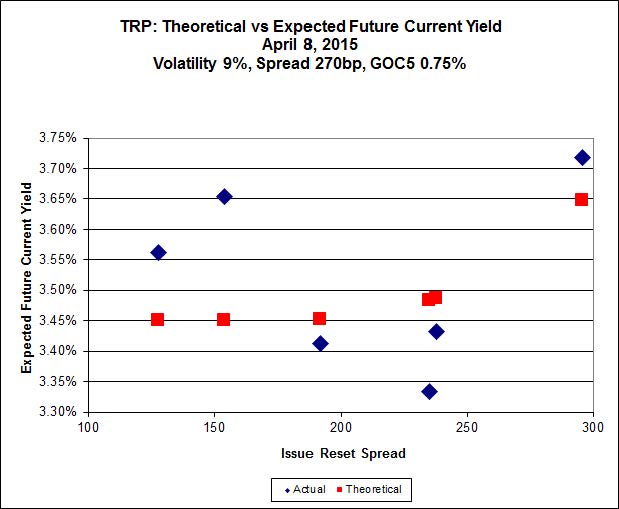
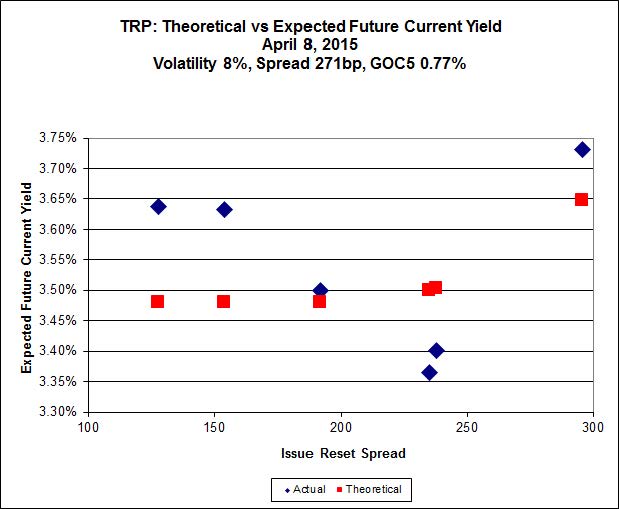
Here’s TRP:
Click for Big
TRP.PR.E, which resets 2019-10-30 at +235, is bid at 23.18 to be $0.89 rich, while TRP.PR.C, resetting 2016-01-30 at +154, is $0.69 cheap at its bid price of 15.90.

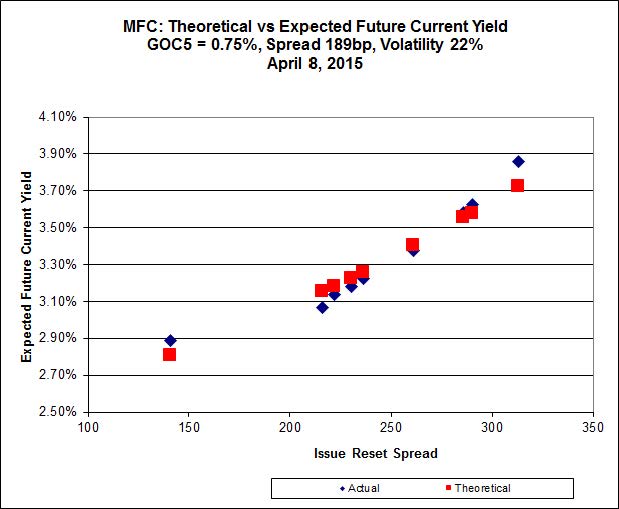
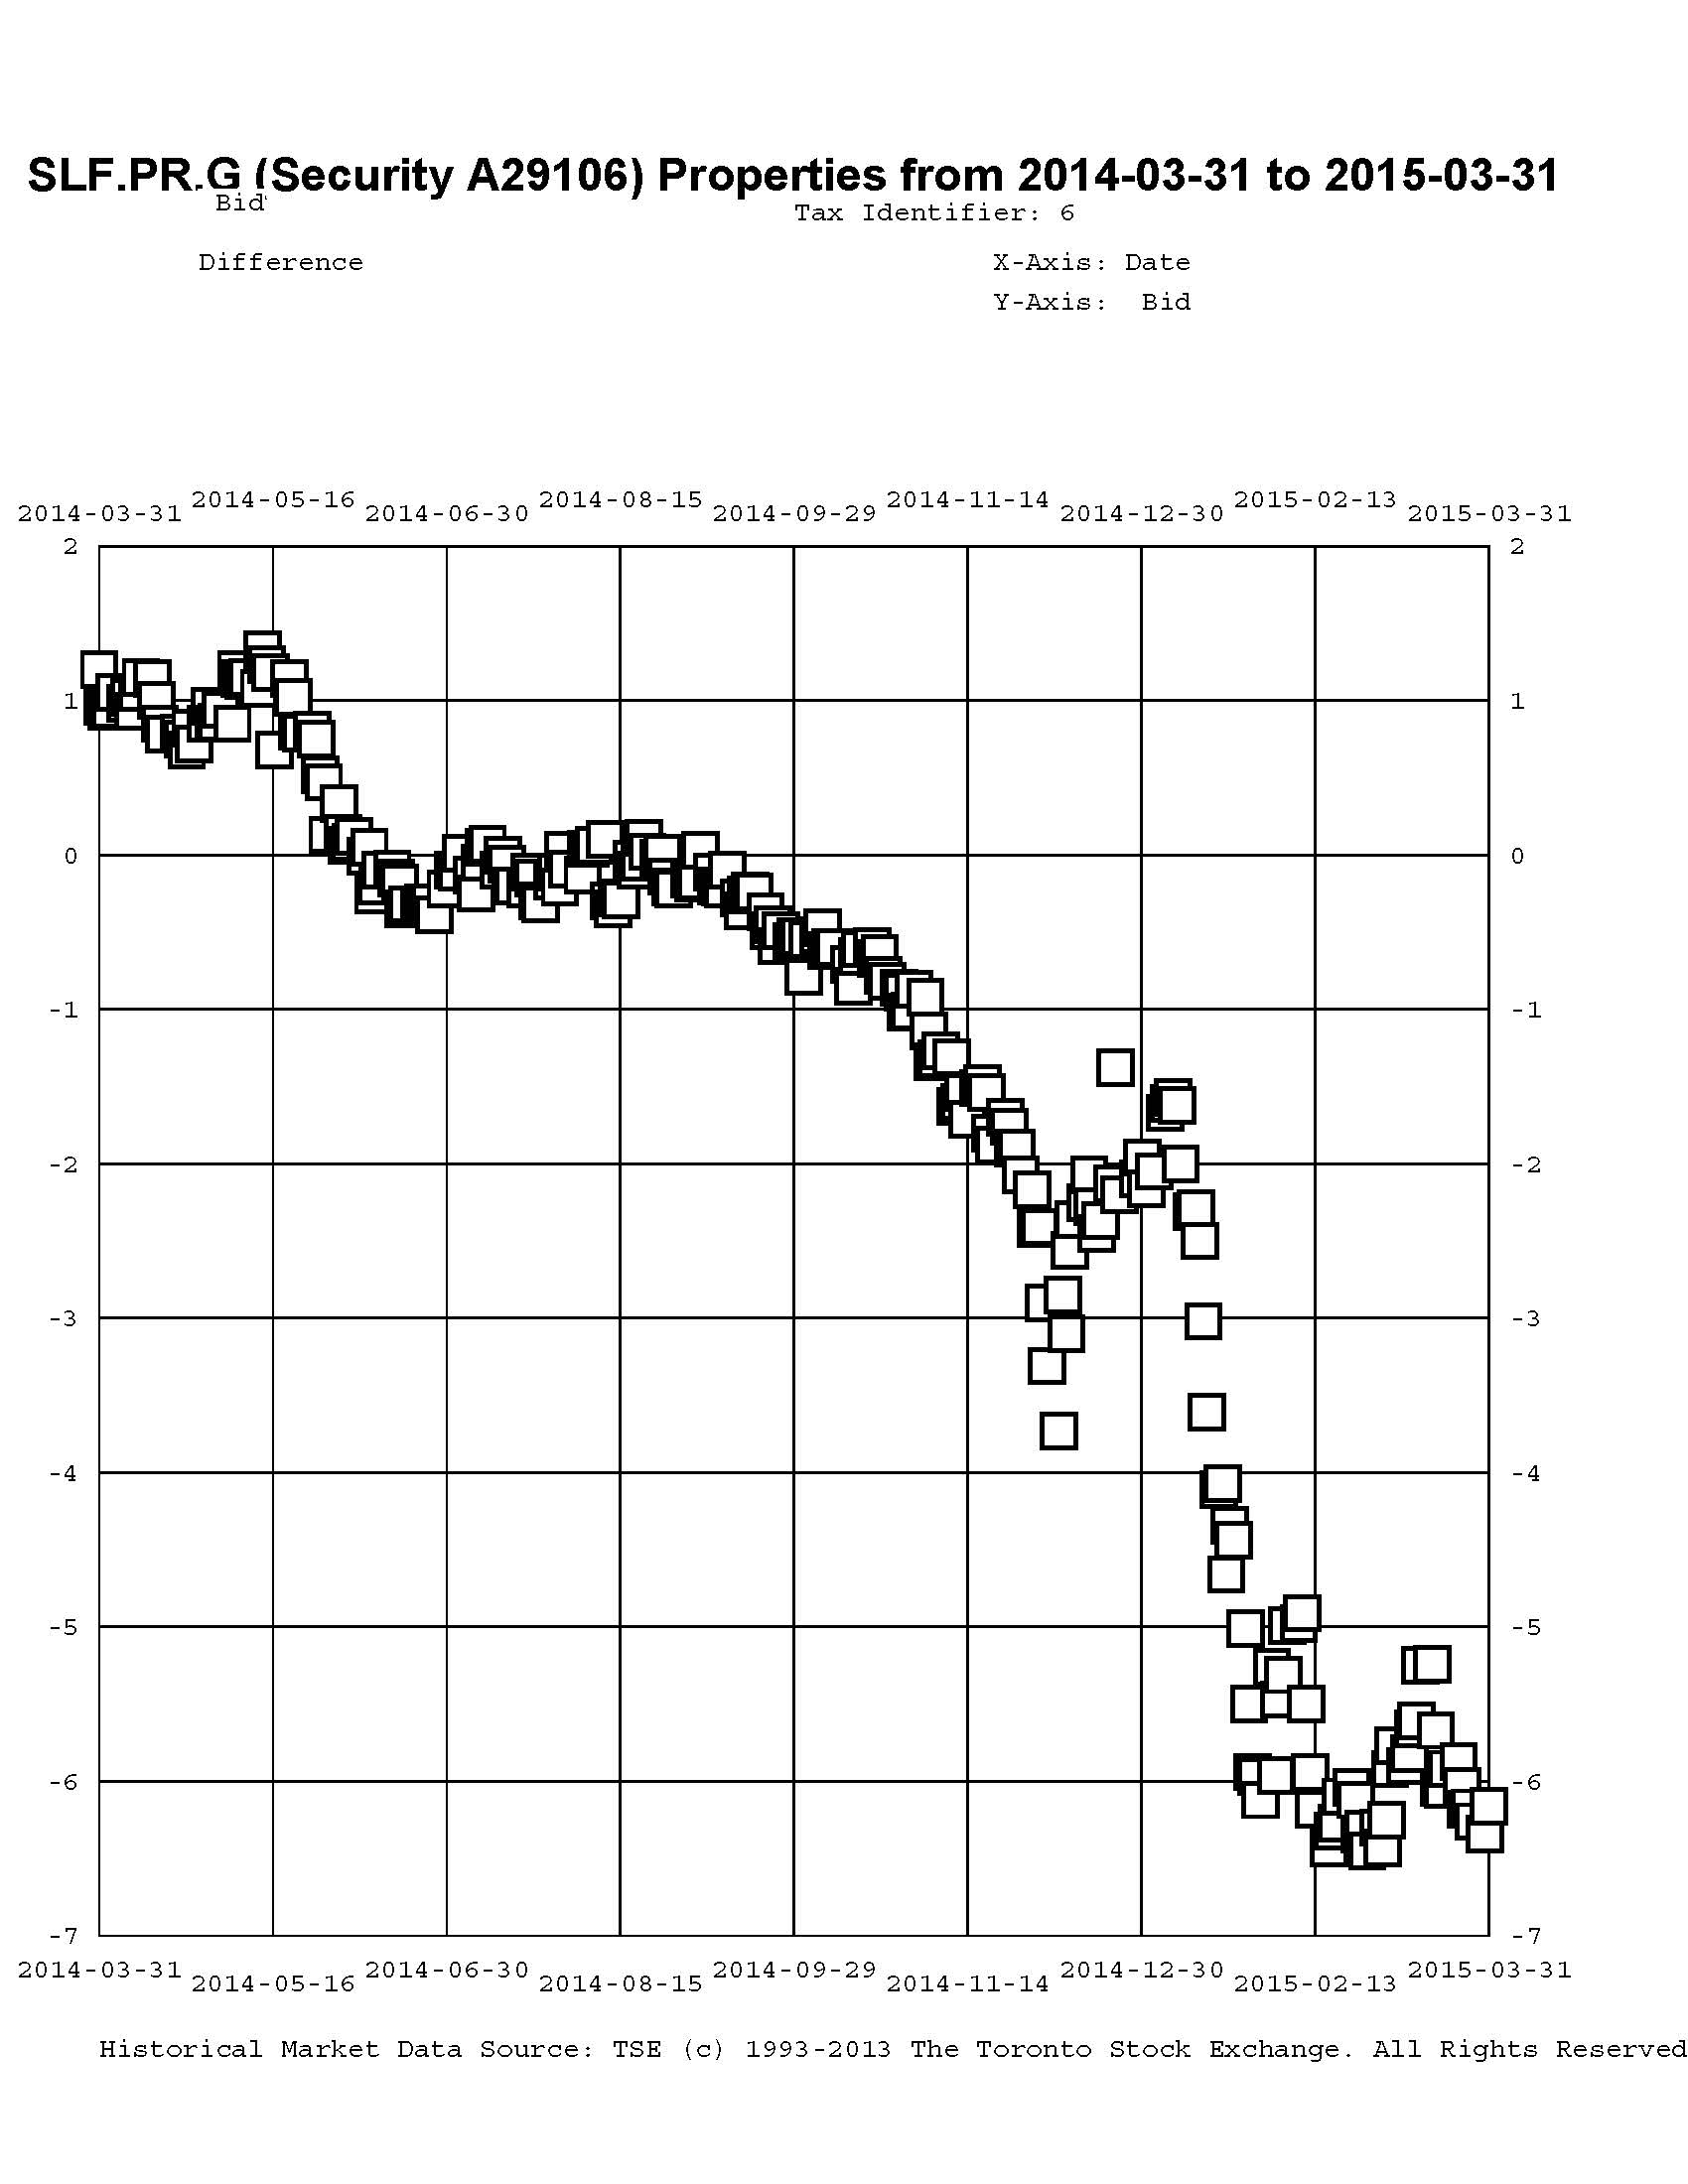
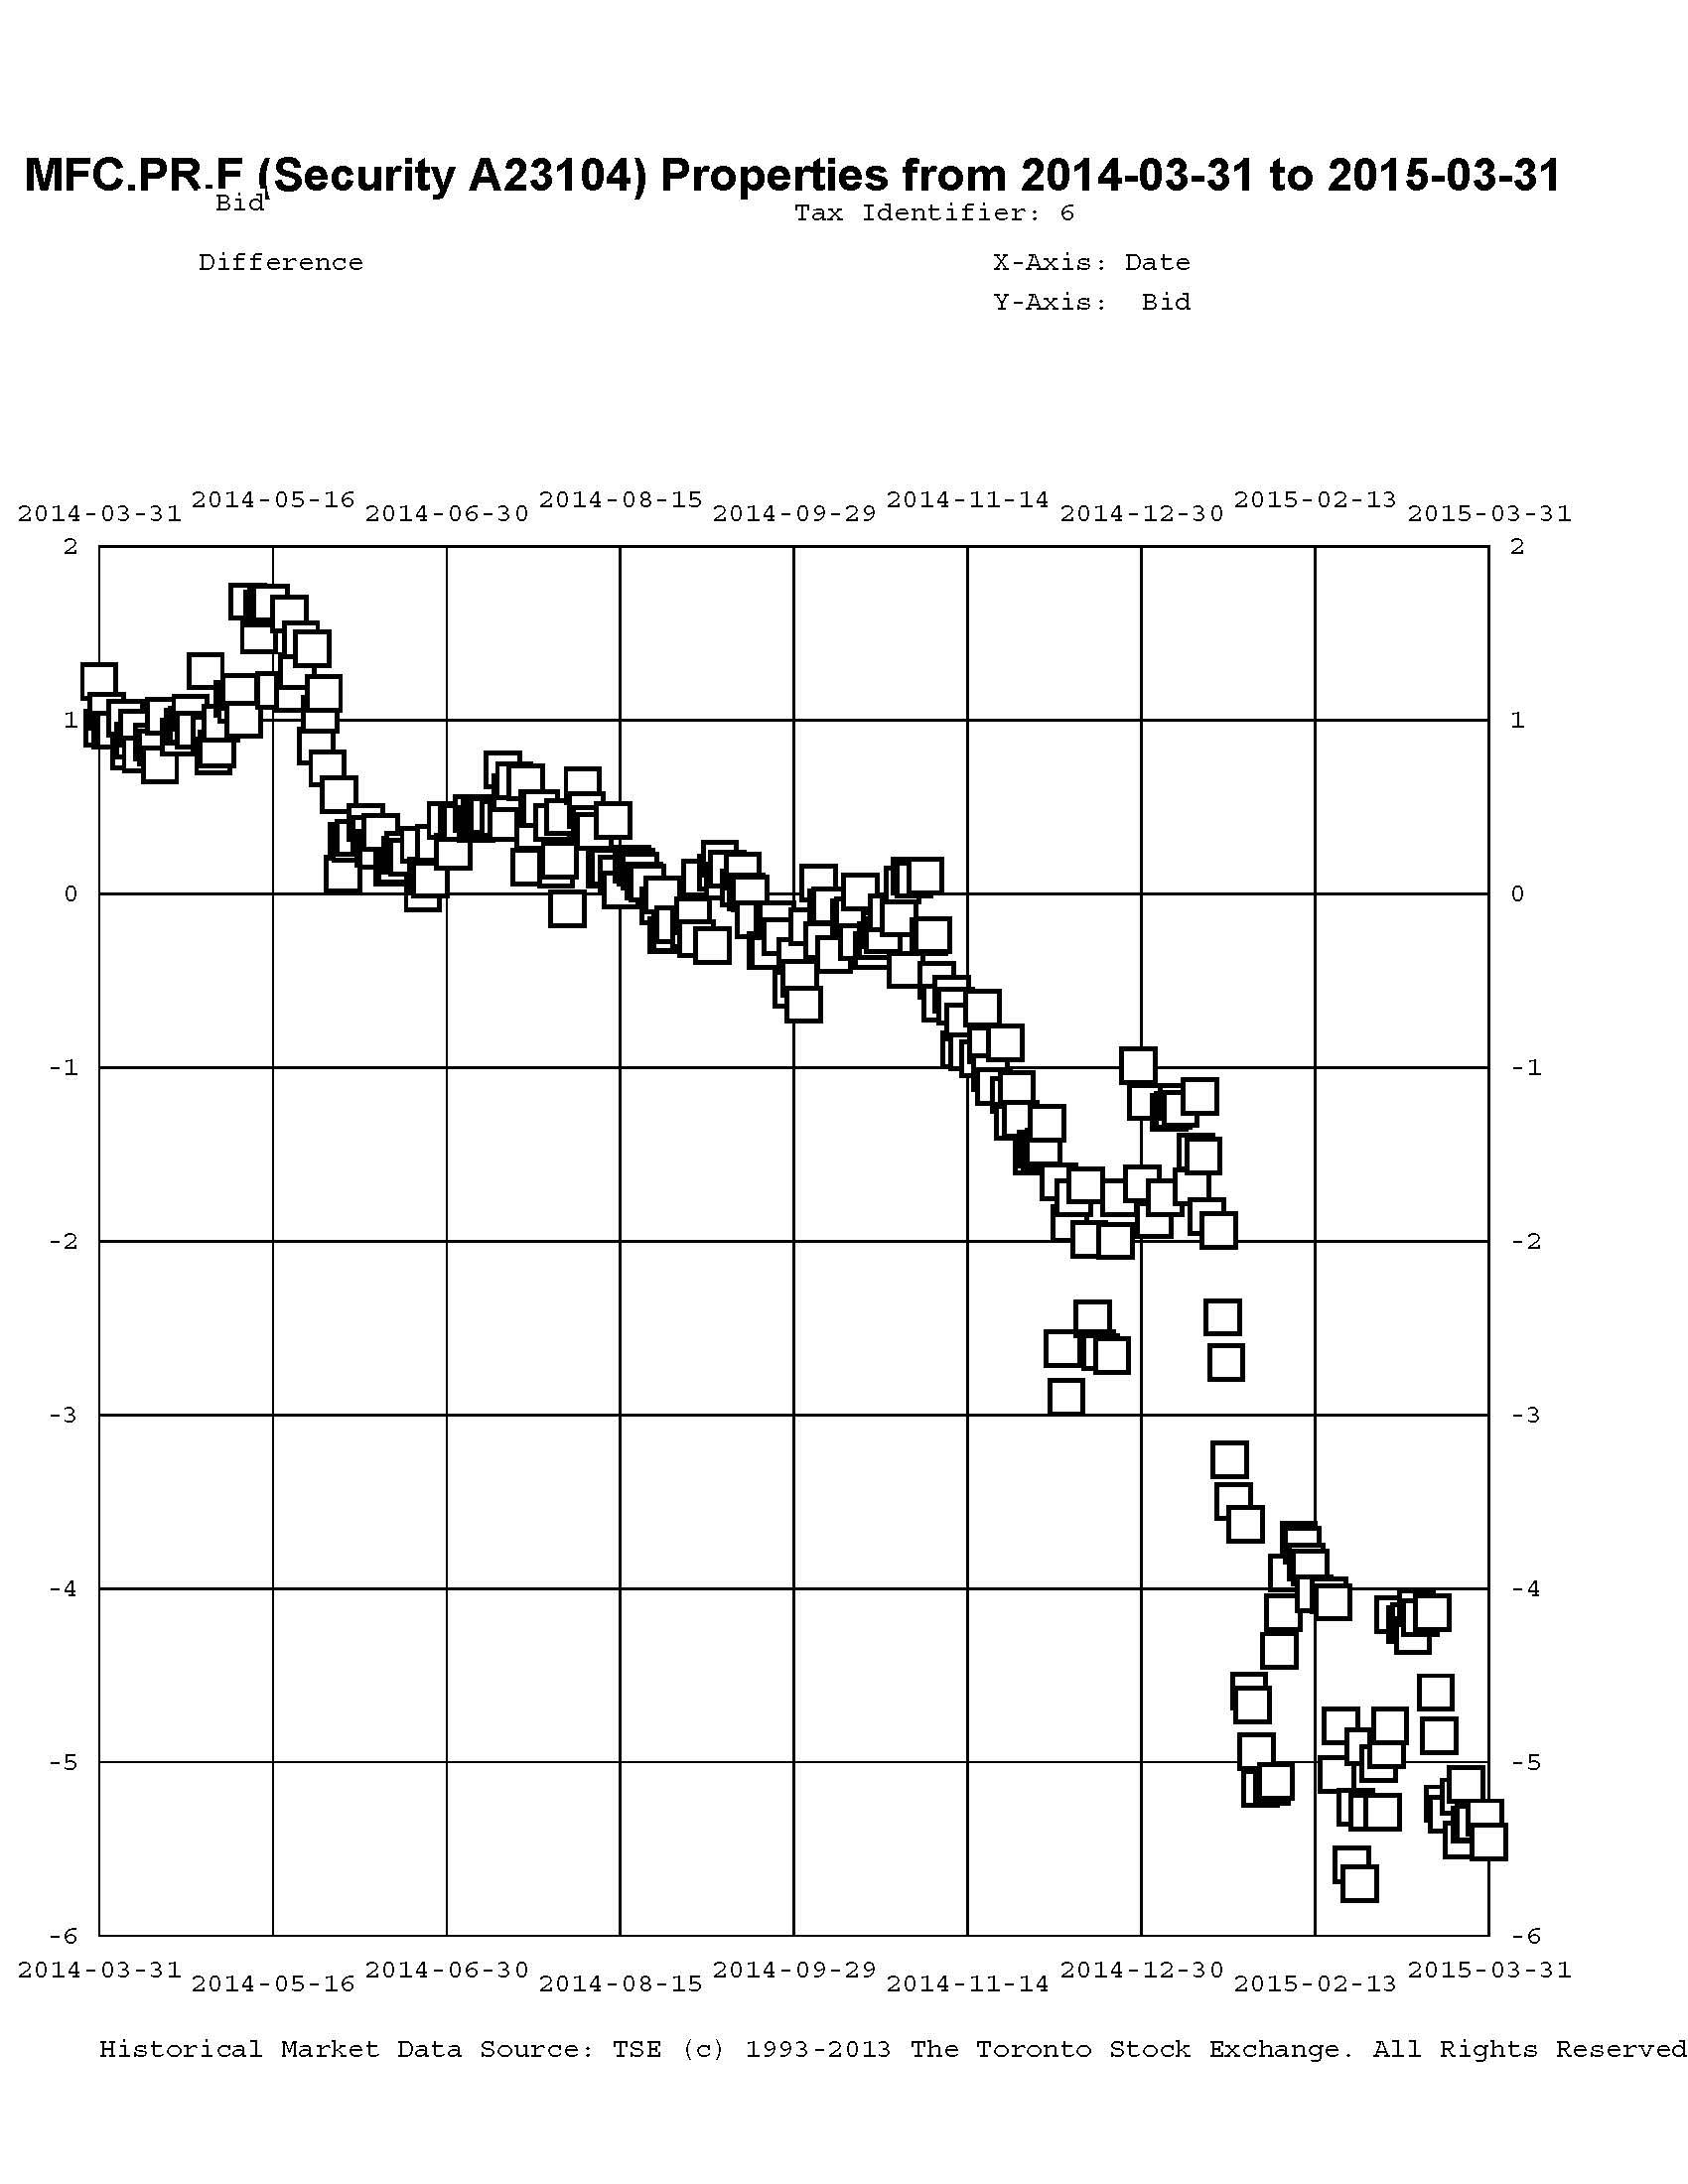
Another excellent fit, but the numbers are perplexing. Implied Volatility for MFC continues to be a conundrum, although it declined substantially today. It is still too high if we consider that NVCC rules will never apply to these issues; it is still too low if we consider them to be NVCC non-compliant issues (and therefore with Deemed Maturities in the call schedule).
Most expensive is MFC.PR.M, resetting at +236 on 2019-12-19, bid at 24.25 to be $0.49 rich, while MFC.PR.H, resetting at +313bp on 2017-3-19, is bid at 25.20 to be $0.93 cheap.
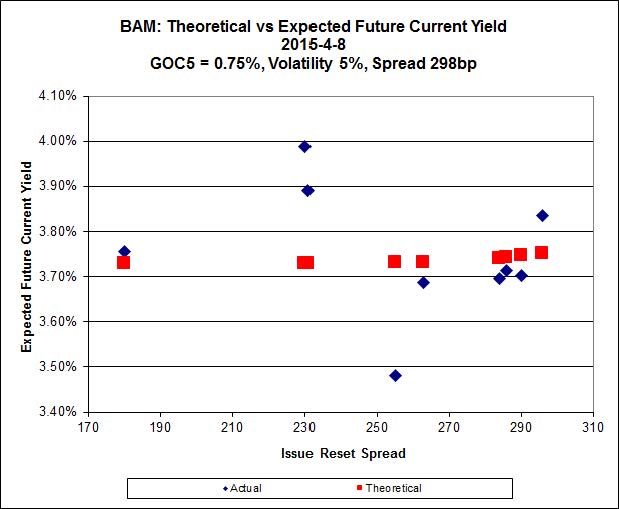
Click for Big
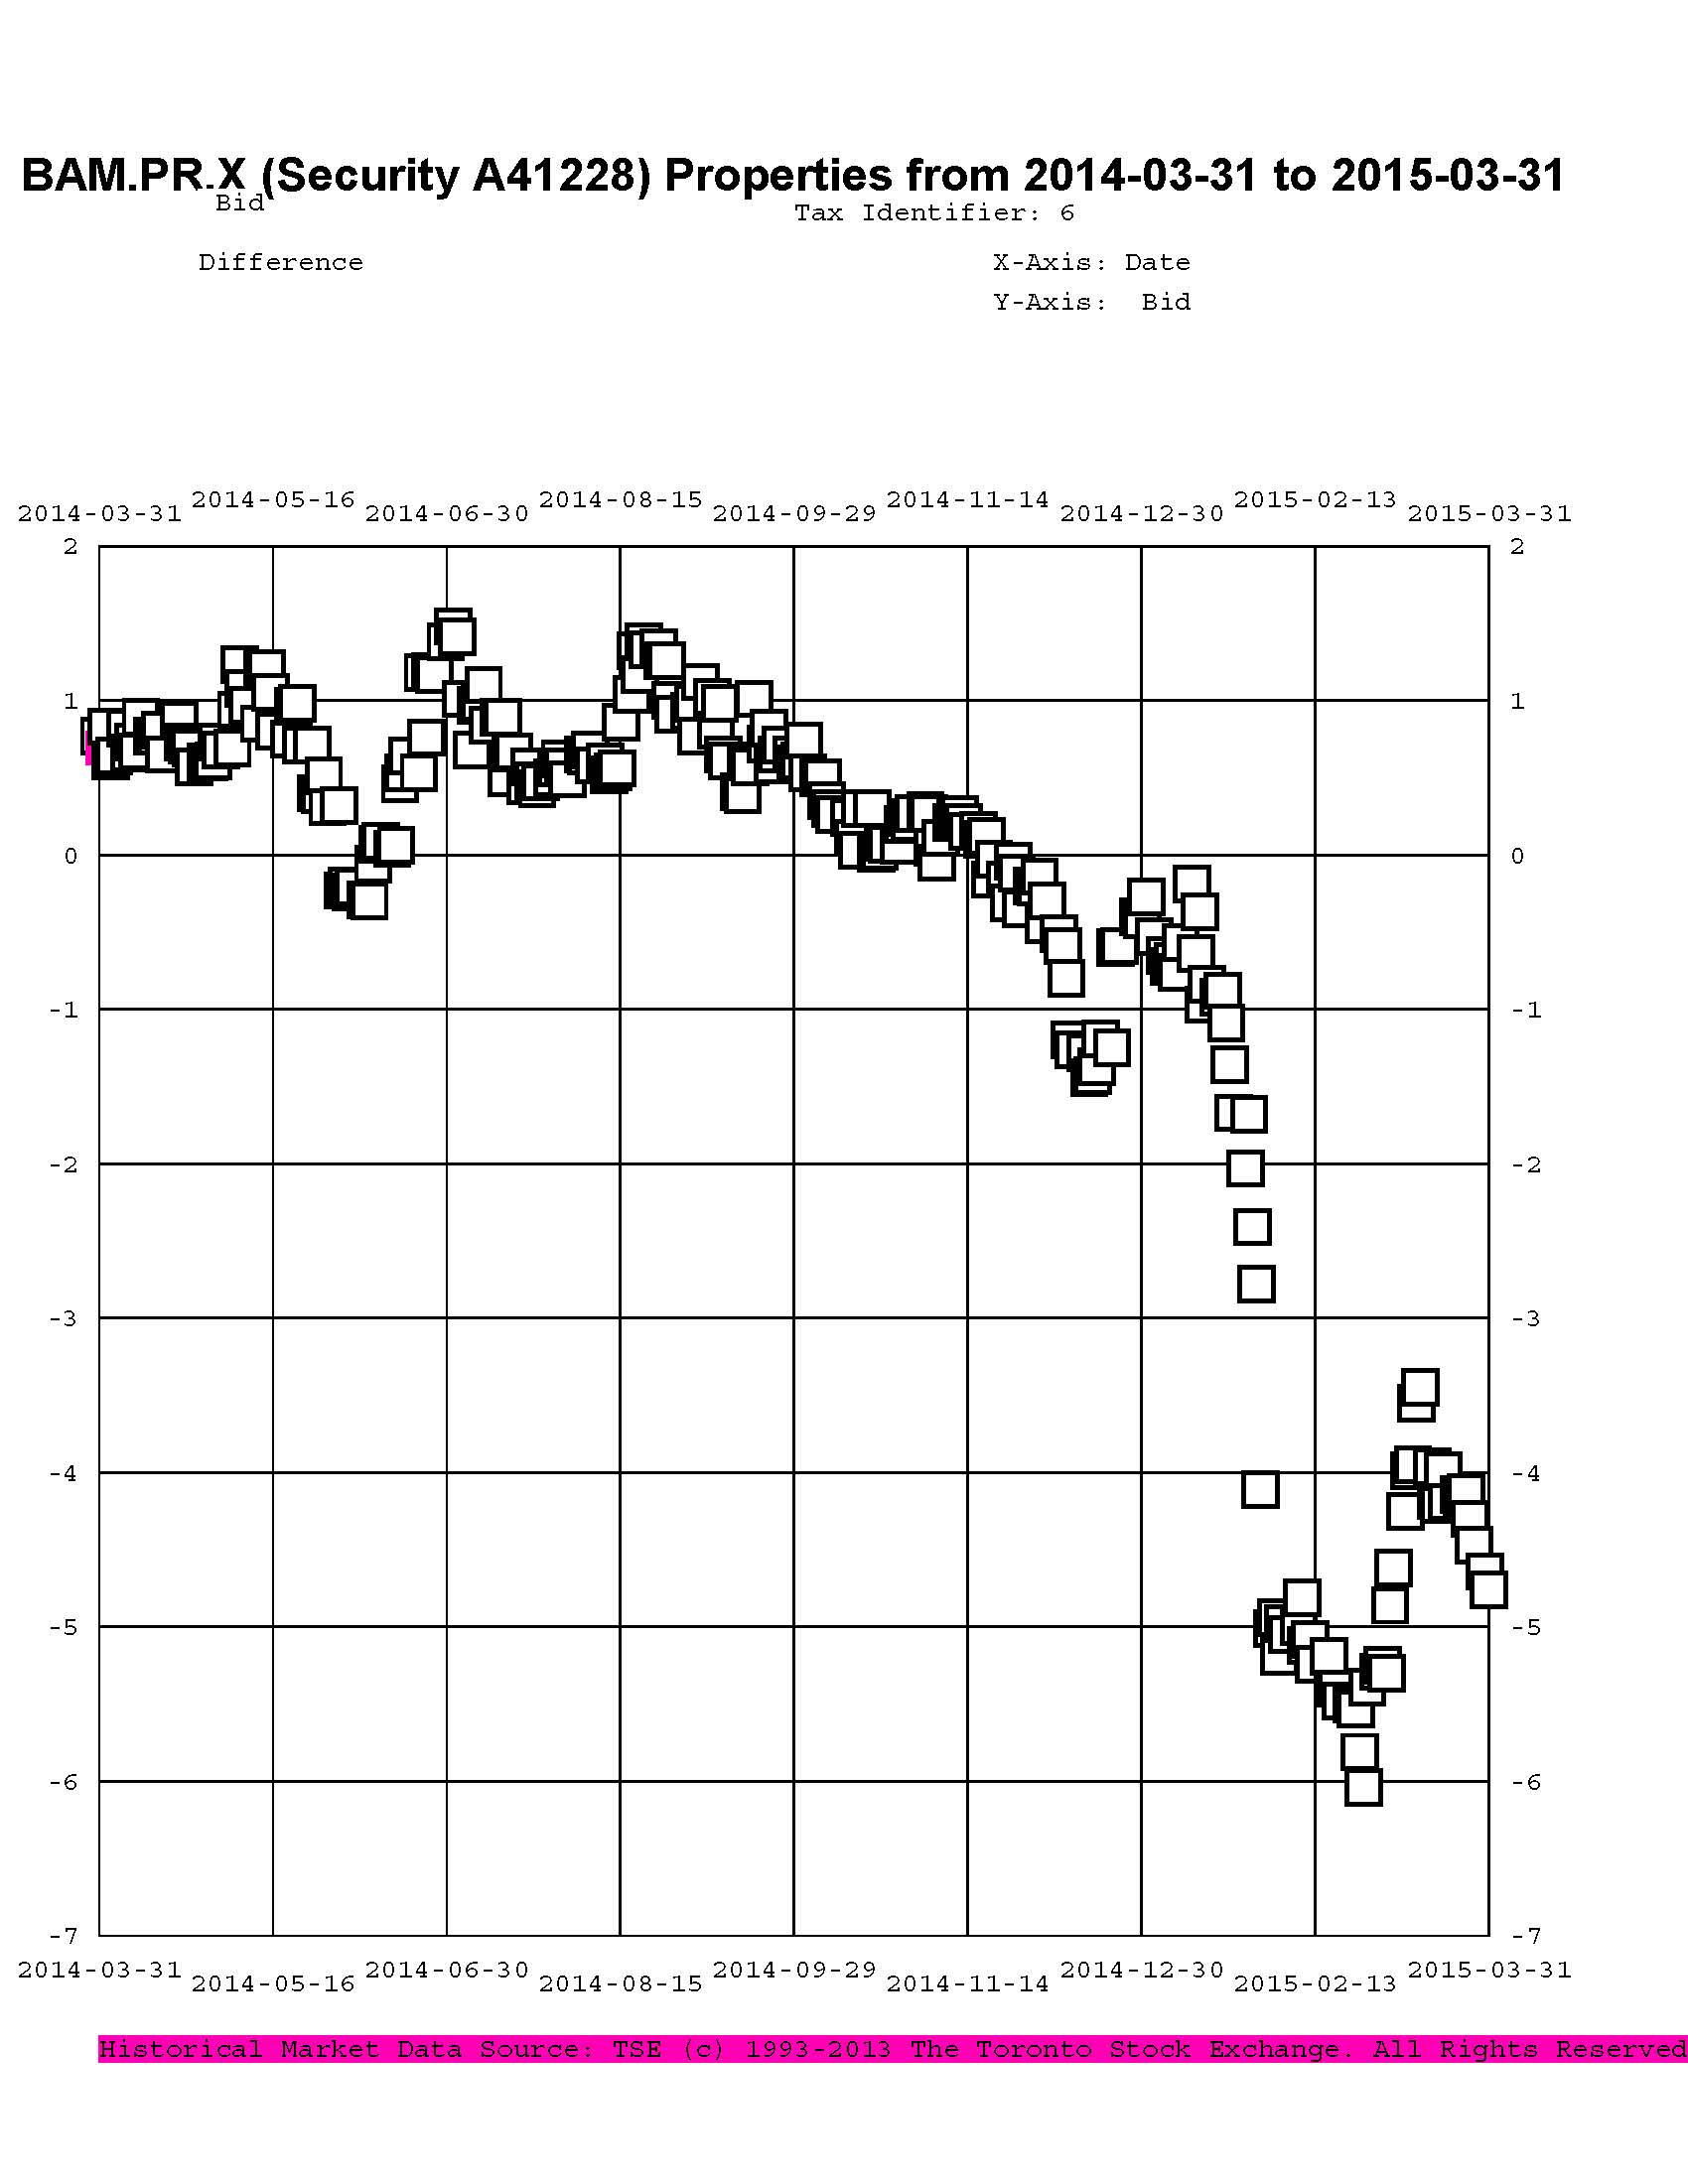
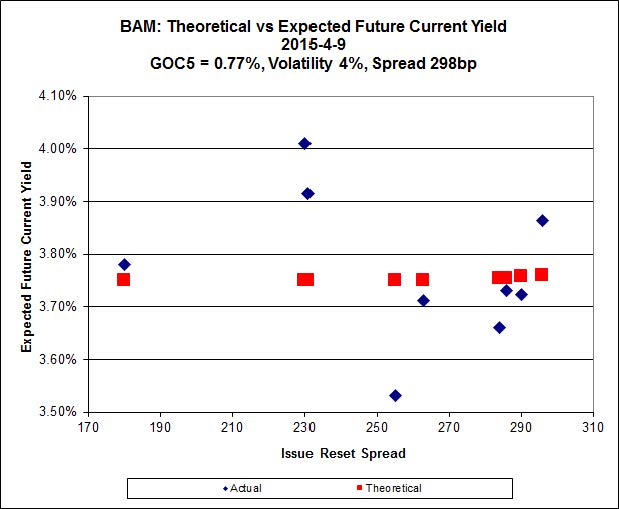
The cheapest issue relative to its peers is BAM.PR.R, resetting at +230bp on 2016-6-30, bid at 19.14 to be $1.32 cheap. BAM.PF.E, resetting at +255bp 2020-3-31 is bid at 23.51 and appears to be $1.38 rich.
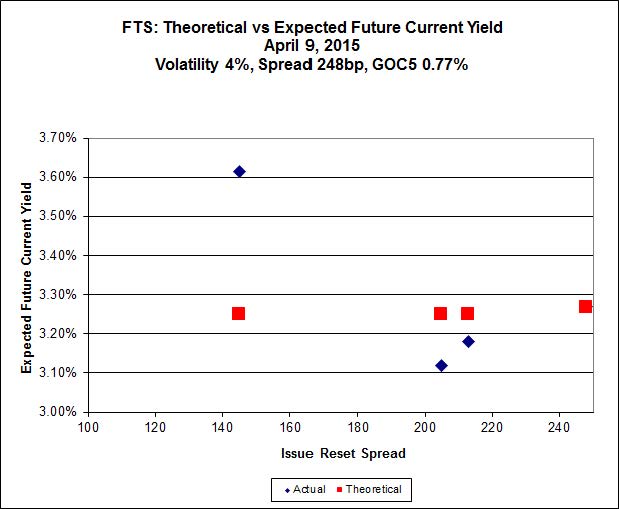
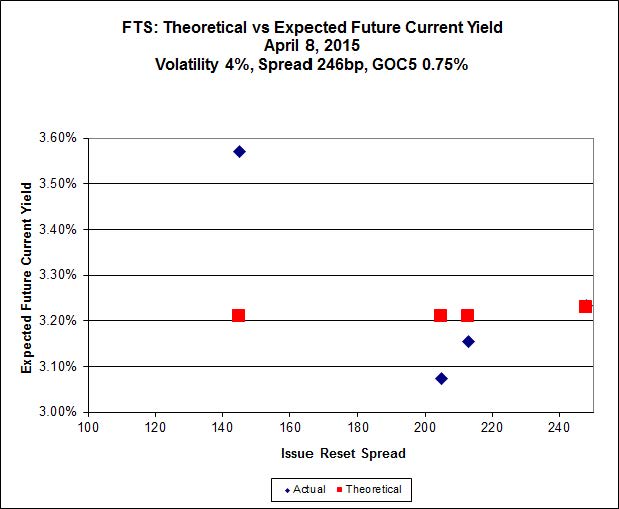
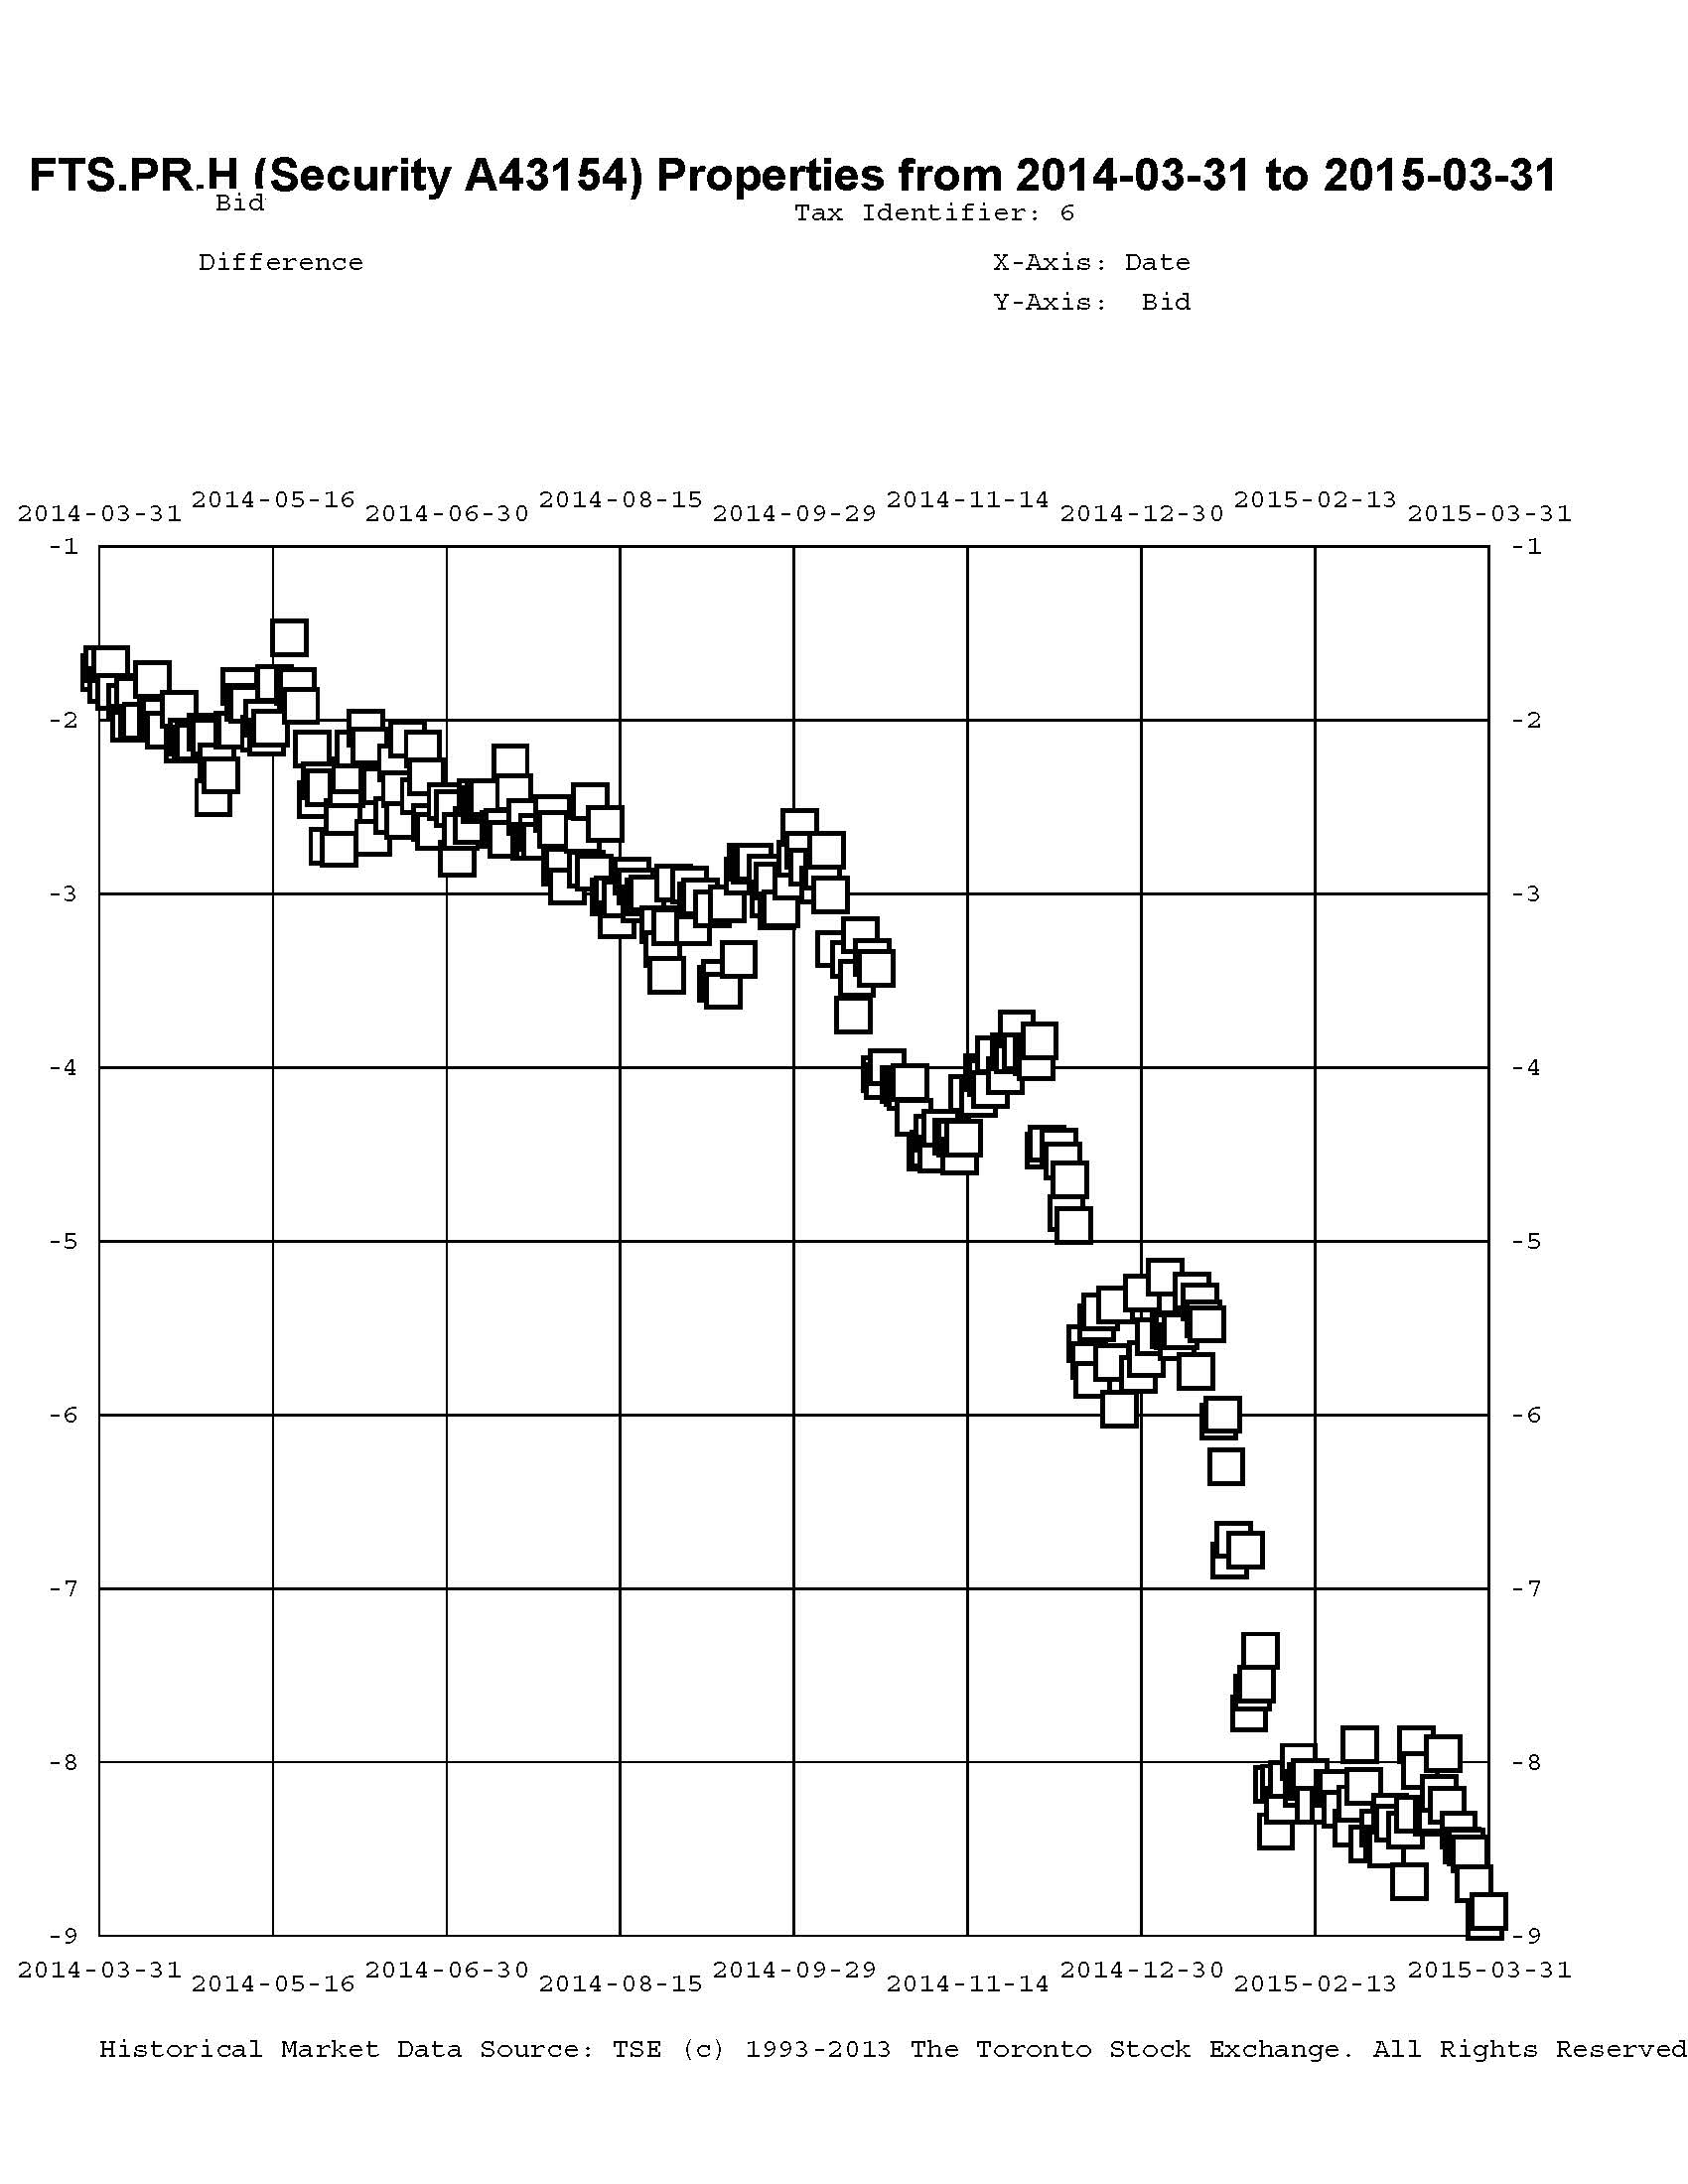
This is just weird because the middle is expensive and the ends are cheap but anyway … FTS.PR.H, with a spread of +145bp, and bid at 15.35, looks $1.73 cheap and resets 2015-6-1. FTS.PR.K, with a spread of +205bp and resetting 2019-3-1, is bid at 23.60 and is $0.91 rich.
Click for Big
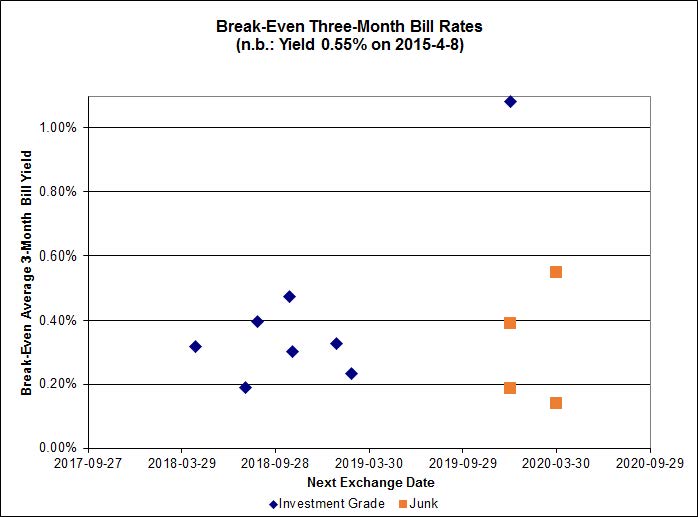
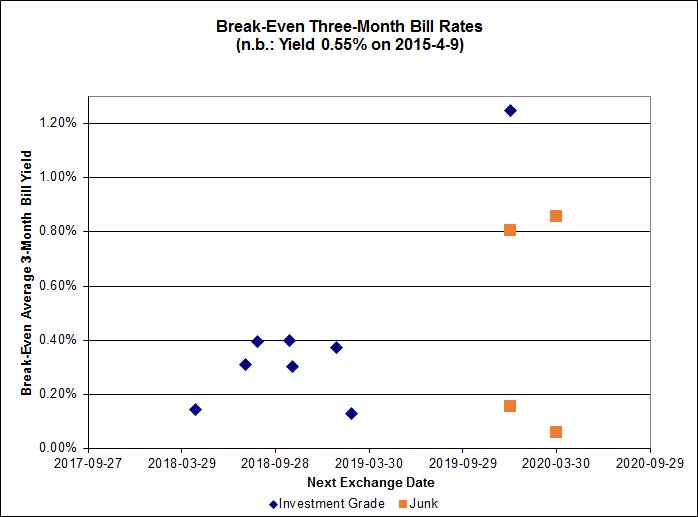
Investment-grade pairs other than TRP.PR.A / TRP.PR.F now predict an average over the next five years of about 0.30%, a slight decrease from yesterday’s value of 0.35%. TRP.PR.A / TRP.PR.F remains an outlier, predicting 1.24%. The DC.PR.B / DC.PR.D pair is still off the charts and now predicts an average bill rate over the next 4 3/4 years of -1.66%.

Click for Big
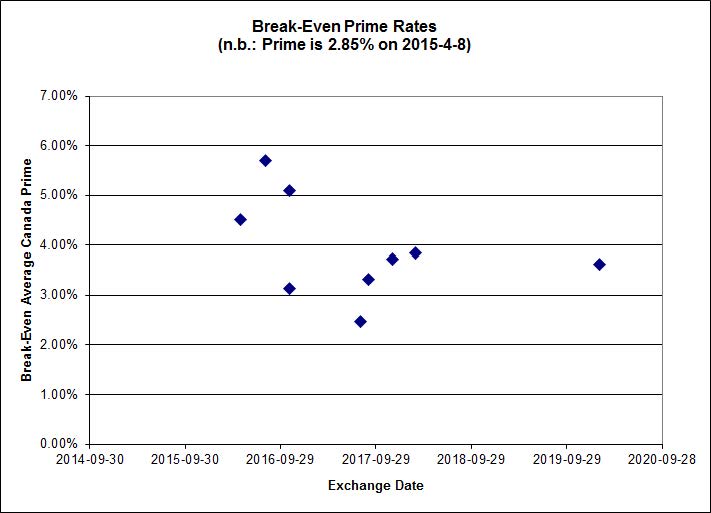
Shall we just say that this exhibits a high level of confidence in the continued rapacity of Canadian banks?
| HIMIPref™ Preferred Indices These values reflect the December 2008 revision of the HIMIPref™ Indices Values are provisional and are finalized monthly |
|||||||
| Index | Mean Current Yield (at bid) |
Median YTW |
Median Average Trading Value |
Median Mod Dur (YTW) |
Issues | Day’s Perf. | Index Value |
| Ratchet | 0.00 % | 0.00 % | 0 | 0.00 | 0 | 1.8934 % | 2,227.8 |
| FixedFloater | 0.00 % | 0.00 % | 0 | 0.00 | 0 | 1.8934 % | 3,895.2 |
| Floater | 3.25 % | 3.40 % | 59,628 | 18.79 | 4 | 1.8934 % | 2,368.3 |
| OpRet | 4.43 % | -1.11 % | 33,191 | 0.15 | 2 | -0.2162 % | 2,759.9 |
| SplitShare | 4.57 % | 4.76 % | 58,710 | 3.44 | 3 | 0.0534 % | 3,225.9 |
| Interest-Bearing | 0.00 % | 0.00 % | 0 | 0.00 | 0 | -0.2162 % | 2,523.6 |
| Perpetual-Premium | 5.31 % | 2.07 % | 63,078 | 0.09 | 25 | 0.0853 % | 2,525.7 |
| Perpetual-Discount | 5.09 % | 5.02 % | 143,120 | 15.08 | 9 | -0.1171 % | 2,805.1 |
| FixedReset | 4.51 % | 3.67 % | 269,244 | 16.46 | 85 | -0.1494 % | 2,367.8 |
| Deemed-Retractible | 4.91 % | 2.27 % | 107,992 | 0.14 | 37 | 0.0219 % | 2,658.1 |
| FloatingReset | 2.48 % | 2.89 % | 77,091 | 6.28 | 8 | -0.1330 % | 2,353.9 |
| Performance Highlights | |||
| Issue | Index | Change | Notes |
| BNS.PR.Y | FixedReset | -2.43 % | YTW SCENARIO Maturity Type : Hard Maturity Maturity Date : 2022-01-31 Maturity Price : 25.00 Evaluated at bid price : 21.66 Bid-YTW : 4.00 % |
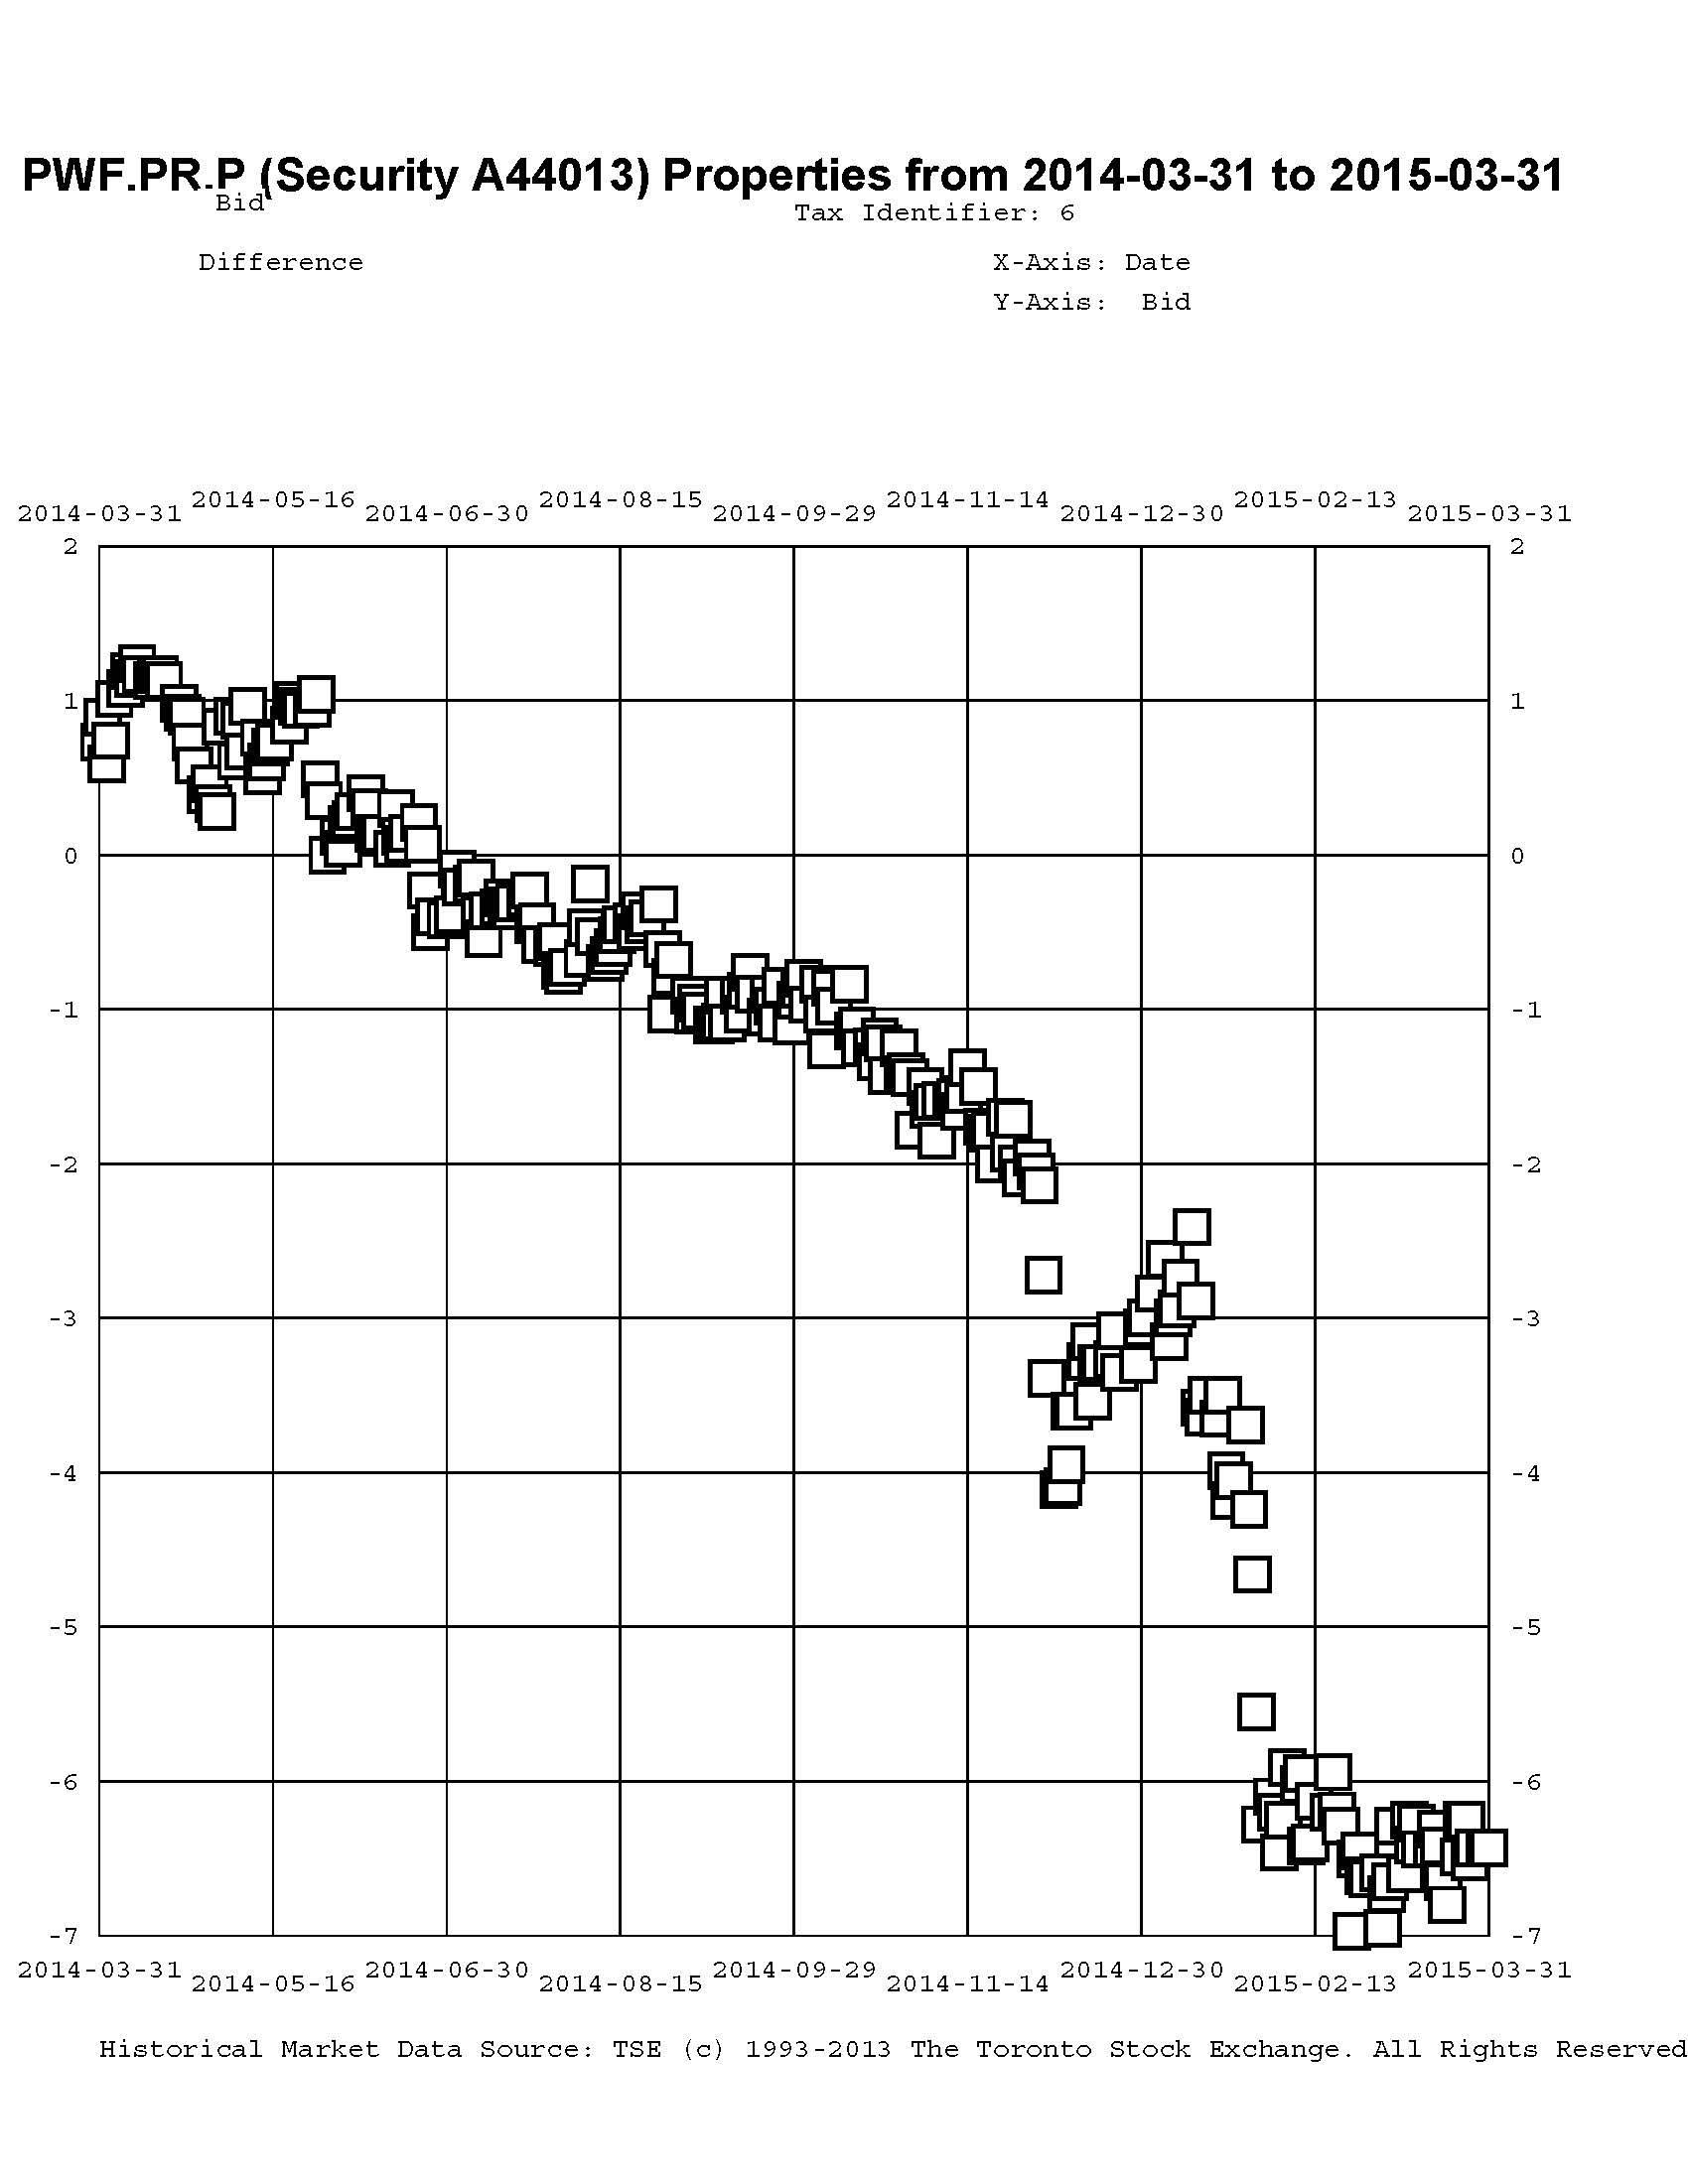
| PWF.PR.P | FixedReset | -2.17 % | YTW SCENARIO Maturity Type : Limit Maturity Maturity Date : 2045-04-09 Maturity Price : 17.61 Evaluated at bid price : 17.61 Bid-YTW : 3.47 % |
| MFC.PR.L | FixedReset | -2.11 % | YTW SCENARIO Maturity Type : Hard Maturity Maturity Date : 2025-01-31 Maturity Price : 25.00 Evaluated at bid price : 23.22 Bid-YTW : 4.31 % |
| SLF.PR.H | FixedReset | -1.97 % | YTW SCENARIO Maturity Type : Hard Maturity Maturity Date : 2025-01-31 Maturity Price : 25.00 Evaluated at bid price : 21.44 Bid-YTW : 4.95 % |
| MFC.PR.F | FixedReset | -1.87 % | YTW SCENARIO Maturity Type : Hard Maturity Maturity Date : 2025-01-31 Maturity Price : 25.00 Evaluated at bid price : 18.35 Bid-YTW : 6.13 % |
| TRP.PR.A | FixedReset | -1.74 % | YTW SCENARIO Maturity Type : Limit Maturity Maturity Date : 2045-04-09 Maturity Price : 19.22 Evaluated at bid price : 19.22 Bid-YTW : 3.67 % |
| ENB.PF.A | FixedReset | -1.20 % | YTW SCENARIO Maturity Type : Limit Maturity Maturity Date : 2045-04-09 Maturity Price : 20.50 Evaluated at bid price : 20.50 Bid-YTW : 4.51 % |
| PWF.PR.A | Floater | -1.19 % | YTW SCENARIO Maturity Type : Limit Maturity Maturity Date : 2045-04-09 Maturity Price : 17.50 Evaluated at bid price : 17.50 Bid-YTW : 2.87 % |
| ELF.PR.H | Perpetual-Premium | -1.16 % | YTW SCENARIO Maturity Type : Call Maturity Date : 2020-04-17 Maturity Price : 25.25 Evaluated at bid price : 25.60 Bid-YTW : 5.13 % |
| TRP.PR.B | FixedReset | -1.12 % | YTW SCENARIO Maturity Type : Limit Maturity Maturity Date : 2045-04-09 Maturity Price : 14.09 Evaluated at bid price : 14.09 Bid-YTW : 3.62 % |
| MFC.PR.N | FixedReset | -1.00 % | YTW SCENARIO Maturity Type : Hard Maturity Maturity Date : 2025-01-31 Maturity Price : 25.00 Evaluated at bid price : 23.75 Bid-YTW : 4.12 % |
| ENB.PR.N | FixedReset | 1.02 % | YTW SCENARIO Maturity Type : Limit Maturity Maturity Date : 2045-04-09 Maturity Price : 19.85 Evaluated at bid price : 19.85 Bid-YTW : 4.48 % |
| TRP.PR.C | FixedReset | 1.47 % | YTW SCENARIO Maturity Type : Limit Maturity Maturity Date : 2045-04-09 Maturity Price : 15.90 Evaluated at bid price : 15.90 Bid-YTW : 3.71 % |
| TRP.PR.D | FixedReset | 1.54 % | YTW SCENARIO Maturity Type : Limit Maturity Maturity Date : 2045-04-09 Maturity Price : 22.42 Evaluated at bid price : 23.15 Bid-YTW : 3.51 % |
| BAM.PF.G | FixedReset | 1.57 % | YTW SCENARIO Maturity Type : Limit Maturity Maturity Date : 2045-04-09 Maturity Price : 23.03 Evaluated at bid price : 24.66 Bid-YTW : 3.78 % |
| BAM.PR.K | Floater | 2.41 % | YTW SCENARIO Maturity Type : Limit Maturity Maturity Date : 2045-04-09 Maturity Price : 14.45 Evaluated at bid price : 14.45 Bid-YTW : 3.47 % |
| BAM.PR.C | Floater | 2.45 % | YTW SCENARIO Maturity Type : Limit Maturity Maturity Date : 2045-04-09 Maturity Price : 14.64 Evaluated at bid price : 14.64 Bid-YTW : 3.42 % |
| BAM.PR.B | Floater | 4.68 % | YTW SCENARIO Maturity Type : Limit Maturity Maturity Date : 2045-04-09 Maturity Price : 14.76 Evaluated at bid price : 14.76 Bid-YTW : 3.40 % |
| Volume Highlights | |||
| Issue | Index | Shares Traded |
Notes |
| FTS.PR.M | FixedReset | 202,150 | RBC crossed 30,000 at 25.00 and 49,300 at 25.05. TD crossed 100,000 at 25.00. YTW SCENARIO Maturity Type : Limit Maturity Maturity Date : 2045-04-09 Maturity Price : 23.14 Evaluated at bid price : 24.86 Bid-YTW : 3.34 % |
| RY.PR.H | FixedReset | 111,330 | TD crossed 35,000 at 24.78; RBC crossed 50,000 at 24.78. YTW SCENARIO Maturity Type : Limit Maturity Maturity Date : 2045-04-09 Maturity Price : 23.12 Evaluated at bid price : 24.75 Bid-YTW : 3.12 % |
| BNS.PR.Y | FixedReset | 80,055 | Will reset at 1.82% effective April 26. YTW SCENARIO Maturity Type : Hard Maturity Maturity Date : 2022-01-31 Maturity Price : 25.00 Evaluated at bid price : 21.66 Bid-YTW : 4.00 % |
| CU.PR.C | FixedReset | 68,244 | TD crossed 40,500 at 24.90. YTW SCENARIO Maturity Type : Limit Maturity Maturity Date : 2045-04-09 Maturity Price : 23.48 Evaluated at bid price : 24.81 Bid-YTW : 3.18 % |
| TD.PF.B | FixedReset | 60,228 | TD crossed 25,000 at 24.50; Nesbitt crossed 25,000 at the same price. YTW SCENARIO Maturity Type : Limit Maturity Maturity Date : 2045-04-09 Maturity Price : 23.04 Evaluated at bid price : 24.50 Bid-YTW : 3.13 % |
| NA.PR.S | FixedReset | 59,632 | Nesbitt crossed blocks of 28,500 and 25,000, both at 24.80; YTW SCENARIO Maturity Type : Limit Maturity Maturity Date : 2045-04-09 Maturity Price : 23.16 Evaluated at bid price : 24.78 Bid-YTW : 3.22 % |
| There were 39 other index-included issues trading in excess of 10,000 shares. | |||
| Wide Spread Highlights | ||
| Issue | Index | Quote Data and Yield Notes |
| TRP.PR.E | FixedReset | Quote: 23.18 – 23.99 Spot Rate : 0.8100 Average : 0.5532 YTW SCENARIO |
| SLF.PR.H | FixedReset | Quote: 21.44 – 22.00 Spot Rate : 0.5600 Average : 0.3462 YTW SCENARIO |
| ENB.PR.T | FixedReset | Quote: 19.40 – 19.88 Spot Rate : 0.4800 Average : 0.3128 YTW SCENARIO |
| MFC.PR.L | FixedReset | Quote: 23.22 – 23.72 Spot Rate : 0.5000 Average : 0.3353 YTW SCENARIO |
| PWF.PR.P | FixedReset | Quote: 17.61 – 18.06 Spot Rate : 0.4500 Average : 0.3015 YTW SCENARIO |
| NA.PR.Q | FixedReset | Quote: 24.91 – 25.25 Spot Rate : 0.3400 Average : 0.2150 YTW SCENARIO |