There are many revolving doors in the world … this one is minor:
Michelle Choi, an analyst for Moody’s Investors Service, gave a credit rating to bonds issued by a New Jersey town in September. In October, she switched sides and started working for the town’s underwriter, Morgan Stanley.
Choi is one of hundreds of employees at Moody’s and other credit-rating companies, including Standard & Poor’s and Fitch Ratings, who’ve gone to work for Wall Street since the 2008 financial crisis exposed the conflicts at the heart of the ratings business.
While there’s no evidence that Choi’s job-hunting influenced the grade she gave Evesham Township’s debt, the rising number of job changes in the industry raises a question: can credit analysts be impartial about grading bonds while looking for employment at banks that underwrite them?
The ratings companies say the answer is yes. An academic study by longtime industry observers suggests otherwise.
Meanwhile, the SEC proudly trumpeted its compliance results:
Each year, the BSA Review Group makes hundreds of referrals based on information gleaned initially from SAR reporting. Some statistics drive home the usefulness of the information we receive through SARs:
• In the last six months or so we have been averaging around one temporary restraining order or asset freeze per month that was initiated based upon SARs reviewed by that group.
• In the last year or so, the SEC has brought actions against seven alleged Ponzi or pyramid schemes collectively involving over $100 million, and has opened a number of investigations or examinations into other possible Ponzi schemes, based on information we first obtained from SARs.
• Also in the last year or so, we’ve charged eight people with insider trading in cases where we allege they collectively earned well over $10 million – again based on information we first obtained from SAR reporting.
• Over the past three and a half years, the SEC has initiated hundreds of exams and investigations based on the leads generated by the group from SARs and other BSA reports.
• And the number of investigations or exams that the SEC has opened based on information first discovered in SARs has essentially doubled each of the past two years.I share these statistics to illustrate the important point that the AML programs you oversee are critical in helping to expose fraud, the exploitation of vulnerable investors, and other misconduct. The quality of the reporting, and the industry expertise that you lend to your reports, often makes it possible for us to act more quickly than we otherwise could. And it increases the chance that we will be able to hold wrongdoers responsible and, we hope, recover investor losses.
It doesn’t sound like much to justify $7-billion in annual costs and the impetus given to terrorists, does it? And, of course, the whole programme was portrayed as an anti-terror weapon, since that is a more popular idea than just another intrusive “crime detection” programme.
And here’s a little more evidence that compliance costs are out of control:
Costs remain a challenge for the [HSBC] Group, with adjusted operating expenditure up by USD 2.2 billion, due to higher regulatory and compliance costs as well as inflationary pressures. Reporting a cost-income ratio of 67% in 2014 (59.6% in 2013), the Group has moved away from its previous target of a cost-income ratio in the mid-50s and is now just aiming to achieve positive jaws on an adjusted basis.
Who cares if any business gets done, as long as regulators are employed?
Here’s a view that the bond market doesn’t care much about the Fed:
Traders are taking the Federal Reserve chair’s comments over the past two days — labor market market isn’t fully healed and inflation is too low — as confirmation that the Fed is very unlikely to raise interest rates in the first half of the year. Economists including UBS Group AG’s Drew Matus and JPMorgan Chase & Co.’s Michael Feroli saw in her message reasons to reaffirm their calls for the first increase to come by June.
But there’s a third view about how Yellen’s testimony applies to the bond market, as expressed by Jim Bianco, the founder of Bianco Research LLC in Chicago: It doesn’t really matter.
In his alternative scenario, “everybody’s right,” Bianco said, in that the Fed could start raising its benchmark rate from near zero, like economists predict, and yields remain low, like traders seem to be anticipating.
With almost $2 trillion of sovereign debt in Europe offering negative yields, demand for U.S. fixed-income assets is unlikely to evaporate regardless of what the Fed does. That demand — coming in part from overseas — will ensure that bond prices remain high and yields low.
It was a mixed day for the Canadian preferred share market, with PerpetualDiscounts gaining 13bp, FixedResets off 7bp and DeemedRetractibles down 10bp. The Performance Highlights table is lengthy, dominated by FixedResets on both sides of the fence. Volume was high.
PerpetualDiscounts now yield 4.93%, equivalent to 6.41% interest at the standard equivalency factor of 1.3x. Long corporates now yield about 3.65%, so the pre-tax interest-equivalent spread (in this context, the “Seniority Spread”) is now about 275bp, a sharp widening from the 260bp reported February 18.
For as long as the FixedReset market is so violently unsettled, I’ll keep publishing updates of the more interesting and meaningful series of FixedResets’ Implied Volatilities. This doesn’t include Enbridge because although Enbridge has a large number of issues outstanding, all of which are quite liquid, the range of Issue Reset Spreads is too small for decent conclusions. The low is 212bp (ENB.PR.H; second-lowest is ENB.PR.D at 237bp) and the high is a mere 268 for ENB.PF.G.
Remember that all rich /cheap assessments are:
» based on Implied Volatility Theory only
» are relative only to other FixedResets from the same issuer
» assume constant GOC-5 yield
» assume constant Implied Volatility
» assume constant spread
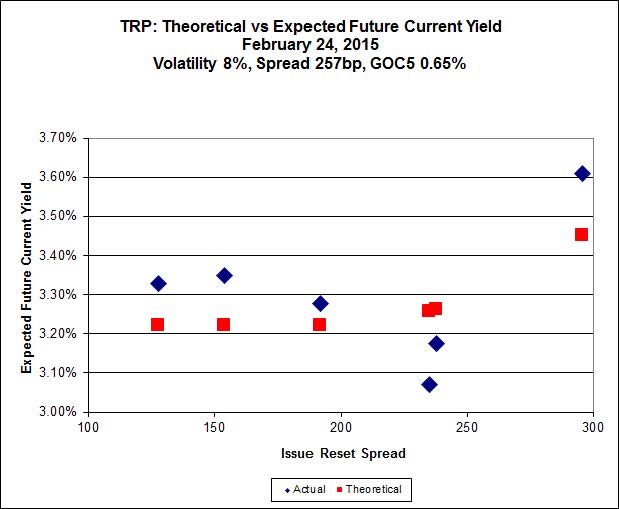
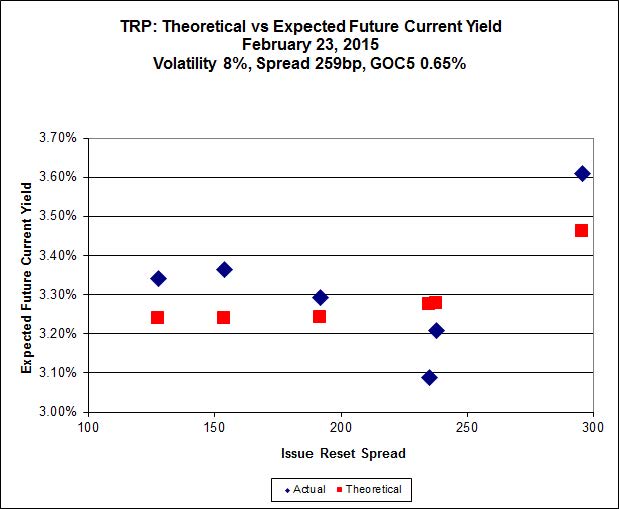
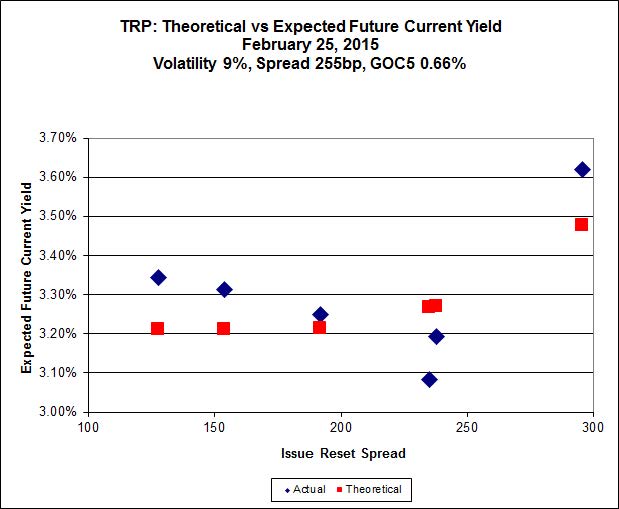
Here’s TRP:
Click for Big
The new issue has caused a large change in the curve-fitting for the TRP series of FixedResets, which is discussed at greater length on the post announcing the new issue. TRP.PR.E, which resets 2019-10-30 at +235, is bid at 24.40 to be $1.36 rich, while the new issue, resetting 2020-11-30 at +296, is $1.03 cheap at its issue price of 25.00.
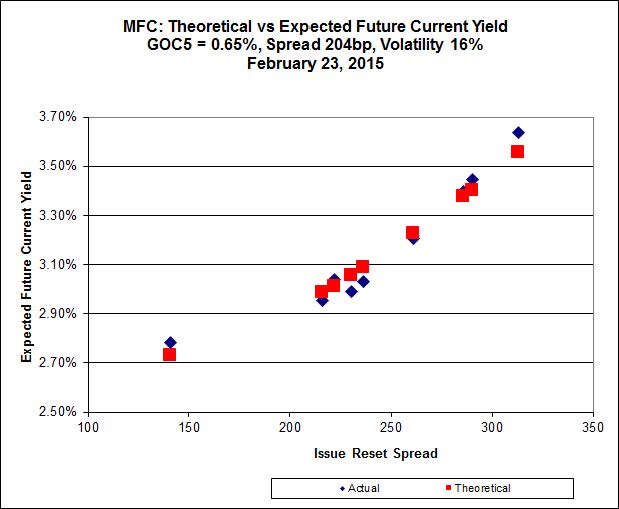
Click for Big
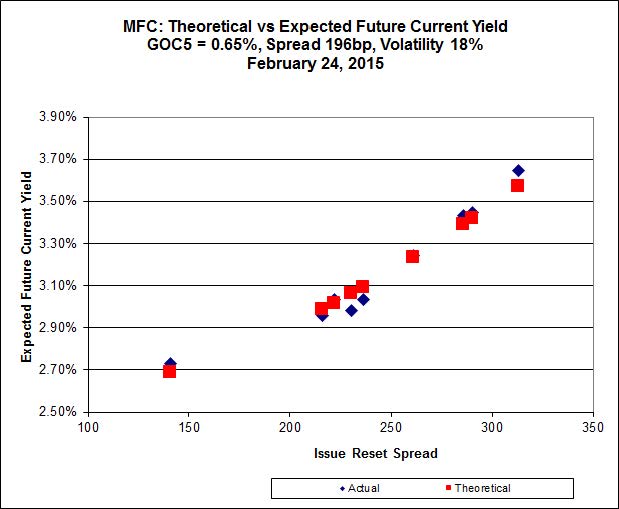
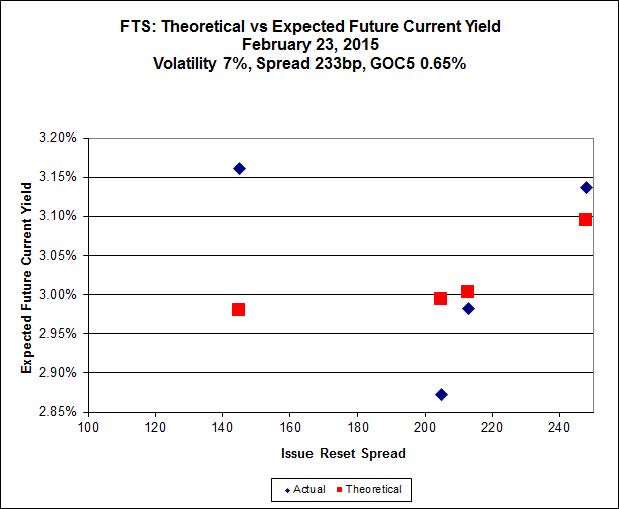
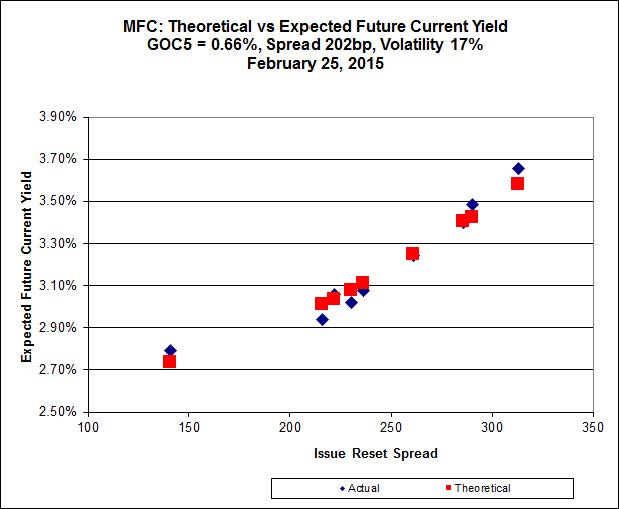
Another excellent fit, but the numbers are perplexing. Implied Volatility for MFC continues to be a conundrum, although it declined substantially today. It is still too high if we consider that NVCC rules will never apply to these issues; it is still too low if we consider them to be NVCC non-compliant issues (and therefore with Deemed Maturities in the call schedule).
Most expensive is MFC.PR.L, resetting at +216 on 2019-6-19, bid at 24.00 to be $0.57 rich, while MFC.PR.H, resetting at +313bp on 2017-3-19, is bid at 25.92 to be $0.57 cheap.
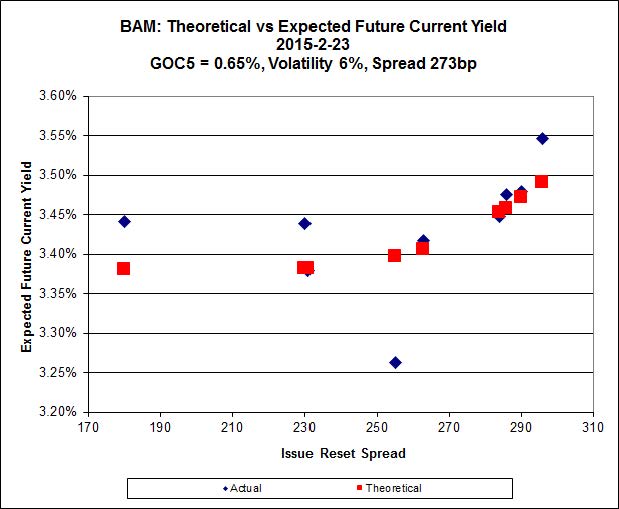
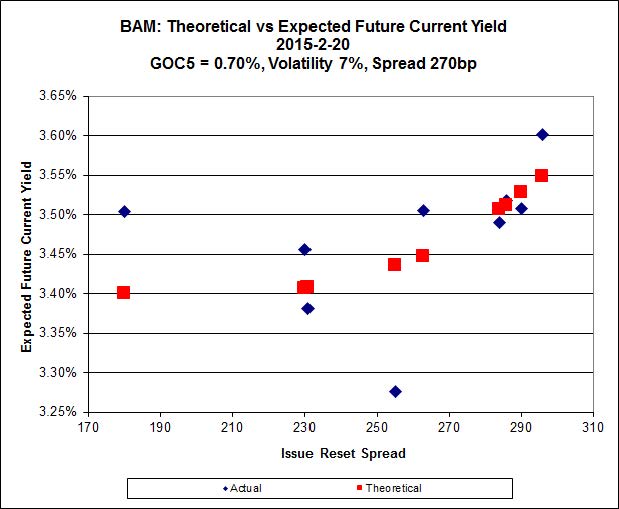
Click for Big
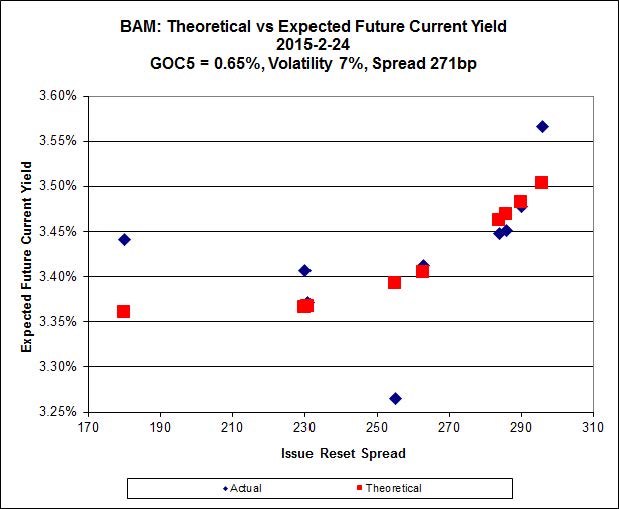
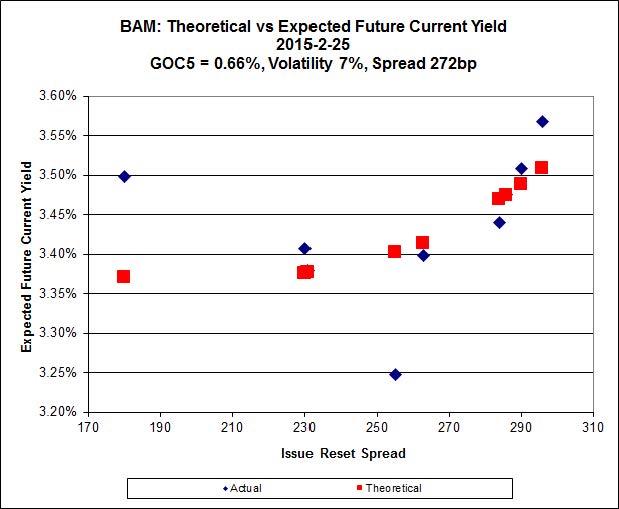
The fit on this series is actually quite reasonable – it’s the scale that makes it look so weird.
The cheapest issue relative to its peers is BAM.PR.X, resetting at +180bp on 2017-6-30, bid at 17.51 to be $0.67 cheap. BAM.PF.E, resetting at +255bp 2020-3-31 is bid at 24.63 and appears to be $1.11 rich.
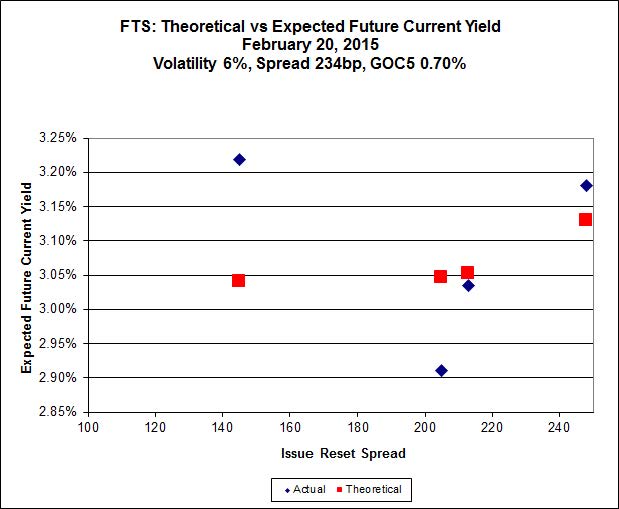
Click for Big
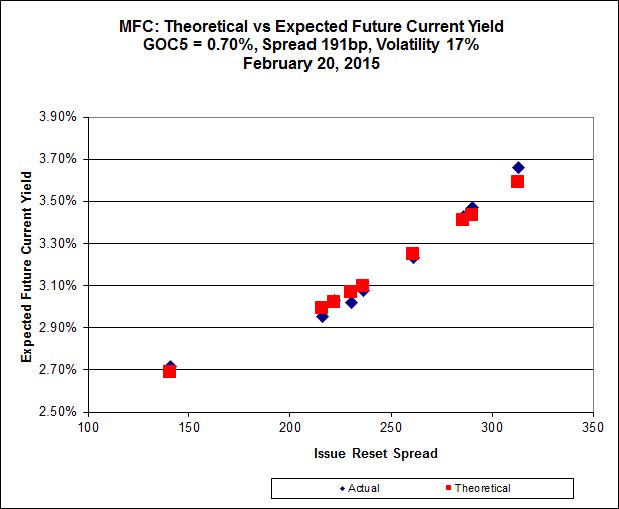
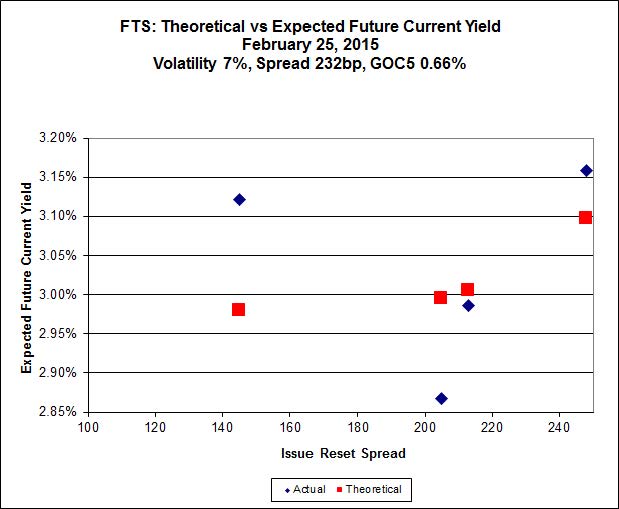
This is just weird because the middle is expensive and the ends are cheap but anyway … FTS.PR.H, with a spread of +145bp, and bid at 16.90, looks $0.80 cheap and resets 2015-6-1. FTS.PR.K, with a spread of +205bp and resetting 2019-3-1, is bid at 23.63 and is $1.01 rich.

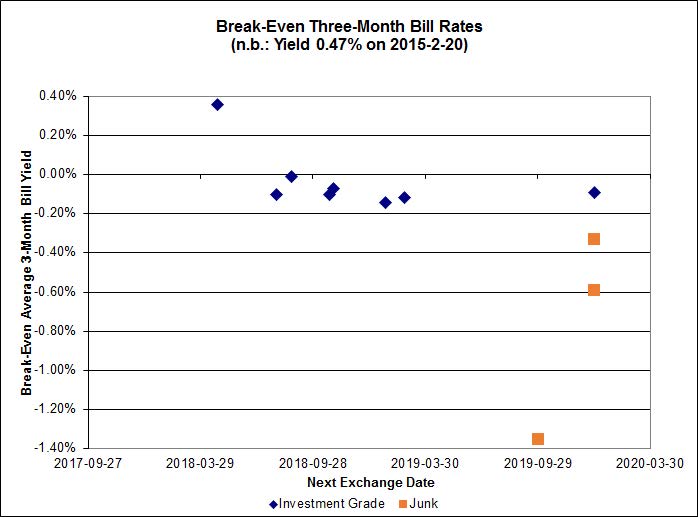
Click for Big
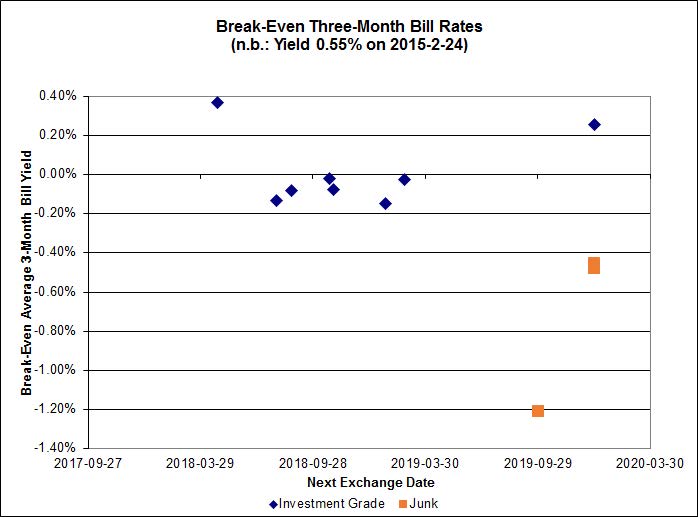
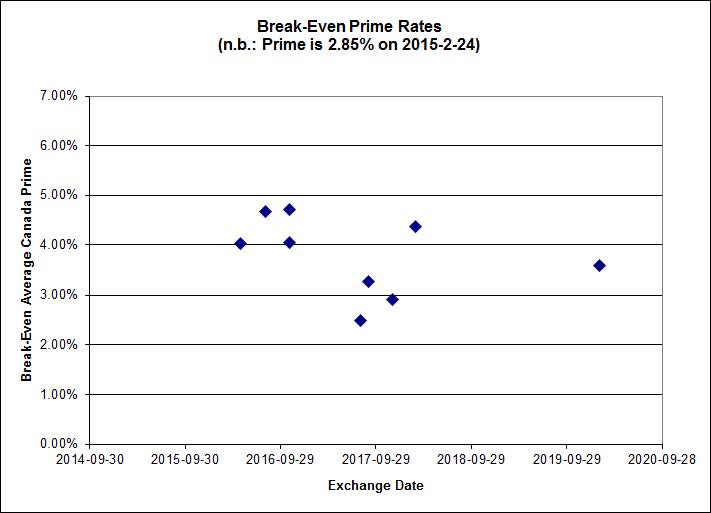
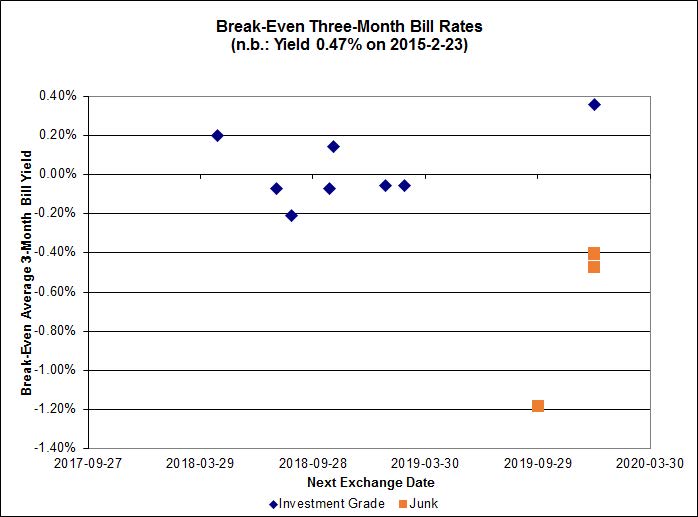
Most of the investment grade break-even rates are a little below zero.
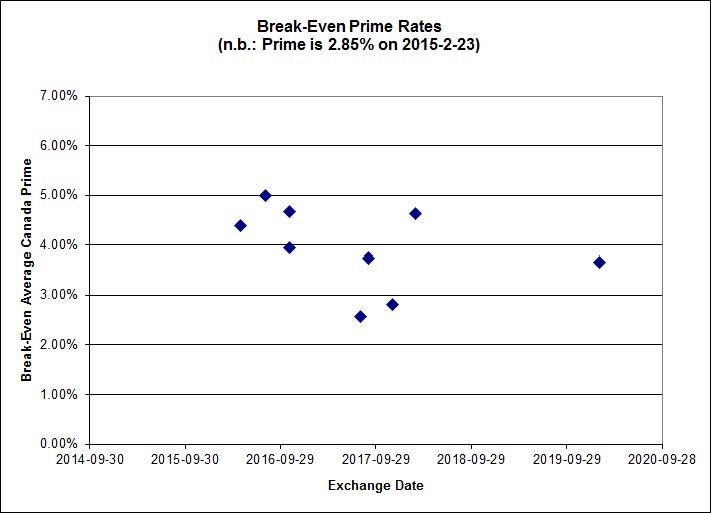
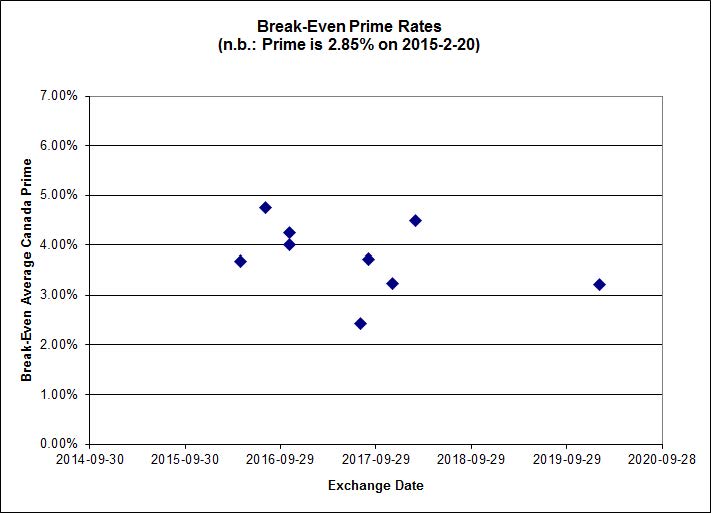
On the other hand, the market’s distaste for product linked to Money Market rates does not extend to prime, as shown by the FixedFloater/RatchetRate pairs:

Click for Big
Shall we just say that this exhibits a high level of confidence in the continued rapacity of Canadian banks?
| HIMIPref™ Preferred Indices These values reflect the December 2008 revision of the HIMIPref™ Indices Values are provisional and are finalized monthly |
|||||||
| Index | Mean Current Yield (at bid) |
Median YTW |
Median Average Trading Value |
Median Mod Dur (YTW) |
Issues | Day’s Perf. | Index Value |
| Ratchet | 0.00 % | 0.00 % | 0 | 0.00 | 0 | -1.7968 % | 2,291.1 |
| FixedFloater | 4.42 % | 3.57 % | 18,906 | 18.30 | 1 | -1.1494 % | 4,000.0 |
| Floater | 3.15 % | 3.29 % | 65,511 | 18.96 | 4 | -1.7968 % | 2,435.6 |
| OpRet | 4.08 % | 1.38 % | 110,211 | 0.31 | 1 | 0.0000 % | 2,760.4 |
| SplitShare | 4.41 % | 4.20 % | 28,416 | 3.55 | 6 | 0.4648 % | 3,212.4 |
| Interest-Bearing | 0.00 % | 0.00 % | 0 | 0.00 | 0 | 0.0000 % | 2,524.1 |
| Perpetual-Premium | 5.33 % | -0.55 % | 56,589 | 0.08 | 24 | 0.0768 % | 2,515.2 |
| Perpetual-Discount | 4.94 % | 4.93 % | 142,172 | 15.64 | 10 | 0.1293 % | 2,800.8 |
| FixedReset | 4.42 % | 3.37 % | 212,278 | 16.79 | 79 | -0.0655 % | 2,411.3 |
| Deemed-Retractible | 4.91 % | 0.17 % | 102,710 | 0.17 | 39 | -0.0961 % | 2,652.6 |
| FloatingReset | 2.43 % | 2.86 % | 93,221 | 6.39 | 7 | -0.0861 % | 2,324.2 |
| Performance Highlights | |||
| Issue | Index | Change | Notes |
| BAM.PR.K | Floater | -2.16 % | YTW SCENARIO Maturity Type : Limit Maturity Maturity Date : 2045-02-25 Maturity Price : 14.98 Evaluated at bid price : 14.98 Bid-YTW : 3.36 % |
| BAM.PR.C | Floater | -2.14 % | YTW SCENARIO Maturity Type : Limit Maturity Maturity Date : 2045-02-25 Maturity Price : 15.12 Evaluated at bid price : 15.12 Bid-YTW : 3.33 % |
| ENB.PF.C | FixedReset | -1.66 % | YTW SCENARIO Maturity Type : Limit Maturity Maturity Date : 2045-02-25 Maturity Price : 21.57 Evaluated at bid price : 21.91 Bid-YTW : 4.06 % |
| BAM.PR.X | FixedReset | -1.63 % | YTW SCENARIO Maturity Type : Limit Maturity Maturity Date : 2045-02-25 Maturity Price : 17.51 Evaluated at bid price : 17.51 Bid-YTW : 3.93 % |
| BAM.PR.B | Floater | -1.61 % | YTW SCENARIO Maturity Type : Limit Maturity Maturity Date : 2045-02-25 Maturity Price : 15.30 Evaluated at bid price : 15.30 Bid-YTW : 3.29 % |
| ENB.PF.E | FixedReset | -1.61 % | YTW SCENARIO Maturity Type : Limit Maturity Maturity Date : 2045-02-25 Maturity Price : 21.67 Evaluated at bid price : 22.06 Bid-YTW : 4.06 % |
| MFC.PR.F | FixedReset | -1.59 % | YTW SCENARIO Maturity Type : Hard Maturity Maturity Date : 2025-01-31 Maturity Price : 25.00 Evaluated at bid price : 18.55 Bid-YTW : 5.81 % |
| ENB.PF.A | FixedReset | -1.48 % | YTW SCENARIO Maturity Type : Limit Maturity Maturity Date : 2045-02-25 Maturity Price : 21.58 Evaluated at bid price : 21.90 Bid-YTW : 4.07 % |
| PWF.PR.A | Floater | -1.37 % | YTW SCENARIO Maturity Type : Limit Maturity Maturity Date : 2045-02-25 Maturity Price : 18.00 Evaluated at bid price : 18.00 Bid-YTW : 2.78 % |
| SLF.PR.G | FixedReset | -1.25 % | YTW SCENARIO Maturity Type : Hard Maturity Maturity Date : 2025-01-31 Maturity Price : 25.00 Evaluated at bid price : 17.41 Bid-YTW : 6.20 % |
| BAM.PR.G | FixedFloater | -1.15 % | YTW SCENARIO Maturity Type : Limit Maturity Maturity Date : 2045-02-25 Maturity Price : 21.79 Evaluated at bid price : 21.50 Bid-YTW : 3.57 % |
| MFC.PR.M | FixedReset | -1.05 % | YTW SCENARIO Maturity Type : Hard Maturity Maturity Date : 2025-01-31 Maturity Price : 25.00 Evaluated at bid price : 24.54 Bid-YTW : 3.68 % |
| MFC.PR.N | FixedReset | -1.01 % | YTW SCENARIO Maturity Type : Hard Maturity Maturity Date : 2025-01-31 Maturity Price : 25.00 Evaluated at bid price : 24.50 Bid-YTW : 3.64 % |
| ENB.PR.F | FixedReset | 1.02 % | YTW SCENARIO Maturity Type : Limit Maturity Maturity Date : 2045-02-25 Maturity Price : 19.80 Evaluated at bid price : 19.80 Bid-YTW : 4.19 % |
| MFC.PR.L | FixedReset | 1.05 % | YTW SCENARIO Maturity Type : Hard Maturity Maturity Date : 2025-01-31 Maturity Price : 25.00 Evaluated at bid price : 24.00 Bid-YTW : 3.79 % |
| PVS.PR.B | SplitShare | 1.09 % | YTW SCENARIO Maturity Type : Hard Maturity Maturity Date : 2019-01-10 Maturity Price : 25.00 Evaluated at bid price : 25.12 Bid-YTW : 4.20 % |
| TRP.PR.A | FixedReset | 1.28 % | YTW SCENARIO Maturity Type : Limit Maturity Maturity Date : 2045-02-25 Maturity Price : 19.85 Evaluated at bid price : 19.85 Bid-YTW : 3.49 % |
| MFC.PR.I | FixedReset | 1.33 % | YTW SCENARIO Maturity Type : Call Maturity Date : 2017-09-19 Maturity Price : 25.00 Evaluated at bid price : 25.90 Bid-YTW : 2.84 % |
| TRP.PR.C | FixedReset | 1.53 % | YTW SCENARIO Maturity Type : Limit Maturity Maturity Date : 2045-02-25 Maturity Price : 16.60 Evaluated at bid price : 16.60 Bid-YTW : 3.46 % |
| FTS.PR.H | FixedReset | 1.99 % | YTW SCENARIO Maturity Type : Limit Maturity Maturity Date : 2045-02-25 Maturity Price : 16.90 Evaluated at bid price : 16.90 Bid-YTW : 3.13 % |
| CU.PR.C | FixedReset | 2.49 % | YTW SCENARIO Maturity Type : Limit Maturity Maturity Date : 2045-02-25 Maturity Price : 23.25 Evaluated at bid price : 24.33 Bid-YTW : 3.16 % |
| Volume Highlights | |||
| Issue | Index | Shares Traded |
Notes |
| TD.PF.A | FixedReset | 118,915 | TD crossed blocks of 12,000 at 24.80 and 25,000 at 24.77, sold 11,900 to Desjardins at 24.80 and 25,800 to anonymous at 24.82. Nesbitt crossed 40,000 at 24.80. YTW SCENARIO Maturity Type : Limit Maturity Maturity Date : 2045-02-25 Maturity Price : 23.10 Evaluated at bid price : 24.75 Bid-YTW : 3.02 % |
| BMO.PR.S | FixedReset | 113,266 | Scotia crossed blocks of 25,000 and 50,000, both at 25.00. TD crossed 15,000 at the same price. YTW SCENARIO Maturity Type : Limit Maturity Maturity Date : 2045-02-25 Maturity Price : 23.20 Evaluated at bid price : 24.92 Bid-YTW : 3.06 % |
| OSP.PR.A | SplitShare | 78,932 | Recent new issue. YTW SCENARIO Maturity Type : Hard Maturity Maturity Date : 2020-03-31 Maturity Price : 10.00 Evaluated at bid price : 10.10 Bid-YTW : 4.81 % |
| BMO.PR.T | FixedReset | 75,733 | RBC crossed 20,000 at 24.70. TD crossed blocks of 25,000 and 15,000 at the same price. YTW SCENARIO Maturity Type : Limit Maturity Maturity Date : 2045-02-25 Maturity Price : 23.05 Evaluated at bid price : 24.57 Bid-YTW : 3.04 % |
| RY.PR.E | Deemed-Retractible | 62,900 | Nesbitt crossed 60,000 at 25.53. YTW SCENARIO Maturity Type : Call Maturity Date : 2015-03-27 Maturity Price : 25.25 Evaluated at bid price : 25.49 Bid-YTW : -6.80 % |
| SLF.PR.G | FixedReset | 44,686 | YTW SCENARIO Maturity Type : Hard Maturity Maturity Date : 2025-01-31 Maturity Price : 25.00 Evaluated at bid price : 17.41 Bid-YTW : 6.20 % |
| There were 43 other index-included issues trading in excess of 10,000 shares. | |||
| Wide Spread Highlights | ||
| Issue | Index | Quote Data and Yield Notes |
| PWF.PR.T | FixedReset | Quote: 25.04 – 25.59 Spot Rate : 0.5500 Average : 0.3383 YTW SCENARIO |
| NEW.PR.D | SplitShare | Quote: 32.43 – 33.43 Spot Rate : 1.0000 Average : 0.8380 YTW SCENARIO |
| BAM.PR.G | FixedFloater | Quote: 21.50 – 21.99 Spot Rate : 0.4900 Average : 0.3745 YTW SCENARIO |
| CM.PR.P | FixedReset | Quote: 24.42 – 24.75 Spot Rate : 0.3300 Average : 0.2150 YTW SCENARIO |
| MFC.PR.B | Deemed-Retractible | Quote: 24.57 – 24.94 Spot Rate : 0.3700 Average : 0.2720 YTW SCENARIO |
| MFC.PR.G | FixedReset | Quote: 25.54 – 25.77 Spot Rate : 0.2300 Average : 0.1541 YTW SCENARIO |