Jobs, jobs, jobs!
A November surprise that included a jump in wages as well as the biggest hiring surge in almost three years suggests the world’s largest economy is putting aside doubts about the strength of the expansion.
The 321,000 advance in payrolls followed a 243,000 increase in October that was stronger than previously reported, Labor Department figures showed today in Washington. The jobless rate held at a six-year low of 5.8 percent and earnings rose by the most since June of last year.
…
The breadth of industries hiring last month was the broadest since 1998, a sign the benefits of the expansion were rippling through the economy.
Factory payrolls rose by the most in a year, professional and business services companies took on more employees than at any time since November 2010, financial firms boosted payrolls by the most since early 2012 and hiring at retailers picked up.
…
The yield on the benchmark 10-year Treasury note rose to 2.31 percent at 2:47 p.m. in New York from 2.24 percent late yesterday. The Bloomberg Dollar Spot Index, which tracks the greenback against 10 trading partners, gained 0.8 percent, and the Standard & Poor’s 500 Index advanced 0.2 percent.
Up north, not so much:
The Canadian dollar reached a five-year low as data showed the economy lost jobs in November while U.S. payrolls swelled, adding to speculation the Federal Reserve will raise interest rates before the Bank of Canada.
The currency erased a weekly gain as the report showed employment fell by 10,700 jobs. The drop bolstered a Bank of Canada statement this week that, while the recovery shows signs of broadening, the labor market “continues to indicate significant slack in the economy.” The nation added 117,200 jobs over the previous two months.
…
Canadian government bonds fell, pushing the yield on the benchmark 10-year security up five basis points, or 0.05 percentage point, to 1.96 percent. It reached 1.98 percent, the highest level since Nov. 25. The price of the debt dropped 46 cents to C$104.67.
Employment declined after jumps of 43,100 and 74,100 the last two months, Statistics Canada said today from Ottawa. The unemployment rate rose to 6.6 percent from a six-year low of 6.5 percent. Economists surveyed by Bloomberg News projected employment would be unchanged and the jobless rate would rise to 6.6 percent, according to median forecasts.
And things are still sluggish in Germany:
But Germany’s Bundesbank halved its 2015 growth forecast for Germany to 1.0 per cent and also cut its estimate for this year to 1.4 per cent from a forecast of 1.9 per cent made in June. It also trimmed its prediction for 2016 to 1.6 per cent.
“However, there is reason to hope that the current sluggish phase will prove to be short-lived,” Bundesbank President Jens Weidmann said in a statement, adding that opportunities abroad would likely increase again next year.
He also said that if crude oil prices remained subdued for a longer period, gross domestic product (GDP) could expand by an additional 0.1-0.2 percentage points in both 2015 and 2016.
… and in Italy:
Standard & Poor’s cut Italy’s sovereign credit rating on Friday from triple-B to triple-B-minus, just one notch above junk, saying weak growth and poor competitiveness undermined the sustainability of its huge public debt.
The downgrade is a blow for Prime Minister Matteo Renzi, who came to office in February pledging an ambitious reform agenda to lift Italy out of recession, but has seen the economy continue to shrink.
S&P said the new triple-B-minus rating carried a stable outlook. It forecast Italian economic growth would be just 0.2 per cent in 2015 and would average 0.5 per cent in 2014-2017.
As recently as June, the agency had confirmed Italy’s triple-B rating and forecast average growth of 1.0 per cent over the three-year period.
Italy’s economy is expected to shrink in 2014 for the third consecutive year.
There’s an interesting paper by Gregory Thwaites titled Why are real interest rates so low? Secular stagnation and the relative price of investment goods:
Over the past four decades, real interest rates have risen then fallen across the industrialised world. Over the same period, nominal investment rates are down, while house prices and household debt are up. I explain these four trends with a �fifth – the widespread fall in the relative price of investment goods. I present a simple closed-economy OLG model in which households finance retirement in part by selling claims on the corporate sector (capital goods) accumulated over their working lives. As capital goods prices fall, the interest rate must fall to reflect capital losses. And in the long run, a given quantity of saving buys more capital goods. This has ambiguous effects on interest rates in the long run: if the production function is inelastic, in line with most estimates in the literature, interest rates stay low even after relative prices have stopped falling. Lower interest rates reduce the user cost of housing, raising house prices and, given that housing is bought early in life, increasing household debt. I extend the model to allow for a heterogeneous bequest motive, and show that wealth inequality rises but consumption inequality falls. I test the model on cross-country data and �find support for its assumptions and predictions. The analysis in this paper shows recent debates on macroeconomic imbalances and household and government indebtedness in a new light. In particular, low real interest rates may be the new normal. The debt of the young provides an alternative outlet for the retirement savings of the old; preventing the accumulation of debt, for example through macroprudential policy, leads to a bigger fall in interest rates.
…
This paper fleshes out a new, complementary explanation for the falls in real interest rates, rises in household debt and falling investment rates across the industrialised world. The story is based on the widespread fall in the price of investment goods – the machines, equipment and buildings that firms buy – relative to the prices of other things the economy produces. This fall has reduced the demand for savings, rather than the supply.
This makes sense to me. When you’re starting a business, you don’t (usually) need $100-million for a new factory any more; $10,000 for a couple of new computers will (often) do the trick. Thanks to Ian McGugan of the Globe for writing a review.
It’s a black day … the UK is redeeming some perps:
U.K. Chancellor George Osborne is to repay the state’s century-old war debt. By current standards, the undated stock is expensive for the government to service. Terms give holders of the hard-to-trade bond a decent payoff. It looks like a win-win. Time could prove a harsher judge of the deal.
The British government issued its War Loan in 1917. At first, the undated debt offered a yield of 5 per cent. It was restructured in 1947 to pay 3.5 per cent. Even that lower figure looks expensive by current standards. Weak economic growth and low inflation have suppressed long-dated yields. Ten-year UK government debt gives only 2 per cent at present.
I’ve always been fond of the British perps … fortunately, my all-time favourite, the 2.5% annuities issued in 1853 are still outstanding … all £1-million of them!
BSD.PR.A was confirmed at Pfd-4(low) by DBRS:
As of December 1, 2014, the Portfolio consisted of 72.0% Canadian common stock, 22.0% REITs, 4.0% limited partnerships and 2.0% Canadian preferred stock. The rating was last confirmed in December 2013 and performance has been generally positive in the first half year of 2014, but has since been volatile. Downside protection available to holders of the Preferred Securities rose to 29.9% in June 2014, but has since been volatile, dropping to approximately 20.0% at the end of November 2014 (similar to November 2013 levels). The yield on the Portfolio has decreased slightly, causing the distribution coverage ratio to drop to 0.70 times (as of November 28, 2014). The rating on the Preferred Securities continues to be constrained by the large percentage of underlying securities in the Portfolio that are not rated by any rating agency and the grind on the Portfolio due to distributions exceeding income.
I suggest that preferred share investors stop looking at their monitors and go for a nice walk … like this guy:
It was another awful day for the Canadian preferred share market, with PerpetualDiscounts losing 38bp, FixedResets down 36bp and DeemedRetractibles off 5bp. Another lengthy Performance Report is – again – dominated by losing FixedResets which are – again – predominantly lower spread and Enbridge issues. Despite four issues (recent heavy losers) breaking the 100,000 share barrier, volume was slightly below average.
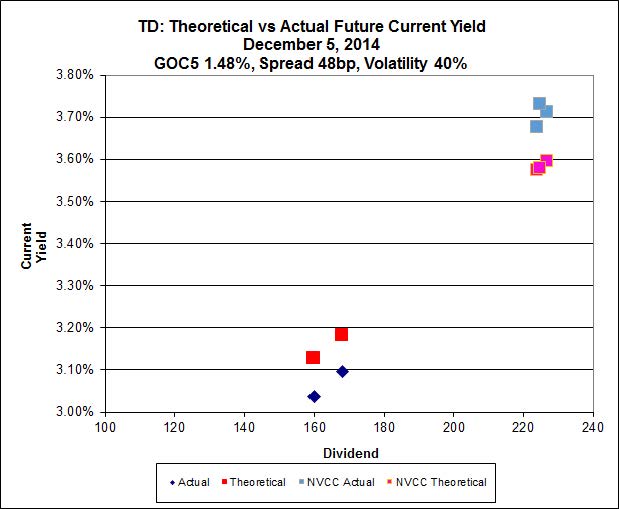
All this poor performance by the lower-reset issues should imply a decrease in Implied Volatility, so here are some pictures:
 Click for Big
So according to this, TRP.PR.A, bid at 21.40, is $0.74 cheap, but it has already reset. TRP.PR.B, bid at 17.37, is $0.60 cheap, but it resets 2015-6-30. TRP.PR.C, bid at 20.52, is $0.86 expensive, but it resets 2016-1-30. So an alternative way of resolving the differences between these three issues is to expect the GOC-5 yield to stay at 1.48% until TRP.PR.B resets, but to increase to about 1.72% prior to TRP.PR.C resetting.
 Click for Big
MFC volatility is still very high. The low-spread MFC.PR.F looks a little cheap … and it doesn’t reset until 2016-6-19.
 Click for Big
BAM.PR.X, with a +180bp spread, bid at 21.40, looks $1.06 cheap and doesn’t reset until 2017-6-30. BAM.PR.R, with a +230bp spread, bid at 25.71, looks $1.48 rich and resets 2016-6-30. So go figure that one out, wise guy.
 Click for Big
This is just weird because the middle is expensive and the ends are cheap but anyway … FTS.PR.H, with a spread of +145bp, and bid at 20.01, looks $0.39 cheap and resets 2015-6-1. FTS.PR.K, with a spread of +205bp, and bid at 24.81, looks $0.56 expensive and resets 2019-3-1.
HIMIPref™ Preferred Indices
These values reflect the December 2008 revision of the HIMIPref™ Indices
Values are provisional and are finalized monthly |
| Index |
Mean
Current
Yield
(at bid) |
Median
YTW |
Median
Average
Trading
Value |
Median
Mod Dur
(YTW) |
Issues |
Day’s Perf. |
Index Value |
| Ratchet |
0.00 % |
0.00 % |
0 |
0.00 |
0 |
0.7412 % |
2,536.8 |
| FixedFloater |
0.00 % |
0.00 % |
0 |
0.00 |
0 |
0.7412 % |
4,016.3 |
| Floater |
2.97 % |
3.08 % |
62,774 |
19.45 |
4 |
0.7412 % |
2,696.8 |
| OpRet |
4.40 % |
-11.75 % |
26,721 |
0.08 |
2 |
-0.0195 % |
2,759.0 |
| SplitShare |
4.28 % |
3.84 % |
40,220 |
3.74 |
5 |
-0.3663 % |
3,186.5 |
| Interest-Bearing |
0.00 % |
0.00 % |
0 |
0.00 |
0 |
-0.0195 % |
2,522.8 |
| Perpetual-Premium |
5.41 % |
-2.53 % |
73,249 |
0.09 |
20 |
0.0117 % |
2,487.7 |
| Perpetual-Discount |
5.16 % |
5.06 % |
114,478 |
15.34 |
15 |
-0.3773 % |
2,656.8 |
| FixedReset |
4.21 % |
3.63 % |
194,795 |
16.75 |
74 |
-0.3560 % |
2,552.4 |
| Deemed-Retractible |
4.97 % |
-0.83 % |
102,250 |
0.15 |
40 |
-0.0505 % |
2,613.3 |
| FloatingReset |
2.53 % |
1.87 % |
59,644 |
3.48 |
5 |
0.3221 % |
2,552.8 |
| Performance Highlights |
| Issue |
Index |
Change |
Notes |
| SLF.PR.G |
FixedReset |
-2.48 % |
YTW SCENARIO
Maturity Type : Hard Maturity
Maturity Date : 2025-01-31
Maturity Price : 25.00
Evaluated at bid price : 19.70
Bid-YTW : 5.60 % |
| GWO.PR.N |
FixedReset |
-2.46 % |
YTW SCENARIO
Maturity Type : Hard Maturity
Maturity Date : 2025-01-31
Maturity Price : 25.00
Evaluated at bid price : 19.80
Bid-YTW : 5.46 % |
| TRP.PR.B |
FixedReset |
-2.14 % |
YTW SCENARIO
Maturity Type : Limit Maturity
Maturity Date : 2044-12-05
Maturity Price : 17.37
Evaluated at bid price : 17.37
Bid-YTW : 3.85 % |
| PWF.PR.P |
FixedReset |
-1.81 % |
YTW SCENARIO
Maturity Type : Limit Maturity
Maturity Date : 2044-12-05
Maturity Price : 21.11
Evaluated at bid price : 21.11
Bid-YTW : 3.65 % |
| ENB.PR.B |
FixedReset |
-1.54 % |
YTW SCENARIO
Maturity Type : Limit Maturity
Maturity Date : 2044-12-05
Maturity Price : 22.92
Evaluated at bid price : 23.73
Bid-YTW : 3.96 % |
| CGI.PR.D |
SplitShare |
-1.51 % |
YTW SCENARIO
Maturity Type : Soft Maturity
Maturity Date : 2023-06-14
Maturity Price : 25.00
Evaluated at bid price : 24.85
Bid-YTW : 3.84 % |
| TRP.PR.C |
FixedReset |
-1.44 % |
YTW SCENARIO
Maturity Type : Limit Maturity
Maturity Date : 2044-12-05
Maturity Price : 20.52
Evaluated at bid price : 20.52
Bid-YTW : 3.68 % |
| MFC.PR.C |
Deemed-Retractible |
-1.43 % |
YTW SCENARIO
Maturity Type : Hard Maturity
Maturity Date : 2025-01-31
Maturity Price : 25.00
Evaluated at bid price : 22.79
Bid-YTW : 5.67 % |
| ENB.PR.H |
FixedReset |
-1.28 % |
YTW SCENARIO
Maturity Type : Limit Maturity
Maturity Date : 2044-12-05
Maturity Price : 21.33
Evaluated at bid price : 21.63
Bid-YTW : 4.15 % |
| ENB.PR.N |
FixedReset |
-1.27 % |
YTW SCENARIO
Maturity Type : Limit Maturity
Maturity Date : 2044-12-05
Maturity Price : 22.90
Evaluated at bid price : 24.10
Bid-YTW : 4.10 % |
| ENB.PR.D |
FixedReset |
-1.27 % |
YTW SCENARIO
Maturity Type : Limit Maturity
Maturity Date : 2044-12-05
Maturity Price : 22.62
Evaluated at bid price : 23.36
Bid-YTW : 4.02 % |
| PWF.PR.S |
Perpetual-Discount |
1.16 % |
YTW SCENARIO
Maturity Type : Limit Maturity
Maturity Date : 2044-12-05
Maturity Price : 24.10
Evaluated at bid price : 24.50
Bid-YTW : 4.93 % |
| BAM.PR.B |
Floater |
1.54 % |
YTW SCENARIO
Maturity Type : Limit Maturity
Maturity Date : 2044-12-05
Maturity Price : 17.18
Evaluated at bid price : 17.18
Bid-YTW : 3.08 % |
| Volume Highlights |
| Issue |
Index |
Shares
Traded |
Notes |
| HSE.PR.A |
FixedReset |
145,346 |
Nesbitt crossed 127,800 at 19.63.
YTW SCENARIO
Maturity Type : Limit Maturity
Maturity Date : 2044-12-05
Maturity Price : 19.80
Evaluated at bid price : 19.80
Bid-YTW : 4.02 % |
| TRP.PR.A |
FixedReset |
132,032 |
Will reset at 3.266%. Nesbitt crossed 50,000 at 21.36.
YTW SCENARIO
Maturity Type : Limit Maturity
Maturity Date : 2044-12-05
Maturity Price : 21.40
Evaluated at bid price : 21.40
Bid-YTW : 3.85 % |
| ENB.PF.G |
FixedReset |
122,942 |
RBC crossed blocks of 77,600 shares, 15,000 and 21,100, all at 24.85.
YTW SCENARIO
Maturity Type : Limit Maturity
Maturity Date : 2044-12-05
Maturity Price : 23.05
Evaluated at bid price : 24.81
Bid-YTW : 4.08 % |
| ENB.PF.C |
FixedReset |
102,155 |
Desjardins sold blocks of 49,200 and 46,300 to anonymous, both at 24.90.
YTW SCENARIO
Maturity Type : Limit Maturity
Maturity Date : 2044-12-05
Maturity Price : 23.08
Evaluated at bid price : 24.80
Bid-YTW : 4.05 % |
| TD.PR.S |
FixedReset |
98,336 |
TD crossed 90,000 at 25.42.
YTW SCENARIO
Maturity Type : Hard Maturity
Maturity Date : 2022-01-31
Maturity Price : 25.00
Evaluated at bid price : 25.35
Bid-YTW : 3.03 % |
| TRP.PR.E |
FixedReset |
67,400 |
RBC crossed 62,000 at 25.55.
YTW SCENARIO
Maturity Type : Limit Maturity
Maturity Date : 2044-12-05
Maturity Price : 23.30
Evaluated at bid price : 25.40
Bid-YTW : 3.67 % |
| There were 24 other index-included issues trading in excess of 10,000 shares. |
| Wide Spread Highlights |
| Issue |
Index |
Quote Data and Yield Notes |
| PVS.PR.C |
SplitShare |
Quote: 25.90 – 26.90
Spot Rate : 1.0000
Average : 0.8043
YTW SCENARIO
Maturity Type : Call
Maturity Date : 2015-12-10
Maturity Price : 25.50
Evaluated at bid price : 25.90
Bid-YTW : 3.17 % |
| TD.PR.R |
Deemed-Retractible |
Quote: 26.27 – 26.88
Spot Rate : 0.6100
Average : 0.4440
YTW SCENARIO
Maturity Type : Call
Maturity Date : 2015-01-04
Maturity Price : 25.75
Evaluated at bid price : 26.27
Bid-YTW : -12.23 % |
| ENB.PR.B |
FixedReset |
Quote: 23.73 – 24.23
Spot Rate : 0.5000
Average : 0.3427
YTW SCENARIO
Maturity Type : Limit Maturity
Maturity Date : 2044-12-05
Maturity Price : 22.92
Evaluated at bid price : 23.73
Bid-YTW : 3.96 % |
| MFC.PR.H |
FixedReset |
Quote: 25.90 – 26.45
Spot Rate : 0.5500
Average : 0.4146
YTW SCENARIO
Maturity Type : Call
Maturity Date : 2017-03-19
Maturity Price : 25.00
Evaluated at bid price : 25.90
Bid-YTW : 2.90 % |
| MFC.PR.C |
Deemed-Retractible |
Quote: 22.79 – 23.27
Spot Rate : 0.4800
Average : 0.3517
YTW SCENARIO
Maturity Type : Hard Maturity
Maturity Date : 2025-01-31
Maturity Price : 25.00
Evaluated at bid price : 22.79
Bid-YTW : 5.67 % |
| FTS.PR.F |
Perpetual-Discount |
Quote: 24.51 – 25.00
Spot Rate : 0.4900
Average : 0.3672
YTW SCENARIO
Maturity Type : Limit Maturity
Maturity Date : 2044-12-05
Maturity Price : 24.07
Evaluated at bid price : 24.51
Bid-YTW : 5.01 % |