I wasn’t the only one to laugh off the Lehman bankruptcy:
The day after Lehman Brothers Holdings Inc. declared the largest bankruptcy in U.S. history in 2008, Federal Reserve officials remained unsure whether the financial crisis would do lasting damage to the U.S. economy.
“I don’t think we’ve seen a significant change in the basic outlook,” Dave Stockton, the Fed’s top forecaster, said on Sept. 16, 2008 according to transcripts released today in Washington. “We’re still expecting a very gradual pickup in GDP growth over the next year.”
A new worry … tapering!
Equities erased gains today as Dallas Fed President Richard Fisher said it’s hard to argue that further expansion of central bank balance sheet has had “much efficacy.”
“This is why I’ve been such a strong proponent of dialing back our large-scale asset purchases and will continue advocating that we do so,” Fisher said in text of speech in Austin, Texas.
St. Louis Fed President James Bullard, who doesn’t vote on the Federal Open Market Committee this year, said the central bank is on target to continue scaling back stimulus, adding that soft economic data in 2014 is probably due to bad weather.
The Dallas Fed published excerpts from Fisher’s speech:
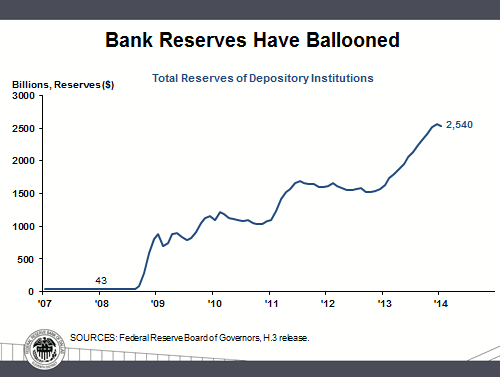
But as I have shown this afternoon, the store of bank reserves awaiting discharge into the economy through our banking system is vast, yet it lies fallow. Take a look at this chart of total reserves of depository institutions: They have ballooned from a precrisis level of $43 billion to more than $2.5 trillion.[Graph: Bank Reserves…]
Here is the point: There is plenty of money available for businesses to work with. Consider this: In fourth quarter 2007 the nation’s gross domestic product (GDP) was $14.7 trillion; at year-end 2013 it was estimated to be $17.1 trillion. Had we continued on the path we were on before the crisis, GDP would currently be roughly $20 trillion in size. That’s a third larger than it was in 2007. Yet the amount of money lying fallow in the banking system is 60 times greater now than it was at year-end 2007. One is hard pressed to argue that there is insufficient money available for businesses to put people back to work.
Now, bear in mind that we at the Fed only control the monetary base (cash plus bank reserves), not the velocity with which money is used. Again, consider this graph:[Graph: Newly Created Money…]
Over the past six years, the monetary base has increased 340 percent, 10 times the rate at which the economy would have expanded in nominal terms had we not suffered the recent recession. One is hard pressed to argue that there is much efficacy derived from additional expansion of the Fed’s balance sheet. This is why I’ve been such a strong proponent of dialing back our large-scale asset purchases and will continue advocating that we do so.
It is my firm belief that the fault in our economy lies not in monetary policy but in a reckless and feckless federal government that simply cannot get its fiscal and regulatory policy geared so as to encourage business to take the copious amount of money we at the Fed have created and put it to work creating jobs and growing our economy. Fiscal policy is not only “not an ally of U.S. growth,” it is its enemy. If the fiscal and regulatory authorities that you elect and put into office to craft taxes, spending and regulations do not focus their efforts on providing incentives for businesses to expand job-creating capital investment rather than bicker with each other for partisan purposes, our economy will continue to fall short and the middle-income worker will continue being victimized, no matter how much money the Fed puts into the system.
Click for Big

Click for Big
‘Fair enough’, say preferred share market investors, ‘the expansion of the money supply didn’t have much effect, therefore its removal will be a disaster for the market.’
But there are signs of Canadian hyperinflation:
Canada’s inflation rate accelerated the most in 20 months on a surge in home heating costs amid one of the most severe winters in decades.
The consumer price index rose 1.5 percent in January from a year earlier, the most since June 2012, following December’s 1.2 percent pace, Statistics Canada said today from Ottawa. The nation’s statistics agency also said retail sales in December dropped 1.8 percent, the most in a year. Economists forecast inflation rising at a 1.3 percent pace and a 0.4 percent drop in sales, according to median forecasts in separate Bloomberg News surveys.
It was another positive day for the Canadian preferred share market, with PerpetualDiscounts winning 16bp, FixedResets gaining 2bp and DeemedRetractibles up 7bp. Volatility was muted. Volume was low.
| HIMIPref™ Preferred Indices These values reflect the December 2008 revision of the HIMIPref™ Indices Values are provisional and are finalized monthly |
|||||||
| Index | Mean Current Yield (at bid) |
Median YTW |
Median Average Trading Value |
Median Mod Dur (YTW) |
Issues | Day’s Perf. | Index Value |
| Ratchet | 0.00 % | 0.00 % | 0 | 0.00 | 0 | 0.9565 % | 2,401.0 |
| FixedFloater | 4.76 % | 4.35 % | 30,270 | 17.71 | 1 | -0.2999 % | 3,563.8 |
| Floater | 3.01 % | 3.13 % | 56,841 | 19.35 | 4 | 0.9565 % | 2,592.4 |
| OpRet | 4.61 % | -0.30 % | 69,018 | 0.27 | 3 | 0.0256 % | 2,690.9 |
| SplitShare | 4.89 % | 4.70 % | 59,558 | 4.37 | 5 | -0.1049 % | 3,025.6 |
| Interest-Bearing | 0.00 % | 0.00 % | 0 | 0.00 | 0 | 0.0256 % | 2,460.6 |
| Perpetual-Premium | 5.66 % | 1.60 % | 99,088 | 0.08 | 12 | -0.0132 % | 2,336.8 |
| Perpetual-Discount | 5.53 % | 5.60 % | 148,368 | 14.45 | 26 | 0.1574 % | 2,398.7 |
| FixedReset | 4.85 % | 3.70 % | 211,967 | 6.82 | 80 | 0.0173 % | 2,492.7 |
| Deemed-Retractible | 5.10 % | 3.93 % | 161,949 | 1.68 | 42 | 0.0661 % | 2,433.2 |
| FloatingReset | 2.66 % | 2.66 % | 161,310 | 7.14 | 6 | 0.0134 % | 2,436.8 |
| Performance Highlights | |||
| Issue | Index | Change | Notes |
| PWF.PR.A | Floater | 1.28 % | YTW SCENARIO Maturity Type : Limit Maturity Maturity Date : 2044-02-21 Maturity Price : 19.00 Evaluated at bid price : 19.00 Bid-YTW : 2.77 % |
| IFC.PR.A | FixedReset | 1.71 % | YTW SCENARIO Maturity Type : Hard Maturity Maturity Date : 2025-01-31 Maturity Price : 25.00 Evaluated at bid price : 23.75 Bid-YTW : 4.36 % |
| BAM.PR.K | Floater | 1.81 % | YTW SCENARIO Maturity Type : Limit Maturity Maturity Date : 2044-02-21 Maturity Price : 16.86 Evaluated at bid price : 16.86 Bid-YTW : 3.14 % |
| Volume Highlights | |||
| Issue | Index | Shares Traded |
Notes |
| MFC.PR.D | FixedReset | 114,391 | TD crossed 110,000 at 25.66. YTW SCENARIO Maturity Type : Call Maturity Date : 2014-06-19 Maturity Price : 25.00 Evaluated at bid price : 25.65 Bid-YTW : 2.18 % |
| GWO.PR.I | Deemed-Retractible | 106,070 | Nesbitt crossed 100,000 at 21.53. YTW SCENARIO Maturity Type : Hard Maturity Maturity Date : 2025-01-31 Maturity Price : 25.00 Evaluated at bid price : 21.60 Bid-YTW : 6.36 % |
| RY.PR.Z | FixedReset | 72,565 | Recent new issue. YTW SCENARIO Maturity Type : Limit Maturity Maturity Date : 2044-02-21 Maturity Price : 23.21 Evaluated at bid price : 25.20 Bid-YTW : 3.75 % |
| BMO.PR.J | Deemed-Retractible | 66,075 | RBC crossed 49,700 at 25.50. YTW SCENARIO Maturity Type : Call Maturity Date : 2016-02-25 Maturity Price : 25.00 Evaluated at bid price : 25.42 Bid-YTW : 3.63 % |
| BNS.PR.R | FixedReset | 55,200 | RBC crossed 22,400 at 25.32. TD crossed 25,000 at 25.35. YTW SCENARIO Maturity Type : Hard Maturity Maturity Date : 2022-01-31 Maturity Price : 25.00 Evaluated at bid price : 25.35 Bid-YTW : 3.56 % |
| PWF.PR.R | Perpetual-Discount | 51,200 | Scotia crossed blocks of 39,400 and 10,000, both at 24.70. YTW SCENARIO Maturity Type : Limit Maturity Maturity Date : 2044-02-21 Maturity Price : 24.30 Evaluated at bid price : 24.71 Bid-YTW : 5.60 % |
| There were 24 other index-included issues trading in excess of 10,000 shares. | |||
| Wide Spread Highlights | ||
| Issue | Index | Quote Data and Yield Notes |
| CU.PR.G | Perpetual-Discount | Quote: 21.02 – 21.28 Spot Rate : 0.2600 Average : 0.1643 YTW SCENARIO |
| MFC.PR.K | FixedReset | Quote: 24.72 – 24.96 Spot Rate : 0.2400 Average : 0.1494 YTW SCENARIO |
| ELF.PR.G | Perpetual-Discount | Quote: 20.83 – 21.33 Spot Rate : 0.5000 Average : 0.4133 YTW SCENARIO |
| ELF.PR.F | Perpetual-Discount | Quote: 23.02 – 23.40 Spot Rate : 0.3800 Average : 0.3188 YTW SCENARIO |
| CU.PR.D | Perpetual-Discount | Quote: 23.05 – 23.24 Spot Rate : 0.1900 Average : 0.1308 YTW SCENARIO |
| CGI.PR.D | SplitShare | Quote: 24.65 – 24.95 Spot Rate : 0.3000 Average : 0.2423 YTW SCENARIO |