MFC.PR.G Settles at Steep Discount on Low Volume

December 6th, 2011

Manulife Financial Corporation has announced:

that it has completed its offering of 8 million Non-cumulative Rate Reset Class 1 Shares Series 5 (the “Series 5 Preferred Shares”) at a price of $25 per share to raise gross proceeds of $200 million.

The offering was underwritten by a syndicate of investment dealers co-led by RBC Capital Markets and Scotia Capital Inc. The Series 5 Preferred Shares commence trading on the Toronto Stock Exchange today under the ticker symbol MFC.PR.G.

The Series 5 Preferred Shares were issued under a prospectus supplement dated November 29, 2011 to Manulife’s short form base shelf prospectus dated September 3, 2010.

The $200-million issue size implies that not a single dollar of the $50-million greenshoe was exercised.

MFC.PR.G is a 4.40%+290 FixedReset announced November 29. This issue will be tracked by HIMIPref™ and is assigned to the FixedReset index.

The issue traded 93,042 shares today in a range of 23.66-56, a very high range for an investment-grade opening day, before closing at 24.10-28, 11×5.

Vital statistics are:

MFC.PR.G FixedReset YTW SCENARIO
Maturity Type : Hard Maturity
Maturity Date : 2022-01-31
Maturity Price : 25.00
Evaluated at bid price : 24.10
Bid-YTW : 4.81 %

YLD.PR.B Tracking on HIMIPref™ Halted

December 6th, 2011

YLD.PR.B closed today with a bid of $0.05, having lost nearly all support with the redemption announcement this morning.

This is low enough relative to its stated dividends of $1.05 p.a. (suspended since July 2008) that HIMIPref™ assumes that there has been an input error and refuses to proceed.

Hence, the issue is no longer being tracked.

YLD.PR.A, YLD.PR.B Redemption Announced; Default Almost Certain

December 6th, 2011

Split Yield Corporation (managed by Quadravest) has announced:

Notice of Final Redemption of all Shares Effective February 1, 2012

Split Yield Corporation (the”Company” hereby provides formal notice that all of its outstanding Class I Preferred shares (YLD.PR.A), Class II Preferred shares (YLD.PR.B) and Capital shares (YLD) will be redeemed effective February 1, 2012. This redemption is required by and will occur in accordance with the provisions of the Company’s articles of incorporation, as amended, and has previously been discussed in the Company’s annual information form, financial statements and other continuous disclosure documents filed earlier this year.

As more fully described in the Company’s annual information form, financial statements and other continuous disclosure documents, the Class I Preferred shares rank in priority to the Class II Preferred shares and the Class II Preferred shares rank in priority to the Capital shares with respect to the payment of dividends and repayment of capital upon the winding up of the Company. The final formula to calculate the termination payment is as follows: Each Class I Preferred share will be valued at the lesser of (i) $20; and (ii) the Net Assets per unit for the Company on the termination date. Each Class II Preferred share will be valued at the amount, if any, of the difference between the Net Assets per unit of the Company and $20 (the original issue price of the Class I Preferred shares) subject to a maximum value of $15 per share. As such, if the net asset value per unit remains below $20 per unit on termination date, this would mean that each Class II Preferred share would receive no payment. Capital shares will receive no payment unless the unit value was in excess of $35 per unit at termination date. The net asset value per unit as at November 30, 2011 was $17.74. Any retractions received under the January 2012 monthly retraction privilege will be calculated in the same manner as the final termination amount for each class of share.

Class I Preferred shareholders have received total dividends of $14.90 per share since inception. The final quarterly dividend of $0.275 to Class I Preferred shareholders will be made on January 31, 2012. Class II Preferred shareholders have received total dividends of $10.54 per share since inception. Any quarterly Class II Preferred share dividends suspended since July 2008 cannot be declared or made payable if the net asset value is below $20 per unit due to the priority ranking of the Class I Preferred shares. Capital shares have received total dividends of $7.25 per share since inception. Overall, a total of $32.69 per unit in distributions was made since inception.

The Manager will begin liquidating the portfolio during the latter half of January 2012 in preparation for the final redemption. A final net asset value will be calculated as at January 31, 2012 and will be used to determine the final redemption prices.

Payment of the redemption prices as applicable are expected to be made no later than February 16, 2012 and will be paid to the beneficial holders of such shares through payment to the CDS participant through which such shares are held.

The Company anticipates that trading in all three classes of shares on the Toronto Stock Exchange will be halted at the opening of trading on February 1, 2012 and that such shares would then be de-listed from the Exchange effective the close of trading on that date. Once all necessary tax clearance certificates are obtained and other corporate formalities observed, it is expected that the Company will then be dissolved.

So in a nutshell, YLD.PR.A gets the first $20, YLD.PR.B gets the next $15 and YLD gets the balance. Trouble is the NAV is currently only 17.74.

YLD.PR.A and YLD.PR.B have both been tracked by HIMIPref™, but have been relegated to the Scraps index on credit concerns. Tracking of YLD.PR.B will cease immediately, but tracking of YLD.PR.A is expected to continue until redemption. YLD.PR.A and YLD.PR.B were last discussed on PrefBlog in connection with the 09H1 Financial Statements.

If we look at the January 2011 Annual Report, we can get a good feel for how this happened:

YLD Unit Performance to 2011-1-31
Measure One
Year
Three
Years
Five
Years
Ten
Years
Total Fund +11.50% -2.89% -1.74% -0.73%
S&P/TSX 60
(Can)
+23.23% +3.11% +5.55% +5.75%
S&P 100
(US)
+12.53% -0.97% -0.23% -3.98%

December 5, 2011

December 6th, 2011

Barclays is buying back some Tier 1 Capital:

Barclays Plc (BARC), the U.K.’s second- largest bank by assets, offered to buy back as much as 2.5 billion pounds ($3.9 billion) of capital notes to improve the quality of the capital it holds.

The lender will offer to buy back the Tier 1 securities for a discount of as much as 30 percent to face value, London-based Barclays said in a statement today.

The “offers will enable the issuer to enhance further the quality of its capital structure through the reduction of non- Basel III compliant tier one capital and subsequent generation of additional core tier one capital,” Barclays said in the statement.

There may be a mass downgrade of Europe brewing:

Standard & Poor’s said Germany and France may be stripped of their AAA credit ratings as the debt crisis prompts 15 euro nations to be put on review for possible downgrade.

The euro area’s six AAA rated countries are among the nations to be placed on a negative outlook, and their credit ratings may be cut depending on the result of a summit of European Union leaders on Dec. 9, S&P said today in a statement. The euro reversed its gains and U.S. Treasuries rose earlier today after the Financial Times reported that the credit-ranking firm planned to reduce six AAA outlooks.

“Systemic stress in the eurozone has risen in recent weeks and reached such a level that a review of all eurozone sovereign ratings is warranted,” S&P said in a statement.

The firm said that ratings could be cut by one level for Austria, Belgium, Finland, Germany, Netherlands and Luxembourg, and by up to two notches for the other governments. The euro pared gains against the dollar, trading at $1.3401 per euro at 5:01 p.m. in New York after rising as high as $1.3487.

S&P said it maintained the negative outlook for Cyprus, and Greece wasn’t put on “creditwatch.”

Even Japan’s getting a little desperate:

Japanese Finance Minister Jun Azumi will be rewarding investors who buy more than 10 million yen ($129,000) in reconstruction bonds with gold in the government’s latest attempt to bolster demand for the debt.

Individual investors who hold the bonds for three years will be eligible for a gold commemorative coin valued at 10,000 yen, the Finance Ministry said in Tokyo today. At 15.6 grams, (0.55 ounces), it would be worth about $948 based on prices for the precious metal. Only a limited number of coins will be issued, the Finance Ministry said in a statement.

DBRS confirmed BPP at Pfd-3:

DBRS has today confirmed the Issuer Rating of Brookfield Office Properties Canada (BOPC or the Trust) at BBB with a Stable trend. DBRS has also confirmed the Issuer Rating of BPO Properties Ltd. (BPO or the Company) at BBB and its Cumulative Redeemable Preferred Shares ratings at Pfd-3. The trends are Stable.

The confirmations follow BOPC’s announcement of the acquisition of the Canadian Office Fund portfolio (the Acquisition) from BPO for approximately $362 million, including assumed mortgages totaling approximately $140 million. DBRS expects BOPC to fund the balance of the Acquisition primarily with cash on hand and a drawdown on the Trust’s revolving credit facility. The Acquisition includes an undivided 25% interest in nine Class AA and Class A office properties, including such high-quality office properties as First Canadian Place in downtown Toronto and Jean Edmonds Towers, Place de Ville I and Place de Ville II in Ottawa.

The financial impact of the Acquisition is expected to result in BOPC’s leverage increasing to approximately 44.7% (debt-to-capital ratio based on fair value) from 42.0%, while EBITDA interest coverage is expected to improve to 2.50 times, which DBRS considers appropriate for the current rating category

The confirmation of BPO’s ratings reflects its 83.3% equity interest in BOPC and strong ownership by Brookfield Office Properties, Inc.

BPP has three issues of shares outstanding: BPP.PR.G (1.8-million shares); BPP.PR.J (3.8-million) and BPP.PR.M (2.8-million). These are the Amazing Shares That Would Not Die, having been issued by Royal Trustco in 1985, 1986 and 1986, respectively, and changing their name from Gentra to BPO Properties effective 2001-5-7, following a name change from Royal Trustco 1993-6-18.

It was an uneventful day for the Canadian preferred share market, with PerpetualDiscounts down 6bp, FixedResets off 2bp and DeemedRetractibles gaining 9bp. Volatility was muted, but positive. Volume was above average.

HIMIPref™ Preferred Indices
These values reflect the December 2008 revision of the HIMIPref™ Indices

Values are provisional and are finalized monthly
Index Mean
Current
Yield
(at bid)
Median
YTW
Median
Average
Trading
Value
Median
Mod Dur
(YTW)
Issues Day’s Perf. Index Value
Ratchet 0.00 % 0.00 % 0 0.00 0 0.9390 % 2,079.9
FixedFloater 4.95 % 4.70 % 33,968 17.00 1 -0.9794 % 3,116.2
Floater 3.19 % 3.53 % 65,447 18.39 3 0.9390 % 2,245.7
OpRet 4.89 % 1.01 % 56,868 1.44 6 0.2179 % 2,478.9
SplitShare 5.85 % 6.73 % 59,008 5.12 3 0.0427 % 2,510.7
Interest-Bearing 0.00 % 0.00 % 0 0.00 0 0.2179 % 2,266.7
Perpetual-Premium 5.52 % 2.75 % 96,513 0.87 18 0.0762 % 2,158.6
Perpetual-Discount 5.25 % 5.18 % 108,323 14.99 12 -0.0554 % 2,301.8
FixedReset 5.12 % 3.09 % 232,078 2.44 63 -0.0232 % 2,337.0
Deemed-Retractible 5.05 % 4.45 % 192,568 3.82 46 0.0900 % 2,222.5
Performance Highlights
Issue Index Change Notes
MFC.PR.A OpRet 1.24 % YTW SCENARIO
Maturity Type : Soft Maturity
Maturity Date : 2015-12-18
Maturity Price : 25.00
Evaluated at bid price : 25.32
Bid-YTW : 3.73 %
MFC.PR.B Deemed-Retractible 1.57 % YTW SCENARIO
Maturity Type : Hard Maturity
Maturity Date : 2022-01-31
Maturity Price : 25.00
Evaluated at bid price : 21.99
Bid-YTW : 6.28 %
PWF.PR.A Floater 2.58 % YTW SCENARIO
Maturity Type : Limit Maturity
Maturity Date : 2041-12-05
Maturity Price : 19.50
Evaluated at bid price : 19.50
Bid-YTW : 2.71 %
Volume Highlights
Issue Index Shares
Traded
Notes
RY.PR.I FixedReset 93,781 TD crossed 50,000 at 26.05; RBC crossed 20,000 at the same price.
YTW SCENARIO
Maturity Type : Call
Maturity Date : 2014-02-24
Maturity Price : 25.00
Evaluated at bid price : 26.05
Bid-YTW : 3.12 %
TD.PR.K FixedReset 61,671 Scotia crossed 52,500 at 27.30.
YTW SCENARIO
Maturity Type : Call
Maturity Date : 2014-07-31
Maturity Price : 25.00
Evaluated at bid price : 27.25
Bid-YTW : 2.96 %
BNS.PR.Q FixedReset 60,076 Desjardins crossed blocks of 13,900 and 10,000, both at 25.90. TD crossed 14,800 at the same price.
YTW SCENARIO
Maturity Type : Hard Maturity
Maturity Date : 2022-01-31
Maturity Price : 25.00
Evaluated at bid price : 25.88
Bid-YTW : 3.12 %
MFC.PR.D FixedReset 58,912 RBC crossed 49,000 at 26.49.
YTW SCENARIO
Maturity Type : Call
Maturity Date : 2014-06-19
Maturity Price : 25.00
Evaluated at bid price : 26.41
Bid-YTW : 4.17 %
FTS.PR.C OpRet 58,304 TD bought blocks of 10,000 and 36,900 from anonymous at 25.68.
YTW SCENARIO
Maturity Type : Call
Maturity Date : 2012-01-04
Maturity Price : 25.50
Evaluated at bid price : 25.68
Bid-YTW : -2.51 %
ENB.PR.D FixedReset 56,414 Recent new issue.
YTW SCENARIO
Maturity Type : Limit Maturity
Maturity Date : 2041-12-05
Maturity Price : 23.14
Evaluated at bid price : 25.11
Bid-YTW : 3.67 %
There were 38 other index-included issues trading in excess of 10,000 shares.
Wide Spread Highlights
Issue Index Quote Data and Yield Notes
NA.PR.M Deemed-Retractible Quote: 26.86 – 27.18
Spot Rate : 0.3200
Average : 0.2054

YTW SCENARIO
Maturity Type : Call
Maturity Date : 2013-05-15
Maturity Price : 26.00
Evaluated at bid price : 26.86
Bid-YTW : 3.63 %

PWF.PR.O Perpetual-Premium Quote: 26.04 – 26.39
Spot Rate : 0.3500
Average : 0.2487

YTW SCENARIO
Maturity Type : Call
Maturity Date : 2018-10-31
Maturity Price : 25.00
Evaluated at bid price : 26.04
Bid-YTW : 5.21 %

NA.PR.P FixedReset Quote: 27.00 – 27.33
Spot Rate : 0.3300
Average : 0.2309

YTW SCENARIO
Maturity Type : Call
Maturity Date : 2014-02-15
Maturity Price : 25.00
Evaluated at bid price : 27.00
Bid-YTW : 3.00 %

TD.PR.I FixedReset Quote: 27.11 – 27.29
Spot Rate : 0.1800
Average : 0.1009

YTW SCENARIO
Maturity Type : Call
Maturity Date : 2014-07-31
Maturity Price : 25.00
Evaluated at bid price : 27.11
Bid-YTW : 3.17 %

ELF.PR.F Perpetual-Discount Quote: 23.15 – 23.45
Spot Rate : 0.3000
Average : 0.2310

YTW SCENARIO
Maturity Type : Limit Maturity
Maturity Date : 2041-12-05
Maturity Price : 22.87
Evaluated at bid price : 23.15
Bid-YTW : 5.80 %

BAM.PR.R FixedReset Quote: 26.30 – 26.64
Spot Rate : 0.3400
Average : 0.2762

YTW SCENARIO
Maturity Type : Limit Maturity
Maturity Date : 2041-12-05
Maturity Price : 23.56
Evaluated at bid price : 26.30
Bid-YTW : 3.73 %

YLO: S&P Downgrades to P-4(low)

December 5th, 2011

Standard & Poor’s has announced:

  • Deteriorating operating performance, combined with substantially weakened access to capital markets, has materially affected the credit quality of Montreal-based classified directory publisher Yellow Media Inc., in our
    opinion.

  • As a result, we are lowering our long-term corporate credit rating on Yellow Media to ‘BB-‘ from ‘BB+’ and placing the company on CreditWatch with negative implications.
  • At the same time, we are lowering various issue-level ratings on Yellow Media and putting these ratings on CreditWatch, reflecting the downgrade on the company.
  • The CreditWatch listing reflects our concerns about Yellow Media’s
    deteriorating cash flows and weakened access to the capital markets, which have increased the risk associated with the company’s ability to refinance its future debt maturities.


At the same time, we lowered our issue-level rating on the company’s senior unsecured debt to ‘BB-‘ (the same as the corporate credit rating on Yellow Media) from ‘BB+’, and revised our recovery rating on the debt to ‘4’ from ‘3’. A ‘4’ recovery rating indicates our expectation for average (30%-50%) recovery in the event of a default.

We also lowered our issue-level rating on Yellow Media’s subordinated debt to ‘B’ (two notches below the corporate credit rating) from ‘BB-‘. The recovery rating on this debt is unchanged at ‘6’, indicating our expectation of negligible (0%-10%) recovery in a default situation.

Finally, we lowered our Canada scale rating on the company’s preferred shares to ‘P-4 (Low)’ from ‘P-4 (High)’. All of the issue level ratings have been placed on CreditWatch negative, reflecting the downgrade on the company.

“The downgrade and CreditWatch listing reflect our concerns about a further deterioration in operating performance and rising refinancing risks at Yellow Media,” said Standard & Poor’s credit analyst Madhav Hari. “Specifically, we now believe that print declines will accelerate beyond our low-to-mid teens percent expectations and that the company will be challenged to increase its online revenue at the levels we had imputed in our previous assumptions,” Mr. Hari added.

As such, erosion of overall revenue could be steeper in the near term while visibility for the timing of revenue stabilization or turnaround is very poor. More important, given print acceleration and the greater degree of investment needed to even sustain a lower pace of online growth, we now believe operating margins could prove to be below our previous expectations of about 50%. Consequently, we expect discretionary operating cash flow to weaken, which would limit the company’s financial flexibility. Given significant uncertainty with regard to the company’s ability to renew or extend its bank facilities beyond February 2013, and arguably poor access to the capital markets (as evidenced by pricing of the company’s equity and debt securities), we believe refinancing risks associated with the company’s future debt maturities, including the C$255 million medium-term notes due 2013, has increased meaningfully.

YLO has four issues of preferreds outstanding: YLO.PR.A & YLO.PR.B (OperatingRetractible) and YLO.PR.C & YLO.PR.D (FixedReset).

These issues were last mentioned on PrefBlog when I published a transcript of the 11Q3 Conference Call. All issues are tracked by HIMIPref™; all are relegated to the Scraps index on credit concerns.

New Issue: TLM FixedReset 4.20%+277

December 5th, 2011

Talisman Energy has announced:

that it has agreed to issue to a syndicate of underwriters led by RBC Capital Markets and CIBC for distribution to the public 8,000,000 Cumulative Redeemable Rate Reset First Preferred Shares, Series 1 (the “Series 1 Preferred Shares”). The Series 1 Preferred Shares will be issued at a price of $25.00 per Series 1 Preferred Share, for aggregate gross proceeds of $200 million. Holders of the Series 1 Preferred Shares will be entitled to receive a cumulative quarterly fixed dividend at an annual rate of 4.20% for the initial period ending December 31, 2016. Thereafter, the dividend rate will be reset every five years at a rate equal to the 5-year Government of Canada bond yield plus 2.77%.

Holders of Series 1 Preferred Shares will have the right, at their option, to convert their shares into Cumulative Redeemable Rate Reset First Preferred Shares, Series 2 (the “Series 2 Preferred Shares”), subject to certain conditions, on December 31, 2016 and on December 31 every five years thereafter. Holders of the Series 2 Preferred Shares will be entitled to receive cumulative quarterly floating dividends at a rate equal to the three-month Government of Canada Treasury Bill yield plus 2.77%.

Talisman has granted the Underwriters an option, exercisable in whole or in part prior to closing, to purchase up to an additional 2,000,000 Series 1 Preferred Shares at the same offering price.

The net proceeds from this offering will be used to contribute to funding capital projects, reducing indebtedness and for general corporate purposes, as the need may arise and as management may consider appropriate at the time. The offering is expected to close on or about December 13, 2011.

The Series 1 Preferred Shares will be offered only in Canada by way of prospectus supplement to the short form base shelf prospectus of Talisman dated March 22, 2010.

As has often been the case in the past year, I am pleased to see a new issuer coming to market, but annoyed that it is another junk FixedReset! It’s interesting to see that their cost of funds is lower than last week’s MFC 4.40%+290 announcement.

Update, 2011-12-7: DBRS rates it as Pfd-3(high).

MAPF Performance: November 2011

December 4th, 2011

The fund underperformed in November, largely due to a steep decline in the prices of SLF issues, which form a significant part of the fund’s holdings.

The fund’s Net Asset Value per Unit as of the close November 30 was $10.4511.

Returns to November 30, 2011
Period MAPF Index CPD
according to
Claymore
One Month -0.39% +0.41% +0.11%
Three Months -4.87% +0.72% +0.10%
One Year +0.56% +6.19% +3.81%
Two Years (annualized) +9.17% +9.21% N/A
Three Years (annualized) +31.70% +17.22% +14.37%
Four Years (annualized) +18.34% +6.23%  
Five Years (annualized) +13.26% +3.54%  
Six Years (annualized) +12.12% +3.68%  
Seven Years (annualized) +11.28% +3.84%  
Eight Years (annualized) +11.73% +4.11%  
Nine Years (annualized) +13.68% +4.50%  
Ten Years (annualized) +12.05% +4.31%  
The Index is the BMO-CM “50”
MAPF returns assume reinvestment of distributions, and are shown after expenses but before fees.
CPD Returns are for the NAV and are after all fees and expenses.
* CPD does not directly report its two-year returns.
Figures for Omega Preferred Equity (which are after all fees and expenses) for 1-, 3- and 12-months are +0.19%, +0.41% and +4.57%, respectively, according to Morningstar after all fees & expenses. Three year performance is +14.91%.
Figures for Jov Leon Frazer Preferred Equity Fund Class I Units (which are after all fees and expenses) for 1-, 3- and 12-months are +0.32%, +0.46% and ++2.22% respectively, according to Morningstar
Figures for Manulife Preferred Income Fund (formerly AIC Preferred Income Fund) (which are after all fees and expenses) for 1-, 3- and 12-months are +0.17%, +0.28% & +3.53%, respectively
Figures for Horizons AlphaPro Preferred Share ETF (which are after all fees and expenses) for 1-, 3- and 12-months are +0.29%, +0.57% & +4.64%, respectively.

MAPF returns assume reinvestment of dividends, and are shown after expenses but before fees. Past performance is not a guarantee of future performance. You can lose money investing in Malachite Aggressive Preferred Fund or any other fund. For more information, see the fund’s main page. The fund is available either directly from Hymas Investment Management or through a brokerage account at Odlum Brown Limited.

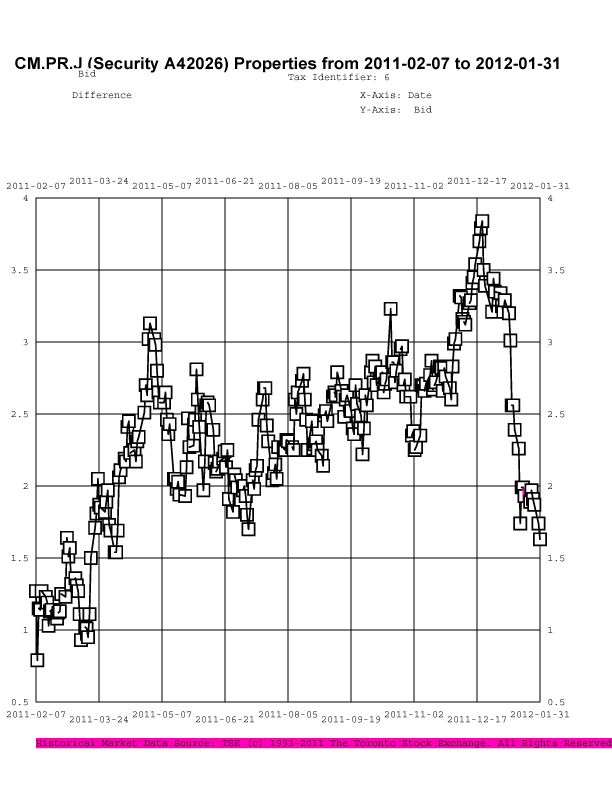
The fund’s returns in November were hurt by a steep decline in the price of SLF preferreds, which have been afflicted in recent months by relatively poor financial results and bouts of selling (see Who’s Selling all the SLF Preferreds? and Moody’s puts SLF on Review-Negative).

For example, the difference in the YTWs of GWO.PR.I and SLF.PR.E (which have the same annual dividend of 1.125) are shown below since the OSFI announcement that extant issues without the NVCC clause would not be grandfathered (note that this announcement applied only to banks; there is still no official word on the status of preferreds issued by insurance holding companies, although I continue to expect that the bank rules will eventually apply).


Click for Big

Similarly, we can look at the difference in prices between the two issues:


Click for Big

The charts Yield Difference and Bid Price Difference are available in PDF format.

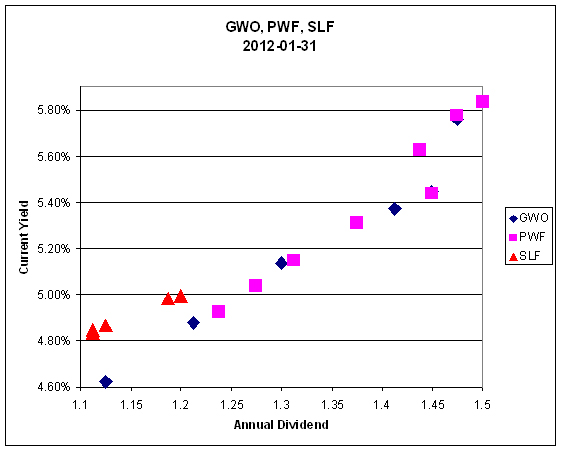
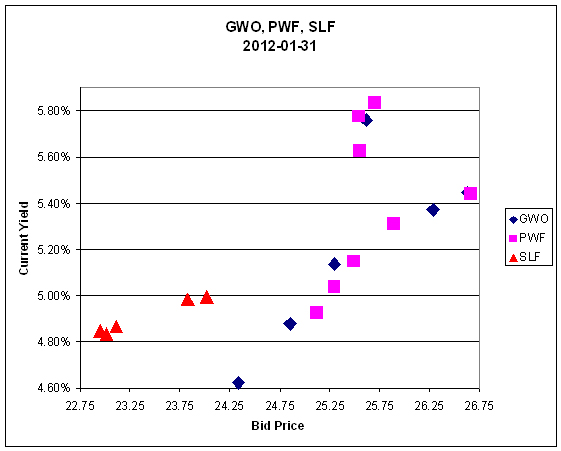
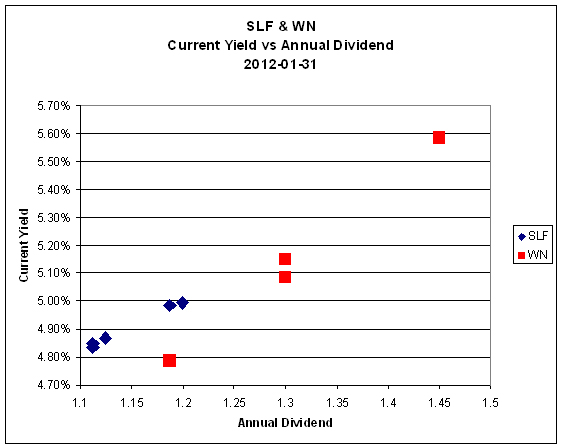
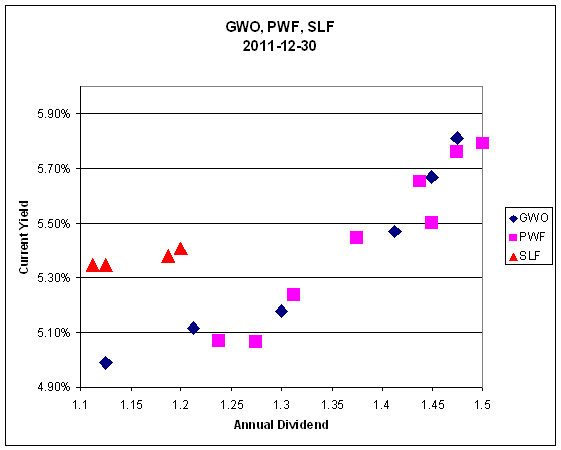
Another way to look at the situation is compare the SLF issues with PWF and GWO, as was done in the post Who’s Selling All the SLF Preferred?.


Click for Big

Click for Big

Now, I certainly agree that GWO is a better credit than SLF and deserves a little bit of premium pricing – but the current situation goes far beyond what I consider reasonable. What is also very interesting is the observation that the market is sharply differentiating between SLF and GWO, but not between GWO and its unregulated parent, PWF.

Sometimes everything works … sometimes the trading works, but sectoral shifts overwhelm the increment … sometimes nothing works. The fund seeks to earn incremental return by selling liquidity (that is, taking the other side of trades that other market participants are strongly motivated to execute), which can also be referred to as ‘trading noise’. There were a lot of strongly motivated market participants during the Panic of 2007, generating a lot of noise! Unfortunately, the conditions of the Panic may never be repeated in my lifetime … but the fund will simply attempt to make trades when swaps seem profitable, without worrying about the level of monthly turnover.

There’s plenty of room for new money left in the fund. I have shown in recent issues of PrefLetter that market pricing for FixedResets is demonstrably stupid and I have lots of confidence – backed up by my bond portfolio management experience in the markets for Canadas and Treasuries, and equity trading on the NYSE & TSX – that there is enough demand for liquidity in any market to make the effort of providing it worthwhile (although the definition of “worthwhile” in terms of basis points of outperformance changes considerably from market to market!) I will continue to exert utmost efforts to outperform but it should be borne in mind that there will almost inevitably be periods of underperformance in the future.

The yields available on high quality preferred shares remain elevated, which is reflected in the current estimate of sustainable income.

Calculation of MAPF Sustainable Income Per Unit
Month NAVPU Portfolio
Average
YTW
Leverage
Divisor
Securities
Average
YTW
Capital
Gains
Multiplier
Sustainable
Income
per
current
Unit
June, 2007 9.3114 5.16% 1.03 5.01% 1.2857 0.3628
September 9.1489 5.35% 0.98 5.46% 1.2857 0.3885
December, 2007 9.0070 5.53% 0.942 5.87% 1.2857 0.4112
March, 2008 8.8512 6.17% 1.047 5.89% 1.2857 0.4672
June 8.3419 6.034% 0.952 6.338% 1.2857 $0.4112
September 8.1886 7.108% 0.969 7.335% 1.2857 $0.4672
December, 2008 8.0464 9.24% 1.008 9.166% 1.2857 $0.5737
March 2009 $8.8317 8.60% 0.995 8.802% 1.2857 $0.6046
June 10.9846 7.05% 0.999 7.057% 1.2857 $0.6029
September 12.3462 6.03% 0.998 6.042% 1.2857 $0.5802
December 2009 10.5662 5.74% 0.981 5.851% 1.0819 $0.5714
March 2010 10.2497 6.03% 0.992 6.079% 1.0819 $0.5759
June 10.5770 5.96% 0.996 5.984% 1.0819 $0.5850
September 11.3901 5.43% 0.980 5.540% 1.0819 $0.5832
December 2010 10.7659 5.37% 0.993 5.408% 1.0000 $0.5822
March, 2011 11.0560 6.00% 0.994 5.964% 1.0000 $0.6594
June 11.1194 5.87% 1.018 5.976% 1.0000 $0.6645
September 10.2709 6.10%
Note
1.001 6.106% 1.0000 $0.6271
November, 2011 10.4511 6.02%
Note
1.004 6.044% 1.0000 $0.6317
NAVPU is shown after quarterly distributions of dividend income and annual distribution of capital gains.
Portfolio YTW includes cash (or margin borrowing), with an assumed interest rate of 0.00%
The Leverage Divisor indicates the level of cash in the account: if the portfolio is 1% in cash, the Leverage Divisor will be 0.99
Securities YTW divides “Portfolio YTW” by the “Leverage Divisor” to show the average YTW on the securities held; this assumes that the cash is invested in (or raised from) all securities held, in proportion to their holdings.
The Capital Gains Multiplier adjusts for the effects of Capital Gains Dividends. On 2009-12-31, there was a capital gains distribution of $1.989262 which is assumed for this purpose to have been reinvested at the final price of $10.5662. Thus, a holder of one unit pre-distribution would have held 1.1883 units post-distribution; the CG Multiplier reflects this to make the time-series comparable. Note that Dividend Distributions are not assumed to be reinvested.
Sustainable Income is the resultant estimate of the fund’s dividend income per current unit, before fees and expenses. Note that a “current unit” includes reinvestment of prior capital gains; a unitholder would have had the calculated sustainable income with only, say, 0.9 units in the past which, with reinvestment of capital gains, would become 1.0 current units.
DeemedRetractibles are comprised of all Straight Perpetuals (both PerpetualDiscount and PerpetualPremium) issued by BMO, BNS, CM, ELF, GWO, HSB, IAG, MFC, NA, RY, SLF and TD, which are not exchangable into common at the option of the company (definition refined in May). These issues are analyzed as if their prospectuses included a requirement to redeem at par on or prior to 2022-1-31, in addition to the call schedule explicitly defined. See OSFI Does Not Grandfather Extant Tier 1 Capital, CM.PR.D, CM.PR.E, CM.PR.G: Seeking NVCC Status and the January, February, March and June, 2011, editions of PrefLetter for the rationale behind this analysis.
Yields for September, 2011, to November, 2011, were calculated by imposing a cap of 10% on the yields of YLO issues held, in order to avoid their extremely high calculated yields distorting the calculation and to reflect the uncertainty in the marketplace that these yields will be realized.

Significant positions were held in DeemedRetractible and FixedReset issues on November 30; all of the former and most of the latter currently have their yields calculated with the presumption that they will be called by the issuers at par prior to 2022-1-31. This presents another complication in the calculation of sustainable yield. The fund also holds a position in a SplitShare (BNA.PR.C) and an OperatingRetractible Scrap (YLO.PR.B) which also have their yields calculated with the expectation of a maturity at par, a somewhat dubious assumption in the latter case.

However, if the entire portfolio except for the PerpetualDiscounts were to be sold and reinvested in these issues, the yield of the portfolio would be the 5.79% shown in the MAPF Portfolio Composition: November 2011 analysis (which is greater than the 5.32% index yield on November 30). Given such reinvestment, the sustainable yield would be $10.4511 * 0.0579 = $0.6051, down from the $10.4924 * 0.0598 = $0.6274 reported for October, but an increase from the $10.2709 * 0.0584 = $0.5998 reported in September.

Different assumptions lead to different results from the calculation, but the overall positive trend is apparent. I’m very pleased with the results! It will be noted that if there was no trading in the portfolio, one would expect the sustainable yield to be constant (before fees and expenses). The success of the fund’s trading is showing up in

  • the very good performance against the index
  • the long term increases in sustainable income per unit

As has been noted, the fund has maintained a credit quality equal to or better than the index; outperformance is due to constant exploitation of trading anomalies.

Again, there are no predictions for the future! The fund will continue to trade between issues in an attempt to exploit market gaps in liquidity, in an effort to outperform the index and keep the sustainable income per unit – however calculated! – growing.
MAPF Portfolio Composition: November, 2011

December 4th, 2011

Turnover remained low in November, at about 2%.

Sectoral distribution of the MAPF portfolio on November 30 was as follows:

MAPF Sectoral Analysis 2011-11-30
HIMI Indices Sector Weighting YTW ModDur
Ratchet 0% N/A N/A
FixFloat 0% N/A N/A
Floater 0% N/A N/A
OpRet 0% N/A N/A
SplitShare 9.8% (0) 6.94% 5.96
Interest Rearing 0% N/A N/A
PerpetualPremium 0.0% (0) N/A N/A
PerpetualDiscount 9.1% (-1.5) 5.79% 14.15
Fixed-Reset 11.9% (+1.5) 3.09% 2.80
Deemed-Retractible 59.1% (-0.6) 6.23% 7.79
Scraps (Various) 9.7% (+0.3) 7.87% (see note) 9.01 (see note)
Cash +0.4% (+0.3) 0.00% 0.00
Total 100% 6.02% 7.68
Yields for the YLO preferreds have been set at 10% for calculation purposes, and their durations at 5.00. The extraordinarily low price of these issues has resulted in extremely high calculated yields; I feel that substitution of these values results in a more prudent total indication.
Totals and changes will not add precisely due to rounding. Bracketted figures represent change from October month-end. Cash is included in totals with duration and yield both equal to zero.
DeemedRetractibles are comprised of all Straight Perpetuals (both PerpetualDiscount and PerpetualPremium) issued by BMO, BNS, CM, ELF, GWO, HSB, IAG, MFC, NA, RY, SLF and TD, which are not exchangable into common at the option of the company. These issues are analyzed as if their prospectuses included a requirement to redeem at par on or prior to 2022-1-31, in addition to the call schedule explicitly defined. See OSFI Does Not Grandfather Extant Tier 1 Capital, CM.PR.D, CM.PR.E, CM.PR.G: NVCC Status Confirmed and the January, February, March and June, 2011, editions of PrefLetter for the rationale behind this analysis.

The “total” reflects the un-leveraged total portfolio (i.e., cash is included in the portfolio calculations and is deemed to have a duration and yield of 0.00.). MAPF will often have relatively large cash balances, both credit and debit, to facilitate trading. Figures presented in the table have been rounded to the indicated precision.

Credit distribution is:

MAPF Credit Analysis 2011-11-30
DBRS Rating Weighting
Pfd-1 0 (0)
Pfd-1(low) 47.4% (-0.2)
Pfd-2(high) 22.6% (+1.2)
Pfd-2 0 (0)
Pfd-2(low) 20.0% (-1.5)
Pfd-3(high) 2.7% (+0.3)
Pfd-3 2.0% (-1.7)
Pfd-4 2.5% (+2.5)
Pfd-4(low) 2.5% (-1.2)
Cash +0.4% (+0.3)
Totals will not add precisely due to rounding. Bracketted figures represent change from October month-end.
A position held in ELF preferreds has been assigned to Pfd-2(low)
A position held in CSE preferreds has been assigned to Pfd-3

Liquidity Distribution is:

MAPF Liquidity Analysis 2011-11-30
Average Daily Trading Weighting
<$50,000 5.3% (0)
$50,000 – $100,000 19.5% (-1.2)
$100,000 – $200,000 29.0% (+5.4)
$200,000 – $300,000 41.8% (+10.9)
>$300,000 4.0% (-15.4)
Cash +0.4% (+0.3)
Totals will not add precisely due to rounding. Bracketted figures represent change from Octoberber month-end.

MAPF is, of course, Malachite Aggressive Preferred Fund, a “unit trust” managed by Hymas Investment Management Inc. Further information and links to performance, audited financials and subscription information are available the fund’s web page. The fund may be purchased either directly from Hymas Investment Management or through a brokerage account at Odlum Brown Limited. A “unit trust” is like a regular mutual fund, but is sold by offering memorandum rather than prospectus. This is cheaper, but means subscription is restricted to “accredited investors” (as defined by the Ontario Securities Commission) or those who subscribe for $150,000+. Fund past performances are not a guarantee of future performance. You can lose money investing in MAPF or any other fund.

A similar portfolio composition analysis has been performed on the Claymore Preferred Share ETF (symbol CPD) as of August 31, 2011, and published in the October, 2011, PrefLetter. While direct comparisons are difficult due to the introduction of the DeemedRetractible class of preferred share (see above) it is fair to say:

  • MAPF credit quality is better
  • MAPF liquidity is a higher
  • MAPF Yield is higher
  • Weightings in
    • MAPF is much more exposed to DeemedRetractibles
    • MAPF is much less exposed to Operating Retractibles
    • MAPF is much more exposed to SplitShares
    • MAPF is less exposed to FixFloat / Floater / Ratchet
    • MAPF weighting in FixedResets is much lower

December 2, 2011

December 3rd, 2011

There was a decent US jobs number:

Treasuries pared losses after the U.S. jobless rate unexpectedly fell to 8.6 percent as the workforce shrank, indicating moderate economic growth.

U.S. debt extended the first weekly loss in three weeks as employers added 120,000 jobs in November after an increase of 100,000 positions in the previous month, the Labor Department reported today in Washington. A European proposal to channel central-bank loans through the International Monetary Fund may deliver as much as 200 billion euros ($270 billion) to fight the debt crisis, two people familiar with the negotiations said.

There is some hope that the increase is understated:

American households may be signaling the job market is stronger than the payroll numbers indicate.

Employers said they took on 120,000 workers in November, bringing job gains over the past four months to 534,000, Labor Department data showed today in Washington. A separate survey of households showed 278,000 more people were employed last month, pushing the increase during the same period to 1.28 million.

At turning points in the economy, the latter may prove more accurate because it’s more likely to pick up hiring at small companies and new firms that may be under the government’s radar. In another sign of recovery, the payroll figures the last three reports have been revised up by a combined 91,000 on average for the prior two months.

Rotman B-School is discussing the Coventree decision:

Monday, December 19, 2011
Capital Markets Institute @ Rotman Roundtable Discussion

3:00pm to 5:00pm Roundtable Discussion
TOPIC: Disclosure and Materiality: The Coventree Decision
SYNOPSIS: In looking at the Coventree Decision by the OSC our panelists will go through the following questions:
What is materiality? What is a material change? When to disclose? Risks of disclosing too early OR too late; insights from the Coventree decision, securities law, issuers and investors; What does the Coventree decision signal regarding disclosure going forward?
PANELISTS:
Jeremy Fraiberg, Partner, Osler, Hoskin & Harcourt LLP
Paul Halpern, Director, Capital Markets Institute, Professor Emeritus of Finance, Rotman School of Management
Christopher C. Nicholls, Stephen Dattels Chair in Corporate Finance Law at the University of Western Ontario
Sean Vanderpol, Partner, Stikeman Elliott
G. Wesley Voorheis, Partner, Voorheis & Co. LLP and member of the Special Committee established by the Coventree Board of Directors
PLACE: Rotman School (South) Room 209 – 149 College Street, Toronto (ON)
TO REGISTER: www.rotman.utoronto.ca/cmi-dec19
QUESTIONS: 416.978.5654 or email Kathleen.Coulson@Rotman.Utoronto.Ca

Greece is engaged in talkes regarding how to default without defaulting. No doubt they are hoping that Pythagorus will come back to square the circle:

Greece and its private creditors are involved in “complicated” negotiations on a debt-swap agreement and scenarios coming to light shouldn’t be seen as indicative of the final result, said Prime Minister Lucas Papademos.

“Each side has its strategies and has starting positions,” Papademos said today in comments to lawmakers televised live on Vouli TV. “Greece’s national interest is our basic goal and the basis supporting our position. That’s self- evident and a given.”

Greece’s 206 billion euros of privately held debt would be reduced by 50 percent under an agreement announced at an Oct. 26 summit of European leaders in Brussels. The accord didn’t resolve details of the swap, such as the reduction in net present value investors would face.

Greece and its private creditors are in disagreement over the interest rate on new bonds and how 30 billion euros intended to sweeten the deal will be used, said a person who is on the lenders’ negotiating committee. Greece is pushing for a coupon of 4.5 percent on new 20-year to 30-year bonds, while the banks are seeking a rate of 7 percent to 8 percent, said the person, who declined to be identified because the discussions are private.

The TMX DataLinx service has collywobbles again, so today’s data have been prepared using unofficial data from Yahoo!

It was a good day for the Canadian preferred share market, with PerpetualDiscounts winning 29bp, FixedResets up 3bp and DeemedRetractibles gaining 17bp. Volatility was reasonable. Volume was average.

HIMIPref™ Preferred Indices
These values reflect the December 2008 revision of the HIMIPref™ Indices

Values are provisional and are finalized monthly
Index Mean
Current
Yield
(at bid)
Median
YTW
Median
Average
Trading
Value
Median
Mod Dur
(YTW)
Issues Day’s Perf. Index Value
Ratchet 0.00 % 0.00 % 0 0.00 0 -1.3690 % 2,060.5
FixedFloater 4.90 % 4.63 % 31,463 17.08 1 0.4661 % 3,147.0
Floater 3.21 % 3.53 % 65,776 18.38 3 -1.3690 % 2,224.8
OpRet 4.90 % 1.01 % 52,664 1.45 6 -0.1408 % 2,473.5
SplitShare 5.85 % 6.67 % 57,976 5.13 3 0.1567 % 2,509.6
Interest-Bearing 0.00 % 0.00 % 0 0.00 0 -0.1408 % 2,261.8
Perpetual-Premium 5.53 % 3.20 % 99,167 1.07 18 0.0839 % 2,156.9
Perpetual-Discount 5.25 % 5.19 % 107,797 15.05 12 0.2880 % 2,303.0
FixedReset 5.12 % 3.05 % 222,946 2.45 63 0.0287 % 2,337.6
Deemed-Retractible 5.05 % 4.47 % 192,694 3.83 46 0.1732 % 2,220.5
Performance Highlights
Issue Index Change Notes
BAM.PR.B Floater -2.78 % YTW SCENARIO
Maturity Type : Limit Maturity
Maturity Date : 2041-12-02
Maturity Price : 15.02
Evaluated at bid price : 15.02
Bid-YTW : 3.53 %
BAM.PR.K Floater -1.71 % YTW SCENARIO
Maturity Type : Limit Maturity
Maturity Date : 2041-12-02
Maturity Price : 14.96
Evaluated at bid price : 14.96
Bid-YTW : 3.55 %
HSB.PR.C Deemed-Retractible -1.06 % YTW SCENARIO
Maturity Type : Hard Maturity
Maturity Date : 2022-01-31
Maturity Price : 25.00
Evaluated at bid price : 25.18
Bid-YTW : 5.15 %
TD.PR.Q Deemed-Retractible 1.28 % YTW SCENARIO
Maturity Type : Call
Maturity Date : 2013-01-31
Maturity Price : 26.00
Evaluated at bid price : 26.97
Bid-YTW : 2.53 %
CIU.PR.A Perpetual-Discount 1.37 % YTW SCENARIO
Maturity Type : Limit Maturity
Maturity Date : 2041-12-02
Maturity Price : 23.95
Evaluated at bid price : 24.45
Bid-YTW : 4.70 %
Volume Highlights
Issue Index Shares
Traded
Notes
ENB.PR.D FixedReset 173,843 Recent new issue.
YTW SCENARIO
Maturity Type : Limit Maturity
Maturity Date : 2041-12-02
Maturity Price : 23.15
Evaluated at bid price : 25.15
Bid-YTW : 3.73 %
BAM.PR.Z FixedReset 66,648 Recent new issue.
YTW SCENARIO
Maturity Type : Limit Maturity
Maturity Date : 2041-12-02
Maturity Price : 23.17
Evaluated at bid price : 25.20
Bid-YTW : 4.41 %
BNS.PR.T FixedReset 55,325 Desjardins crossed 20,000 at 27.10; TD crossed 24,700 at the same price.
YTW SCENARIO
Maturity Type : Call
Maturity Date : 2014-04-25
Maturity Price : 25.00
Evaluated at bid price : 27.08
Bid-YTW : 2.88 %
TD.PR.I FixedReset 42,754 Scotia crossed 25,000 at 27.25.
YTW SCENARIO
Maturity Type : Call
Maturity Date : 2014-07-31
Maturity Price : 25.00
Evaluated at bid price : 27.28
Bid-YTW : 2.90 %
SLF.PR.I FixedReset 37,948 Recent new issue.
YTW SCENARIO
Maturity Type : Hard Maturity
Maturity Date : 2022-12-31
Maturity Price : 25.00
Evaluated at bid price : 24.08
Bid-YTW : 4.70 %
CM.PR.G Perpetual-Discount 37,315 YTW SCENARIO
Maturity Type : Limit Maturity
Maturity Date : 2041-12-02
Maturity Price : 24.74
Evaluated at bid price : 25.06
Bid-YTW : 5.44 %
There were 34 other index-included issues trading in excess of 10,000 shares.
Wide Spread Highlights
Issue Index Quote Data and Yield Notes
MFC.PR.B Deemed-Retractible Quote: 21.65 – 22.09
Spot Rate : 0.4400
Average : 0.2454

YTW SCENARIO
Maturity Type : Hard Maturity
Maturity Date : 2022-01-31
Maturity Price : 25.00
Evaluated at bid price : 21.65
Bid-YTW : 6.48 %

BAM.PR.J OpRet Quote: 26.87 – 27.51
Spot Rate : 0.6400
Average : 0.4543

YTW SCENARIO
Maturity Type : Call
Maturity Date : 2014-03-31
Maturity Price : 26.00
Evaluated at bid price : 26.87
Bid-YTW : 4.11 %

TCA.PR.Y Perpetual-Premium Quote: 52.85 – 53.39
Spot Rate : 0.5400
Average : 0.3963

YTW SCENARIO
Maturity Type : Call
Maturity Date : 2014-03-05
Maturity Price : 50.00
Evaluated at bid price : 52.85
Bid-YTW : 3.20 %

HSB.PR.C Deemed-Retractible Quote: 25.18 – 25.68
Spot Rate : 0.5000
Average : 0.3773

YTW SCENARIO
Maturity Type : Hard Maturity
Maturity Date : 2022-01-31
Maturity Price : 25.00
Evaluated at bid price : 25.18
Bid-YTW : 5.15 %

HSB.PR.E FixedReset Quote: 27.20 – 27.60
Spot Rate : 0.4000
Average : 0.3036

YTW SCENARIO
Maturity Type : Call
Maturity Date : 2014-06-30
Maturity Price : 25.00
Evaluated at bid price : 27.20
Bid-YTW : 3.50 %

BAM.PR.M Perpetual-Discount Quote: 23.32 – 23.66
Spot Rate : 0.3400
Average : 0.2529

YTW SCENARIO
Maturity Type : Limit Maturity
Maturity Date : 2041-12-02
Maturity Price : 22.89
Evaluated at bid price : 23.32
Bid-YTW : 5.16 %

December 1, 2011

December 2nd, 2011

Sorry this is so late, folks!

HIMIPref™ Preferred Indices
These values reflect the December 2008 revision of the HIMIPref™ Indices

Values are provisional and are finalized monthly
Index Mean
Current
Yield
(at bid)
Median
YTW
Median
Average
Trading
Value
Median
Mod Dur
(YTW)
Issues Day’s Perf. Index Value
Ratchet 0.00 % 0.00 % 0 0.00 0 -0.3011 % 2,089.1
FixedFloater 4.92 % 4.66 % 29,261 17.05 1 -1.2781 % 3,132.4
Floater 3.17 % 3.43 % 65,803 18.61 3 -0.3011 % 2,255.7
OpRet 4.90 % 1.00 % 52,320 1.45 6 -0.0895 % 2,477.0
SplitShare 5.86 % 6.67 % 58,609 5.14 3 -0.3690 % 2,505.7
Interest-Bearing 0.00 % 0.00 % 0 0.00 0 -0.0895 % 2,264.9
Perpetual-Premium 5.53 % 3.24 % 99,203 1.77 18 0.0229 % 2,155.1
Perpetual-Discount 5.26 % 5.20 % 109,363 15.05 12 0.1146 % 2,296.4
FixedReset 5.12 % 3.13 % 218,702 2.45 63 -0.0482 % 2,336.9
Deemed-Retractible 5.06 % 4.46 % 192,643 3.84 46 0.0184 % 2,216.7
Performance Highlights
Issue Index Change Notes
IAG.PR.A Deemed-Retractible -1.87 % YTW SCENARIO
Maturity Type : Hard Maturity
Maturity Date : 2022-01-31
Maturity Price : 25.00
Evaluated at bid price : 22.05
Bid-YTW : 6.16 %
SLF.PR.G FixedReset -1.72 % YTW SCENARIO
Maturity Type : Hard Maturity
Maturity Date : 2022-01-31
Maturity Price : 25.00
Evaluated at bid price : 22.80
Bid-YTW : 4.50 %
PWF.PR.M FixedReset -1.50 % YTW SCENARIO
Maturity Type : Call
Maturity Date : 2014-01-31
Maturity Price : 25.00
Evaluated at bid price : 26.20
Bid-YTW : 3.93 %
BAM.PR.G FixedFloater -1.28 % YTW SCENARIO
Maturity Type : Limit Maturity
Maturity Date : 2041-12-01
Maturity Price : 25.00
Evaluated at bid price : 19.31
Bid-YTW : 4.66 %
PWF.PR.A Floater -1.25 % YTW SCENARIO
Maturity Type : Limit Maturity
Maturity Date : 2041-12-01
Maturity Price : 19.00
Evaluated at bid price : 19.00
Bid-YTW : 2.78 %
BNA.PR.D SplitShare -1.18 % YTW SCENARIO
Maturity Type : Hard Maturity
Maturity Date : 2014-07-09
Maturity Price : 25.00
Evaluated at bid price : 26.00
Bid-YTW : 5.58 %
ELF.PR.G Perpetual-Discount 1.15 % YTW SCENARIO
Maturity Type : Limit Maturity
Maturity Date : 2041-12-01
Maturity Price : 21.15
Evaluated at bid price : 21.15
Bid-YTW : 5.70 %
Volume Highlights
Issue Index Shares
Traded
Notes
RY.PR.I FixedReset 260,654 YTW SCENARIO
Maturity Type : Call
Maturity Date : 2014-02-24
Maturity Price : 25.00
Evaluated at bid price : 26.05
Bid-YTW : 3.10 %
MFC.PR.A OpRet 151,710 YTW SCENARIO
Maturity Type : Soft Maturity
Maturity Date : 2015-12-18
Maturity Price : 25.00
Evaluated at bid price : 25.01
Bid-YTW : 4.05 %
BNS.PR.Z FixedReset 130,940 YTW SCENARIO
Maturity Type : Hard Maturity
Maturity Date : 2022-01-31
Maturity Price : 25.00
Evaluated at bid price : 25.00
Bid-YTW : 3.24 %
CM.PR.I Deemed-Retractible 65,773 YTW SCENARIO
Maturity Type : Call
Maturity Date : 2015-01-31
Maturity Price : 25.25
Evaluated at bid price : 25.70
Bid-YTW : 4.20 %
ENB.PR.D FixedReset 56,101 YTW SCENARIO
Maturity Type : Limit Maturity
Maturity Date : 2041-12-01
Maturity Price : 23.14
Evaluated at bid price : 25.13
Bid-YTW : 3.73 %
RY.PR.E Deemed-Retractible 54,008 YTW SCENARIO
Maturity Type : Call
Maturity Date : 2016-02-24
Maturity Price : 25.00
Evaluated at bid price : 25.05
Bid-YTW : 4.49 %
There were 30 other index-included issues trading in excess of 10,000 shares.
Wide Spread Highlights
Issue Index Quote Data and Yield Notes
GWO.PR.L Deemed-Retractible Quote: 25.45 – 25.90
Spot Rate : 0.4500
Average : 0.3082

YTW SCENARIO
Maturity Type : Call
Maturity Date : 2017-12-31
Maturity Price : 25.25
Evaluated at bid price : 25.45
Bid-YTW : 5.39 %

PWF.PR.M FixedReset Quote: 26.20 – 26.59
Spot Rate : 0.3900
Average : 0.2561

YTW SCENARIO
Maturity Type : Call
Maturity Date : 2014-01-31
Maturity Price : 25.00
Evaluated at bid price : 26.20
Bid-YTW : 3.93 %

TD.PR.R Deemed-Retractible Quote: 27.02 – 27.34
Spot Rate : 0.3200
Average : 0.1963

YTW SCENARIO
Maturity Type : Call
Maturity Date : 2013-04-30
Maturity Price : 26.00
Evaluated at bid price : 27.02
Bid-YTW : 2.86 %

PWF.PR.A Floater Quote: 19.00 – 20.48
Spot Rate : 1.4800
Average : 1.3616

YTW SCENARIO
Maturity Type : Limit Maturity
Maturity Date : 2041-12-01
Maturity Price : 19.00
Evaluated at bid price : 19.00
Bid-YTW : 2.78 %

BAM.PR.H OpRet Quote: 25.50 – 25.73
Spot Rate : 0.2300
Average : 0.1455

YTW SCENARIO
Maturity Type : Call
Maturity Date : 2011-12-31
Maturity Price : 25.00
Evaluated at bid price : 25.50
Bid-YTW : -6.44 %

GWO.PR.I Deemed-Retractible Quote: 22.52 – 22.88
Spot Rate : 0.3600
Average : 0.2792

YTW SCENARIO
Maturity Type : Hard Maturity
Maturity Date : 2022-01-31
Maturity Price : 25.00
Evaluated at bid price : 22.52
Bid-YTW : 5.79 %