IFRS on Discounting Rate of Insurance Contracts

August 3rd, 2010

The Globe & Mail published an article today, Insurers cry foul over pending rule changes, highlighting a problem that I’m not sure exists:

A key sticking point is the “discount rate,” or interest rate, that insurers use to calculate the current value of payments that they will have to make to customers in the future.

The rate that Canadian insurers are using basically allows them to take credit now for investment performance that they hope to achieve in the future, the IASB argues. Instead, it says, they should be using a current risk-free rate (essentially measured by the return on government bonds). Since that rate is lower, the Canadian insurers’ liabilities will rise when the change kicks in, and it will be especially painful in areas such as life annuities or whole life non-participating insurance, when the insurers value payments that they owe customers decades from now.

That hasn’t been lost on the IASB. Both Julie Dickson, the head of Canada’s banking and insurance regulator, and Jim Flaherty, the Finance Minister, wrote to the international accounting body earlier this year asking it to consider the impact on the Canadian sector.

To my total lack of surprise, I was unable to find the letters from Dickson or Flaherty published anywhere. So much nicer to do things in private, doncha know.

However, the issue has been bubbling for a while. A presentation by Rubenovitch in April 2008 (about six months before they nearly blew up), Manulife decried:

Asymmetrical accounting for asset and liability and earnings volatility that is not relevant and that will not ultimately be realized

which would result if long-term obligations were to be discounted at the risk-free rate, stating, quite rightly that this:

Assumes liquidity required and overstates liability

The problem is, of course, that government bonds do not simply reflect the “risk free rate”. They also represent the liquidity premium. You cannot get a risk-free rate without also losing the liquidity premium and attempts to disentangle the two aspects of corporate bond pricing came to grief during the Panic of 2007 (see chart 3.16 of the BoE FSR of June 2010 and note the amusing little gap in the x-axis).

But I can’t see that the rules actually require insurers to use government rates as their discounting rate. The relevant portion of the IFRS exposure draft states (emphasis added):

30 An insurer shall adjust the future cash flows for the time value of money, using discount rates that:
(a) are consistent with observable current market prices for instruments with cash flows whose characteristics reflect those of the insurance contract liability, in terms of, for example, timing, currency and liquidity.
(b) exclude any factors that influence the observed rates but are not relevant to the insurance contract liability (eg risks not present in the liability but present in the instrument for which the market prices are observed).

31 As a result of the principle in paragraph 30, if the cash flows of an insurance contract do not depend on the performance of specific assets, the discount rate shall reflect the yield curve in the appropriate currency for instruments that expose the holder to no or negligible credit risk, with an adjustment for illiquidity (see paragraph 34).

34 Many insurance liabilities do not have the same liquidity characteristics as assets traded in financial markets. For example, some government bonds are traded in deep and liquid markets and the holder can typically sell them readily at any time without incurring significant costs. In contrast, policyholders cannot liquidate their investment in some insurance contract liabilities without incurring significant costs, and in some cases they have no contractual right to liquidate their holding at all. Thus, in estimating discount rates for an insurance contract, an insurer shall take account of any differences between the liquidity characteristics of the instruments underlying the rates observed in the market and the liquidity characteristics of the insurance contract.

I don’t see anything unreasonable about this.

The Globe & Mail had reported earlier:

Despite their disappointment in the rules, at least some Canadian insurance executives say they are still optimistic that they will succeed in making their case as it appears that the draft is very preliminary and that the IASB is open to feedback. The insurers intend to present the accounting board with figures that demonstrate the impact the rules will have on their results.

I will be most interested in seeing those figures, particularly their derivation of the discount rate. Detail please!

KPMG comments:

Aspects of the proposed insurance model which are likely to attract debate include determining a discount rate for obligations based on their characteristics as opposed to the return on invested assets, and the treatment of changes in assumptions driving the measurement of the insurance obligation. The effects of changes in assumptions, whether financial such as interest rates or non-financial such as mortality and morbidity rates, would be required to be recognised in the statement of financial position and the statement of comprehensive income each reporting period.

Neil Parkinson, KPMG’s Insurance Sector Leader for Canada, emphasized the implications for Canadian insurers: “The IASB’s proposals would affect how all insurers measure their profitability and their financial position, and would likely result in greater volatility in many of the key measures they report. This volatility would be magnified for longer term insurance products, and is of particular concern for Canadian life insurers.”

I don’t see anything on the insurance companies’ websites themselves.

One way or another, this is an issue well worth following. Volatility in key measures? Great! Lets have a little more volatility in key measures and a little less “Whoopsee, we need $6-billion and a rule-change TODAY, came out of nowhere, honest!”

Update: Reaction in the UK is soporific:

Peter Vipond, director of financial regulation and taxation at the Association of British Insurers, said current insurance accounting methods have been inconsistent and haven’t adequately captured “the economics of the industry.”

“We are pleased that the IASB aims to offer a modern approach based on current measures that may offer investors a clearer view of insurers’ obligations and performance,” Vipond said in an e-mailed statement.

I believe – but am not sure! – that UK insurers use gilts to hedge annuities much more than corporates, in which case this change won’t make too much difference to them.

Update, 2010-8-4: Price-Waterhouse highlights the volatility issue:

Gail Tucker, partner, PricewaterhouseCoopers LLP, added:

“Industry reaction will be divided on these proposals. They will create increased volatility in insurer’s reported results going forward, as market movements will now affect reported profit. There will also be significant changes to the presentation of the income statement which stakeholders will need to take the time to understand. Today’s developments will also cast their net wider than the insurance industry, affecting all companies that issue contracts with insurance risk, such as financial guarantee contracts.

“Given the profound impact of these proposed changes, it is vital insurers work closely with industry analysts to make sure they fully understand the changes and what insurers’ accounting will look like going forward. As there is only a small window during which the industry has an opportunity to influence the final outcome of these proposals, insurers need to act now in assessing the implications of the new model on both their existing contracts and business practices.”

Update 2010-8-9: The MFC Earnings Release 2Q10 sheds some light (a little, anyway) on their objections:

We determine interest rates used in the valuation of policy liabilities based on a number of factors, as follows:
(a) we make assumptions as to the type, term and credit quality of the future fixed income investments;
(b) to reflect our expected investable universe, we adjust the publicly available benchmarks to remove the issues trading extremely tight or wide (i.e., the outliers);
(c) we assume reinvestment rates are graded down to average long-term fixed risk free rates at 20 years; and
(d) consistent with emerging best practices we limit the impact of spreads that are in excess of the long-term historical averages.

In other words. they are making an implicit assumption that they are always perfectly hedged.

Index Performance: July 2010

August 2nd, 2010

Performance of the HIMIPref™ Indices for July, 2010, was:

Total Return
Index Performance
July 2010
Three Months
to
July 30, 2010
Ratchet +1.48% -3.04%
FixFloat +0.25% ** -2.74% **
Floater +0.25% -6.79%
OpRet +0.28% +1.69%
SplitShare +2.33% +4.50%
Interest +0.28%**** +1.69%****
PerpetualPremium +1.09%* +6.29%*
PerpetualDiscount +2.67% +9.55%
FixedReset +1.78% +4.71%
* The last member of the PerpetualPremium index was transferred to PerpetualDiscount at the May, 2010, rebalancing; the June performance is set equal to the PerpetualDiscount index; the index was repopulate (from the PerpetualPremium index) at the June rebalancing.
** The last member of the FixedFloater index was transferred to Scraps at the June, 2010, rebalancing; subsequent performance figures are set equal to the Floater index
**** The last member of the InterestBearing index was transferred to Scraps at the June, 2009, rebalancing; subsequent performance figures are set equal to the OperatingRetractible index
Passive Funds (see below for calculations)
CPD +1.57% +5.16%
DPS.UN +2.05% +5.77%
Index
BMO-CM 50 +1.87% +5.11%
TXPR Total Return +1.70% +5.40%

Unofficial data for TXPR indicates a total return of +1.70% for July, indicating a rather large tracking error of 55bp for CPD on the month, probably due to the semi-annual July rebalancing. No accounting had been made in the original post for the change to monthly distributions. This error has now been corrected. The tracking error for July is therefore 13bp – still rather large, but much smaller than the estimate that did not account for the distribution.

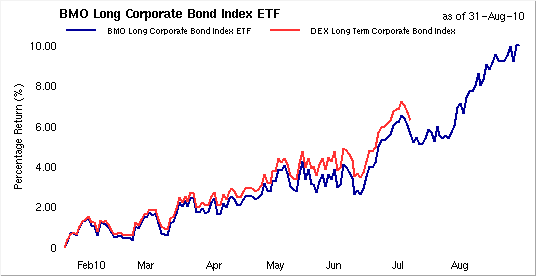
The pre-tax interest equivalent spread of PerpetualDiscounts over Long Corporates (which I also refer to as the Seniority Spread) ended the month at 275bp, a significant decline from the 290bp recorded at June month-end. Long corporate yields increased slightly, to 5.5% from 5.45%. I would be happier with long corporates in the 6.00-6.25% range, but what do I know? The market has never shown any particular interest in my happiness.

Charts related to the Seniority Spread and the Bozo Spread (PerpetualDiscount Current Yield less FixedReset Current Yield) are published in PrefLetter.

The trailing year returns are starting to look a bit more normal.


Click for big

But I suggest that eventually yields will make a difference:


Click for big

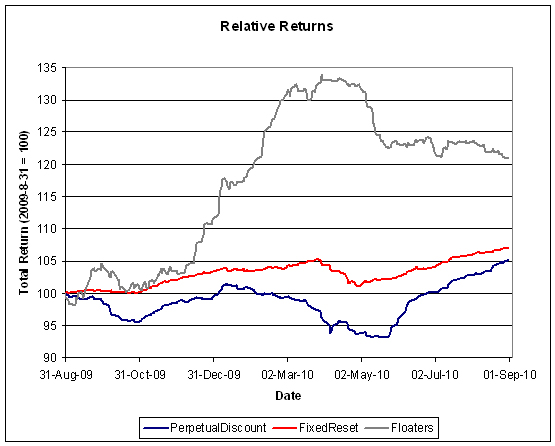
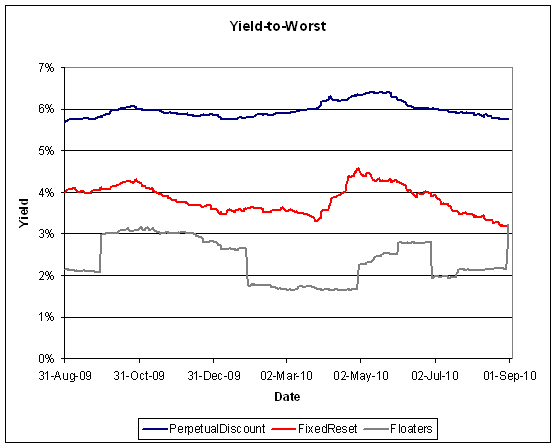
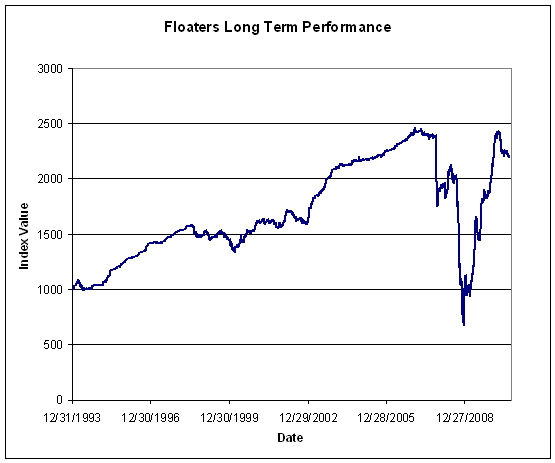
Floaters have had a wild ride


Click for big

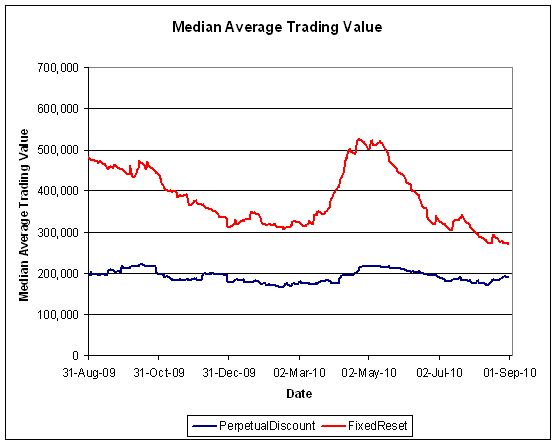
FixedReset volume declined during the month after their burst of activity in April when they performed poorly. Volume may be under-reported due to the influence of Alternative Trading Systems (as discussed in the November PrefLetter), but I am biding my time before incorporating ATS volumes into the calculations, to see if the effect is transient or not.


Click for big

Compositions of the passive funds were discussed in the September, 2009, edition of PrefLetter.

Claymore has published NAV and distribution data (problems with the page in IE8 can be kludged by using compatibility view) for its exchange traded fund (CPD) and I have derived the following table:

CPD Return, 1- & 3-month, to July, 2010
Date NAV Distribution Return for Sub-Period Monthly Return
April 30 16.11      
May 31 16.26     +0.93%
June 25 16.47 0.21 +2.58% +2.58%
June 30, 2010 16.47 0.00 0.00%
July 27 16.62 0.069 +1.33% +1.57%
July 30, 2010 16.66 0.00 0.24%
Quarterly Return +5.16%

Claymore currently holds $462,433,680 (advisor & common combined) in CPD assets, up about $18-million from the $444,847,391 reported last month and up about $88-million from the $373,729,364 reported at year-end. The monthly increase in AUM of about 3.95% is larger than the total return of +1.15%, implying that the ETF experienced net subscriptions in July.

The DPS.UN NAV for July 28 has been published so we may calculate the approximate July returns.

DPS.UN NAV Return, July-ish 2010
Date NAV Distribution Return for sub-period Return for period
June 30, 2010 19.85      
July 28, 2010 20.21     +1.81%
Estimated July Ending Stub +0.24% **
Estimated July Return +2.05% ***
**CPD had a NAVPU of 16.62 on July 28 and 16.66 on July 30, hence the total return for the period for CPD was +0.24%. The return for DPS.UN in this period is presumed to be equal.
*** The estimated July return for DPS.UN’s NAV is therefore the product of two period returns, +1.81% and +0.24% to arrive at an estimate for the calendar month of +2.05%

Now, to see the DPS.UN quarterly NAV approximate return, we refer to the calculations for May and June:

DPS.UN NAV Returns, three-month-ish to end-July-ish, 2010
May-ish +0.22%
June-ish +3.42%
July-ish +2.05%
Three-months-ish +5.77%

Best & Worst Performers: July 2010

August 1st, 2010

These are total returns, with dividends presumed to have been reinvested at the bid price on the ex-date. The list has been restricted to issues in the HIMIPref™ indices.

July 2010
Issue Index DBRS Rating Monthly Performance Notes (“Now” means “July 30”)
TRI.PR.B Floater Pfd-2(low) -1.06%  
BAM.PR.H OpRet Pfd-2(low) -1.04% Now with a pre-tax bid-YTW of 1.21% based on a bid of 25.65 and a call 2010-10-30 at 25.25.
BAM.PR.J OpRet Pfd-2(low) -1.02% Recently deleted from TXPR. Now with a pre-tax bid-YTW of 4.82% based on a bid of 26.08 and a softMaturity 2018-3-30.
BAM.PR.O OpRet Pfd-2(low) -0.39% Now with a pre-tax bid-YTW of 4.08% based on a bid of 25.75 and optionCertainty 2013-6-30 at 25.00.
IAG.PR.E Perpetual-Discount Pfd-2(high) -0.32% Recently deleted from TXPR. Now with a pre-tax bid-YTW of 6.10% based on a bid of 24.88 and a limitMaturity.
RY.PR.W Perpetual-Discount Pfd-1(low) +4.71% Now with a pre-tax bid-TTW of 5.58% based on a bid of 21.95 and a limitMaturity.
BAM.PR.M Perpetual-Discount Pfd-2(low) +5.18% The third-best performer in June. Now with a pre-tax bid-TTW of 6.30% based on a bid of 19.10 and a limitMaturity.
GWO.PR.J FixedReset Pfd-1(low) +5.36% The third-worst performer in June, which was due to a disappearing bid and lackadaisical market-making. Now with a pre-tax bid-TTW of 3.36% based on a bid of 27.31 and a call 2014-1-30 at 25.00..
ELF.PR.F Perpetual-Discount Pfd-2(low) +5.36% Now with a pre-tax bid-TTW of 6.42% based on a bid of 20.87 and a limitMaturity.
BAM.PR.N Perpetual-Discount Pfd-2(low) +5.74% Now with a pre-tax bid-YTW of 6.34% based on a bid of 18.99 and a limitMaturity.

It’s interesting to see the BAM OpRet issues dominating the lower end of the monthly returns …. one is tempted to think that BAM.PR.J declined due to the TXPR rebalancing, and the other OpRets went down due to swaps triggered by the initial decline.

HIMIPref™ Index Rebalancing: July 2010

July 31st, 2010
HIMI Index Changes, July 30, 2010
Issue From To Because
RY.PR.H PerpetualDiscount PerpetualPremium Price
CU.PR.A PerpetualDiscount PerpetualPremium Price
GWL.PR.O Scraps PerpetualPremium Volume
BAM.PR.E Ratchet Scraps Volume
CM.PR.R OpRet Scraps Volume

The strong performance of Straight Perpetuals over the past two months means that the PerpetualPremium index has been repopulated, albeit lightly and weakly. Unfortunately, however, low volumes on BAM.PR.E have resulted in its relegation to the Scraps index, leaving Ratchets as an empty set.

There were the following intra-month changes:

HIMI Index Changes during July 2010
Issue Action Index Because
FFH.PR.G Add Scraps New Issue
NPP.PR.A Add Scraps New Issue

July 30, 2010

July 31st, 2010

There was a very good essay (which means: “one that I agree with”) in The Economist of July 24 titled Too many laws, too many prisoners that included the information:

For bringing some prescription sleeping pills into prison, he was put in solitary confinement for 71 days. The prison was so crowded, however, that even in solitary he had two room-mates.

Comrade Peace Prize is touting the automaker bail-out (far more expensive than the banking bail-out, but probably cheaper than the Fannie/Freddie bail-out):

Heading into a congressional election season in which polls show the public skeptical about the $84.8 billion rescue and anxious about economy, Obama is using the backdrop of Detroit- area plants owned by GM and Chrysler to promote what he says is an industry revival that has saved more than a million jobs.

“We are going to get all the money back that we invested in those car companies,” Obama said on ABC’s “The View” program.

For sure the money will be paid back! All GM needs is more subsidies:

The price tag? About $41,000. Luxury car prices for a car that is much more about what is under the hood than between the doors. Comfort and feature-wise, the volt is more like a Focus than a Lexus. For that kind of sticker-price you can get a BMW convertible, a Cadillac CTS or a number of well-known luxury cars. This creates a problem in making the desired electric vehicle commercially viable.

In order to compensate for the high cost and the desire to have a more ‘green’ economy, the Federal government implemented a $7,500 tax credit for electric vehicles, reducing the overall price of the Volt to $33,500. That’s right, much like the abomination that was the “Cash for Clunkers” program, our federal government is spending other people’s tax dollars to subsidize the purchase of cars by people who might otherwise choose to buy something else. By doing so they hope that the price tag will be more acceptable to potential buyers.

At least with Cash for Clunkers this taxpayer money was spread around the industry. In this case, however, the qualifying candidates for the program are narrow indeed, although it has provided a boon to the golf cart industry by allowing this subsidy to be given to purchasers of road-worthy golf carts, if equipped with side mirrors and seat belts (wittily referred to by the Wall Street Journal as a “Cash for Clubbers” program).

Still, even after the tax break, the Volt remains a pricey alternative to the typical gasoline-only cars.

Why do we subsidize the auto industry? Because they’re good jobs. Why are they good jobs? Because they’re subsidized.

Moody’s is increasingly dubious regarding whether Iceland is investment grade:

Moody’s is “taking it too far,” Economy MinisterGylfi Magnusson said in an interview yesterday, after the rating service cut the outlook on Iceland’s Baa3 foreign currency debt to negative. Moody’s said it will lower the rating to junk if a June court ruling banning some foreign loans hurts the recovery or forces the government to raise debt levels by bailing out the banks.

Iceland’s financial crisis was exacerbated by banks that borrowed in currencies such as Japanese yen and Swiss francs to take advantage of lower interest rates, then repackaged them as kronur loans for clients. The krona has lost 38 percent against the yen and 30 percent against the franc since Sept. 15, 2008. The government is struggling to pay down a gross debt burden that will swell to 150 percent of economic output this year, Moody’s estimates.

The prospect that Iceland’s economy will return to growth next year is “subject to significant downside risks,” Moody’s said. The economy contracted 6.5 percent in 2009 and will probably shrink a further 2.6 percent this year, the central bank estimates. Output will expand 3.4 percent in 2011, the bank said in its latest forecast in May.

CIBC has reopened some USD covered bond deals:

DBRS has today assigned ratings of AAA to the Series CB5 (Tranche 2) and Series CB7 (Tranche 2) covered bonds issued under the Canadian Imperial Bank of Commerce (CIBC) Global Public Sector Covered Bond Programme (the Programme). The USD 400 million Series CB5 (Tranche 2) covered bonds are a re-opening of the existing Series CB5 (Tranche 1) covered bonds and have the same coupon rate (2.00%) and maturity date (February 4, 2013). Similarly, the USD 600 million Series CB7 (Tranche 2) covered bonds are a re-opening of the existing Series CB7 (Tranche 1) covered bonds and have the same coupon rate (2.60%) and maturity date (July 2, 2015). All covered bonds issued under the Programme (the Covered Bonds) rank pari passu with each other.

I wasn’t able to learn the price at which these went out the door, but was able to learn that they were issued as Rule 144a private placements: so retail can go suck eggs, the regulators have destroyed the market.

And now Toronto hosts Caribana again – complete with its perennial funding problems, despite the fact that it brings a tidal wave of cash into the city. Meanwhile, the totally synthetic Luminato is awash in cash (like its cousin, Nuit Blanche) despite having an economic impact, as near as I can figure, of half a dozen extra coffees being sold so the ribbon cutters can stay awake during each others’ speeches. But synthetic events are just so much easier to control than grass-roots ones, don’t you agree? And provide employment for the right sort of people. But anyway, have fun at Caribana, everyone – and if you’re under thirty, kiss a girl for me!

The month ended on a somnolent note, with very quiet trading in the Canadian preferred share market. PerpetualDiscounts gained 4bp and FixedResets were up 10bp, taking the median weighted average yield to worst on the latter class down to 3.46% – the eighth-lowest on record. All seen lower market yiels were at the end of March, 2010.

PerpetualDiscounts now yield 5.89%, equivalent to 8.25% interest at the standard 1.4x conversion factor. Long Corporates now yield about 5.5%, so the pre-tax interest-equivalent spread (also called the Seniority Spread) is now 275bp, a surprising increase from the 265bp recorded on July 28. Corporates have been on wheels!


Click for Big
HIMIPref™ Preferred Indices
These values reflect the December 2008 revision of the HIMIPref™ Indices

Values are provisional and are finalized monthly
Index Mean
Current
Yield
(at bid)
Median
YTW
Median
Average
Trading
Value
Median
Mod Dur
(YTW)
Issues Day’s Perf. Index Value
Ratchet 2.89 % 2.96 % 23,089 20.14 1 0.0000 % 2,078.3
FixedFloater 0.00 % 0.00 % 0 0.00 0 0.0262 % 3,149.2
Floater 2.52 % 2.14 % 38,827 22.00 4 0.0262 % 2,244.6
OpRet 4.88 % 3.59 % 92,059 0.33 11 0.1416 % 2,342.3
SplitShare 6.22 % 2.87 % 73,865 0.08 2 0.0000 % 2,229.4
Interest-Bearing 0.00 % 0.00 % 0 0.00 0 0.1416 % 2,141.8
Perpetual-Premium 5.94 % 5.75 % 105,684 1.79 4 -0.1085 % 1,937.2
Perpetual-Discount 5.82 % 5.89 % 178,057 14.03 73 0.0406 % 1,862.5
FixedReset 5.32 % 3.46 % 307,644 3.43 47 0.1013 % 2,227.7
Performance Highlights
Issue Index Change Notes
PWF.PR.O Perpetual-Discount 1.40 % YTW SCENARIO
Maturity Type : Limit Maturity
Maturity Date : 2040-07-30
Maturity Price : 24.39
Evaluated at bid price : 24.60
Bid-YTW : 5.93 %
Volume Highlights
Issue Index Shares
Traded
Notes
SLF.PR.A Perpetual-Discount 30,873 RBC crossed 25,000 at 20.06.
YTW SCENARIO
Maturity Type : Limit Maturity
Maturity Date : 2040-07-30
Maturity Price : 19.98
Evaluated at bid price : 19.98
Bid-YTW : 6.02 %
BAM.PR.J OpRet 25,985 YTW SCENARIO
Maturity Type : Soft Maturity
Maturity Date : 2018-03-30
Maturity Price : 25.00
Evaluated at bid price : 26.08
Bid-YTW : 4.82 %
TRP.PR.A FixedReset 23,651 YTW SCENARIO
Maturity Type : Call
Maturity Date : 2015-01-30
Maturity Price : 25.00
Evaluated at bid price : 25.91
Bid-YTW : 3.83 %
TD.PR.O Perpetual-Discount 23,400 YTW SCENARIO
Maturity Type : Limit Maturity
Maturity Date : 2040-07-30
Maturity Price : 21.65
Evaluated at bid price : 21.65
Bid-YTW : 5.64 %
RY.PR.A Perpetual-Discount 19,947 YTW SCENARIO
Maturity Type : Limit Maturity
Maturity Date : 2040-07-30
Maturity Price : 20.08
Evaluated at bid price : 20.08
Bid-YTW : 5.55 %
TD.PR.Q Perpetual-Discount 16,570 YTW SCENARIO
Maturity Type : Limit Maturity
Maturity Date : 2040-07-30
Maturity Price : 24.65
Evaluated at bid price : 24.88
Bid-YTW : 5.65 %
There were 11 other index-included issues trading in excess of 10,000 shares.

BPO to Reshuffle Assets, Become Pure Office Play

July 30th, 2010

Brookfield Properties has announced:

a strategic repositioning plan to transform itself into a global pure-play office property company. The plan includes the acquisition of an interest in a significant portfolio of premier office properties in Australia from Brookfield Asset Management (BAM: NYSE, TSX, Euronext) as well as the divestment of Brookfield Properties’ residential land and housing business.

Brookfield Properties has agreed to enter into a transaction with Brookfield Asset Management whereby Brookfield Properties will pay Brookfield Asset Management A$1.6 billion (US$1.4 billion) for an interest in 16 premier Australian office properties comprising 8 million square feet in Sydney, Melbourne and Perth which are 99% leased. The properties have a total value of A$3.8 billion (US$3.4 billion).

Brookfield Properties will fund the transaction from available liquidity of US$1.3 billion and from a US$750 million subordinate bridge acquisition facility from Brookfield Asset Management, which will be repaid from the completion of some or all of the following: asset sales, including a sell down of Brookfield Properties’ equity interest in its publicly-listed company Brookfield Office Properties Canada (TSX: BOX.UN), or other financing or capital activities.

A supplemental information package relating to this transaction is available on Brookfield Properties’ website at www.brookfieldproperties.com.

As a further step in the strategy of converting Brookfield Properties into a global pure play office company, the company announced that it intends to divest of its residential land and housing division. To this end, Brookfield Properties intends to commence discussions with Brookfield Homes Corporation (NYSE: BHS) regarding the possible merger of these operations with Brookfield Homes. Should the merger proceed, Brookfield Properties’ equity interest in the residential business would be converted into a listed security in the merged entity which Brookfield Properties would then dispose of through an offering to its shareholders. Brookfield Asset Management would commit to acquire any shares of the merged entity that are not otherwise subscribed for in the offering, thereby ensuring that Brookfield Properties will successfully dispose of its residential interests and receive full proceeds.

The pricing supplement is titled Australia Office Portfolio Transaction and is of great interest:

BPO’s interest in the Portfolio will be acquired through a Total Return Swap entitling BPO to the net cash flows and any changes in the value of the properties

  • This structure preserves the benefit of property-level financing and will allow for efficient transfer of this Portfolio at a future date into a different ownership entity, e.g. public vehicle or private fund in order to continue BPO’s asset management strategy
  • BPO will be property manager for the portfolio and will make or approve all significant decisions relating to the properties, including refinancingsand other decisions relating to the property debt
  • BPO will be responsible for additional capital requirements and will be entitled to any proceeds from refinancings from the properties
  • BPO will have an option to acquire the properties at anytime

The total return swap concept is fascinating, but I haven’t yet thought through all the implications, particularly since the contract is with the parent.

On the whole, the deal seems to me to be a continuation of the basic Brookfield philosophy of accumulating assets at the parent level and then pushing them into subsidiaries; attracting co-investors and increasing (non-recourse!) leverage along the way. It hasn’t been too long since they last did this, with the BPP conversion to a REIT.

BPO has several series of preferreds outstandng: BPO.PR.F, BPO.PR.H, BPO.PR.I, BPO.PR.J, BPO.PR.K, BPO.PR.L and BPO.PR.N.

Update: This is credit-neutral, according to DBRS:

The rating confirmation also takes into consideration that, from a financial risk perspective, the Acquisition is expected to have a neutral impact on the Company’s balance sheet ratios. DBRS expects Brookfield to fund the Acquisition with available liquidity, including un-drawn bank facilities ($788 million) and a cash balance ($475 million) totalling approximately $1.3 billion and from a $750 million bridge facility provided by BAM. Over the next several quarters, DBRS expects Brookfield to repay this bridge facility with a combination of proceeds from the following: a sell-down of the Company’s interest in Brookfield Office Properties Canada (the REIT; of which the Company currently owns a 91% interest), asset sales and other capital activities. As a result, DBRS estimates that the Company’s debt-to-capital ratio will remain close to 55% (including preferred shares) and EBITDA interest coverage should modestly improve to the 2.35 times range (including capitalized interest). This level of interest coverage remains at the low end of the range for the current rating category. However, DBRS takes comfort in the fact that Brookfield has made good progress in improving its overall financial flexibility position and that office fundamentals in the Company’s core markets are showing signs of improvement.

Overall, DBRS believes that the Acquisition complements Brookfield’s existing high-quality office portfolio and offers an immediate and sizeable presence in a new market. Over time, DBRS expects Brookfield to grow this platform, which should further benefit leasing initiatives and tenant retention rates.

July 29, 2010

July 30th, 2010

The Europeans are taking a look at High Frequency Trading:

High-frequency trading will be investigated by regulators to “better understand any risks,” Europe’s top market watchdog said in a report on proposed industry rules.

A planned European Union market regulator should also have the power to set standards for the tools used by high-frequency traders, such as the practice of placing computer servers close to trading venues to speed up market access, the Committee of European Securities Regulators told the European Commission.

Powers for the proposed European regulator should keep pace “with new technological advances, increasingly fragmented equity markets” and “shortcomings” in post-trade information, Sally Dewar, a managing director at the U.K. Financial Services Authority, said in an e-mailed statement today.

There’s nothing wrong with them familiarizing themselves with the issue – the rules-makers should know how the game is played! – but the Europeans have come up with so much wierd stuff lately that it will be most interesting to see what comes of it.

The bill to encourage banks to extend small-business credit has stalled in the Senate:

Senate Republicans blocked a measure that would cut taxes and ease credit for small businesses, saying they objected that Democrats refused to consider their amendments to extend expiring tax breaks.

The Senate voted 58-42 today to end debate on the bill, falling short of the 60 votes required to consider the legislation for passage.

The legislation was faulted by Republicans such as Senator Richard Shelby of Alabama for being a government rescue similar to the $700 billion bank bailout of 2008. The program might induce banks to make risky loans, lawmakers said.

“The lack of credit for small businesses is a problem that needs to be addressed,” Shelby said during Senate debate last week. “I do not, however, believe that we should try and solve this problem with another expensive and bureaucratic government program.”

There will be congressional hearings into Basel III, which should satisfy my desire to understand the changes better. I mean, we’re certainly not going to see any discussion by OSFI or the Ottawa Mickey Mouse League, are we?

Christopher Dodd and Barney Frank, authors of the U.S. financial overhaul, plan hearings on the status of global talks to revise bank-capital standards amid worries that proposed rules are being watered down.

The Senate Banking Committee, chaired by Dodd, will hold the discussions on the Basel process in September, said Sean Oblack, a spokesman for the Connecticut Democrat. Frank, the Massachusetts Democrat who heads the House Financial Services Committee, also plans to hold a hearing on the subject, said spokesman Steven Adamske. Neither panel has set a date nor decided who will be asked to testify.

Say what you like about what comes out of Congress – and I do! – the research that goes into these hearings is first-rate.

TD Bank has issued 5-year covered bonds in USD at 2.20%:

DBRS has today finalized the rating of AAA on the Covered Bonds, Series 1 (the Covered Bonds) issued under The Toronto-Dominion Bank (TD) EUR 10 billion Global Public Sector Covered Bond Programme (the Programme). The Covered Bonds (USD 2 billion) have a coupon rate of 2.20% and a hard-bullet maturity date of July 29, 2015.

The ratings are based on several factors. First, the Covered Bonds are senior unsecured direct obligations of TD, which is the second largest bank in Canada and rated AA and R-1 (high) with a Stable trend by DBRS. Second, in addition to a general recourse to TD’s assets, the Covered Bonds are supported by a diversified collateral pool (the Cover Pool) of prime credit home equity lines of credit (HELOCs) insured by Canada Mortgage & Housing Corporation (CMHC). CMHC is an agent of Her Majesty in right of Canada and is rated AAA by DBRS. The Cover Pool was approximately $10.7 billion as of April 19, 2010. Third, the Covered Bonds benefit from several structural features, such as a reserve fund, when applicable; a minimum rating requirement for swap counterparties, servicer and cash manager; and, lastly, the funding of pre-maturity liquidity if TD’s rating falls below certain thresholds.

Little of interest happened on reasonably good volume today, with PerpetualDiscounts up 2bp and FixedResets about as close to flat as you can get.

HIMIPref™ Preferred Indices
These values reflect the December 2008 revision of the HIMIPref™ Indices

Values are provisional and are finalized monthly
Index Mean
Current
Yield
(at bid)
Median
YTW
Median
Average
Trading
Value
Median
Mod Dur
(YTW)
Issues Day’s Perf. Index Value
Ratchet 2.88 % 2.96 % 23,452 20.16 1 0.0000 % 2,078.3
FixedFloater 0.00 % 0.00 % 0 0.00 0 -0.0914 % 3,148.4
Floater 2.52 % 2.15 % 39,083 21.96 4 -0.0914 % 2,244.0
OpRet 4.89 % 3.57 % 92,120 0.34 11 -0.0814 % 2,339.0
SplitShare 6.22 % 1.71 % 76,900 0.08 2 0.0429 % 2,229.4
Interest-Bearing 0.00 % 0.00 % 0 0.00 0 -0.0814 % 2,138.8
Perpetual-Premium 5.93 % 5.66 % 106,845 1.79 4 -0.1871 % 1,939.3
Perpetual-Discount 5.82 % 5.89 % 184,222 14.05 73 0.0155 % 1,861.7
FixedReset 5.32 % 3.47 % 312,437 3.43 47 0.0016 % 2,225.5
Performance Highlights
Issue Index Change Notes
HSB.PR.D Perpetual-Discount -2.16 % YTW SCENARIO
Maturity Type : Limit Maturity
Maturity Date : 2040-07-29
Maturity Price : 21.30
Evaluated at bid price : 21.30
Bid-YTW : 5.94 %
POW.PR.D Perpetual-Discount 1.04 % YTW SCENARIO
Maturity Type : Limit Maturity
Maturity Date : 2040-07-29
Maturity Price : 21.31
Evaluated at bid price : 21.31
Bid-YTW : 5.92 %
Volume Highlights
Issue Index Shares
Traded
Notes
BAM.PR.H OpRet 59,500 TD crossed blocks of 40,000 and 18,600 shares, both at 25.75.
YTW SCENARIO
Maturity Type : Call
Maturity Date : 2010-10-30
Maturity Price : 25.25
Evaluated at bid price : 25.61
Bid-YTW : 1.81 %
TD.PR.G FixedReset 44,685 TD crossed blocks of 15,000 and 11,000 shares, both at 27.51.
YTW SCENARIO
Maturity Type : Call
Maturity Date : 2014-05-30
Maturity Price : 25.00
Evaluated at bid price : 27.50
Bid-YTW : 3.49 %
TD.PR.O Perpetual-Discount 43,723 Nesbitt crossed 15,200 at 21.70.
YTW SCENARIO
Maturity Type : Limit Maturity
Maturity Date : 2040-07-29
Maturity Price : 21.65
Evaluated at bid price : 21.65
Bid-YTW : 5.64 %
TD.PR.K FixedReset 35,085 TD crossed 20,000 at 27.55.
YTW SCENARIO
Maturity Type : Call
Maturity Date : 2014-08-30
Maturity Price : 25.00
Evaluated at bid price : 27.55
Bid-YTW : 3.59 %
RY.PR.X FixedReset 27,030 RBC crossed 20,000 at 27.60.
YTW SCENARIO
Maturity Type : Call
Maturity Date : 2014-09-23
Maturity Price : 25.00
Evaluated at bid price : 27.60
Bid-YTW : 3.48 %
MFC.PR.D FixedReset 26,672 TD crossed 15,900 at 27.91.
YTW SCENARIO
Maturity Type : Call
Maturity Date : 2014-07-19
Maturity Price : 25.00
Evaluated at bid price : 27.78
Bid-YTW : 3.81 %
There were 34 other index-included issues trading in excess of 10,000 shares.

FFN.PR.A Releases Semi-Annual Report

July 30th, 2010

Financial 15 Split Corp. II has released its semi-annual statements to May 31, 2010.

Dividend receipts declined to about $1.3-million in 1H10 from about $2.1-million in 1H09, while expenses rose to $461,000 from $390,000 due to higher valuations and a small expense for Service Fees. Accordingly, Income Coverage for the Preferred Shares dropped to 0.6-:1 in 1H10 from 1.0+:1 in 1H09.

FFN.PR.A was last mentioned on PrefBlog when the Capital Unit Distribution was suspended in June (hah! No Service Fees to pay this quarter!). FFN.PR.A is tracked by HIMIPref™, but is relegated to the Scraps index on credit concerns.

FTN.PR.A Releases Semi-Annual Report

July 30th, 2010

Financial 15 Split Corp. has announced:

that its semi-annual financial statements and management report of fund performance for the period ended May 31, 2010 are now available at www.sedar.com and the Company’s website at www.financial15.com.

The Report (to 2010-5-31) states:

During April 2010, the Company issued 1,980,000 Class A and Preferred shares at a unit price of $20 for total net proceeds after the payment of agents fees of $37.5 million. As a result of this offering, one time issue costs and agents fees in connection with the offering increased the expense ratio during the period. The Company did not immediately invest the proceeds into the financial services stocks as reflected by the higher cash position as at May 31,2010 thus benefiting from the opportunity to purchase the core stocks at lower levels than those in April.

Net investment income was $1.1-million, while distributions on preferred shares amounted to $2.1-million, so income coverage for the six months to May 31, 2010, was 0.5+:1, a huge reduction from the 1.2+:1 recorded in 1H09.

Cash on the balance sheet represented 17% of total assets, but this does not explain the sharp decline in income coverage – the secondary offering closed in mid-April, so the cash was only there for about six weeks.

Instead, it appears that several other factors had dominance:

  • Dividend receipts declined from about $3-million to about $2-million
  • Management and Service fees increased to about $670,000 in 1H10 from about $340,000 (net) in 1H09

Note 6 to the financials reads in part:

The Company is responsible for all expenses incurred in connection with the operation and administration of the Company, including, but not limited to, ongoing custodian, transfer agent, legal and audit expenses.

Pursuant to the administration agreement, the Manager is entitled to an administration fee payable monthly in arrears at an annual rate of 0.10% of the transactional net assets of the Company, which includes the outstanding Preferred shares, calculated as at each monthly valuation date and an amount equal to the service fee payable to dealers on the Class A shares at a rate of 0.50% per annum. No service fee will be paid in any calendar quarter if regular dividends are not paid to holders of Class A shares in respect of each month in such calendar quarter.

Pursuant to the terms of the investment management agreement, Quadravest is entitled to a base management fee payable in arrears at an annual rate equal to 0.65% of the transactional net assets of the Company, which include the outstanding Preferred shares, calculated as at each monthly valuation date. In addition, Quadravest is entitled to receive a performance fee subject to the achievement of certain pre-established total return thresholds.

Total management fees of $519,631 (May 31, 2009-$373,315), incurred during the period, include the administration fee and base management fee. No performance fees were paid in 2010 or 2009.

Clearly, the Service Fee increased because the capital unitholders received all their dividends in the first half so all Service Fees were payable. In 1H09, no service fees were payable – there was even a rather odd recovery!

Management fees increased due to the increase in assets of the fund.

So it looks like the expenses are probably here to stay – provided the NAV holds up above $15.00 and the capital unit distributions are made – but it is rather odd that dividend receipts have declined so precipituously despite the increase in assets. At some point it will be most interesting to attempt to reconcile these data with the disclosed holdings – how much of this is the result of actual dividend cuts for the common shares held, and how much due to selection of lower yielding securities?

However, the income coverage should improve to some extent in the second half as the cash on the balance sheet is invested.

FFH.PR.G Settles

July 29th, 2010

This should have been posted yesterday, July 28. Sorry!

Fairfax Financial Holdings Ltd. has announced that it:

has completed its previously announced public offering of Preferred Shares, Series G (the “Series G Shares”) in Canada. As a result of the underwriters’ exercising in full their option to purchase an additional 2,000,000 Series G Shares, Fairfax has issued 10,000,000 Series G Shares for gross proceeds of $250 million. Net proceeds of the issue, after commissions and expenses, are approximately $242 million.

Fairfax intends to use the net proceeds of the offering to augment its cash position, to increase short term investments and marketable securities held at the holding company level, to retire outstanding debt and other corporate obligations from time to time, and for general corporate purposes.

The Series G Shares were sold through a syndicate of Canadian underwriters led by BMO Capital Markets, CIBC, RBC Capital Markets and Scotia Capital, and that also included TD Securities, National Bank Financial, Cormark Securities, GMP Securities, Canaccord Genuity, Desjardins Securities and HSBC Securities (Canada).

FFH.PR.G is a FixedReset, 5.00%+256, announced July 20.

Vital statistics are:

FFH.PR.G FixedReset YTW SCENARIO
Maturity Type : Limit Maturity
Maturity Date : 2040-07-28
Maturity Price : 24.80
Evaluated at bid price : 24.85
Bid-YTW : 5.05 %

FFH.PR.G will be tracked by HIMIPref™, but is relegated to the Scraps index on credit concerns.