In yet another example of PrefBlog’s trendsetting nature, Citigroup has started a blog.
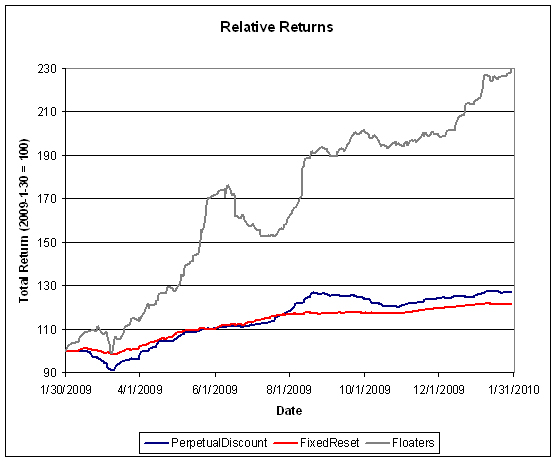
The market responded to my deprecating remarks about FixedResets by selling off PerpetualDiscounts, which lost 28bp on the day and buying FixedResets, which gained 5bp, on fairly heavy volume.
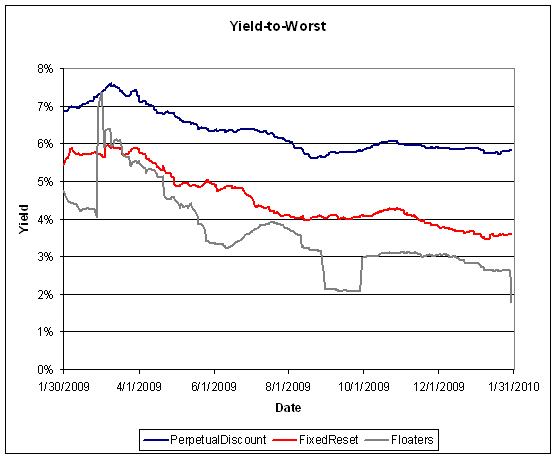
PerpetualDiscounts now yield 5.83%, equivalent to 8.16% interest at the standard equivalency factor of 1.4x. Long corporates continue to yield about 5.8%, so the pre-tax interest-equivalent spread is now about 235bp, which is where it was at month-end.
| HIMIPref™ Preferred Indices These values reflect the December 2008 revision of the HIMIPref™ Indices Values are provisional and are finalized monthly |
|||||||
| Index | Mean Current Yield (at bid) |
Median YTW |
Median Average Trading Value |
Median Mod Dur (YTW) |
Issues | Day’s Perf. | Index Value |
| Ratchet | 3.14 % | 3.85 % | 29,741 | 20.01 | 1 | -0.2762 % | 1,762.0 |
| FixedFloater | 5.91 % | 3.96 % | 35,743 | 19.02 | 1 | -4.9070 % | 2,676.5 |
| Floater | 2.10 % | 1.78 % | 38,620 | 23.08 | 4 | -0.1867 % | 2,185.1 |
| OpRet | 4.85 % | -4.11 % | 107,957 | 0.09 | 13 | -0.1887 % | 2,317.6 |
| SplitShare | 6.45 % | 6.81 % | 149,412 | 3.73 | 2 | -1.7042 % | 2,084.2 |
| Interest-Bearing | 0.00 % | 0.00 % | 0 | 0.00 | 0 | -0.1887 % | 2,119.3 |
| Perpetual-Premium | 5.75 % | 5.57 % | 80,086 | 2.21 | 7 | -0.0338 % | 1,891.5 |
| Perpetual-Discount | 5.80 % | 5.83 % | 172,105 | 14.13 | 69 | -0.2837 % | 1,817.3 |
| FixedReset | 5.42 % | 3.61 % | 318,524 | 3.80 | 42 | 0.0525 % | 2,179.3 |
| Performance Highlights | |||
| Issue | Index | Change | Notes |
| BAM.PR.G | FixedFloater | -4.91 % | YTW SCENARIO Maturity Type : Limit Maturity Maturity Date : 2040-02-03 Maturity Price : 25.00 Evaluated at bid price : 18.41 Bid-YTW : 3.96 % |
| BNA.PR.D | SplitShare | -2.24 % | YTW SCENARIO Maturity Type : Hard Maturity Maturity Date : 2014-07-09 Maturity Price : 25.00 Evaluated at bid price : 25.76 Bid-YTW : 6.81 % |
| GWO.PR.G | Perpetual-Discount | -1.07 % | YTW SCENARIO Maturity Type : Limit Maturity Maturity Date : 2040-02-03 Maturity Price : 21.80 Evaluated at bid price : 22.16 Bid-YTW : 5.93 % |
| BNS.PR.K | Perpetual-Discount | -1.06 % | YTW SCENARIO Maturity Type : Limit Maturity Maturity Date : 2040-02-03 Maturity Price : 21.51 Evaluated at bid price : 21.51 Bid-YTW : 5.63 % |
| MFC.PR.B | Perpetual-Discount | -1.03 % | YTW SCENARIO Maturity Type : Limit Maturity Maturity Date : 2040-02-03 Maturity Price : 20.16 Evaluated at bid price : 20.16 Bid-YTW : 5.86 % |
| GWO.PR.I | Perpetual-Discount | -1.03 % | YTW SCENARIO Maturity Type : Limit Maturity Maturity Date : 2040-02-03 Maturity Price : 19.20 Evaluated at bid price : 19.20 Bid-YTW : 5.94 % |
| IAG.PR.C | FixedReset | 1.22 % | YTW SCENARIO Maturity Type : Call Maturity Date : 2014-01-30 Maturity Price : 25.00 Evaluated at bid price : 27.38 Bid-YTW : 3.76 % |
| BAM.PR.K | Floater | 1.37 % | YTW SCENARIO Maturity Type : Limit Maturity Maturity Date : 2040-02-03 Maturity Price : 15.50 Evaluated at bid price : 15.50 Bid-YTW : 2.55 % |
| Volume Highlights | |||
| Issue | Index | Shares Traded |
Notes |
| MFC.PR.D | FixedReset | 105,335 | Nesbitt crossed 50,000 at 28.09; RBC crossed 20,000 at the same price. YTW SCENARIO Maturity Type : Call Maturity Date : 2014-07-19 Maturity Price : 25.00 Evaluated at bid price : 28.07 Bid-YTW : 3.83 % |
| RY.PR.X | FixedReset | 85,645 | Nesbitt crossed 50,000 at 27.78; RBC crossed 10,000 at 27.80. YTW SCENARIO Maturity Type : Call Maturity Date : 2014-09-23 Maturity Price : 25.00 Evaluated at bid price : 27.78 Bid-YTW : 3.60 % |
| NA.PR.K | Perpetual-Discount | 50,475 | RBC crossed 45,600 at 24.81. YTW SCENARIO Maturity Type : Limit Maturity Maturity Date : 2040-02-03 Maturity Price : 24.37 Evaluated at bid price : 24.71 Bid-YTW : 5.93 % |
| RY.PR.T | FixedReset | 45,700 | Dundee sold 10,000 to anonymous at 27.72; Desjardins crossed blocks of 10,100 and 10,000, both at 27.75. YTW SCENARIO Maturity Type : Call Maturity Date : 2014-09-23 Maturity Price : 25.00 Evaluated at bid price : 27.75 Bid-YTW : 3.61 % |
| TD.PR.I | FixedReset | 44,406 | YTW SCENARIO Maturity Type : Call Maturity Date : 2014-08-30 Maturity Price : 25.00 Evaluated at bid price : 27.81 Bid-YTW : 3.61 % |
| TD.PR.E | FixedReset | 43,799 | Nesbitt crossed 11,600 at 27.88 and 23,000 at 27.90. YTW SCENARIO Maturity Type : Call Maturity Date : 2014-05-30 Maturity Price : 25.00 Evaluated at bid price : 27.87 Bid-YTW : 3.44 % |
| There were 50 other index-included issues trading in excess of 10,000 shares. | |||