I take issue with the description of the leverage ratio as inherently conservative. Its virtue is simplicity, full stop.
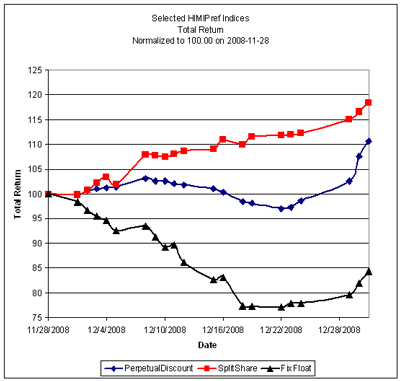
Another glorious day for preferreds amidst continued heavy volume. It’s nice to see.
| Issue |
Index |
Change |
Notes |
| TD.PR.P |
Perpetual-Discount |
-4.29 % |
Yield-to-Worst (at Bid) : 6.67 %
Maturity Type : Limit Maturity
Maturity Date : 2039-01-05
Maturity Price : 20.10
Probability of Maturity : 100.00 %
Recursions 1
|
| BAM.PR.O |
OpRet |
-3.95 % |
Yield-to-Worst (at Bid) : 14.83 %
Maturity Type : Option Certainty
Maturity Date : 2013-06-30
Maturity Price : 25.00
Probability of Maturity : 100.00 %
Recursions 2
|
| SBC.PR.A |
SplitShare |
-3.93 % |
Yield-to-Worst (at Bid) : 10.69 %
Maturity Type : Hard Maturity
Maturity Date : 2012-11-30
Maturity Price : 10.00
Probability of Maturity : 100.00 %
Recursions 2
|
| SLF.PR.E |
Perpetual-Discount |
-3.83 % |
Yield-to-Worst (at Bid) : 7.43 %
Maturity Type : Limit Maturity
Maturity Date : 2039-01-05
Maturity Price : 15.31
Probability of Maturity : 100.00 %
Recursions 1
|
| BCE.PR.A |
FixedFloater |
-3.73 % |
Yield-to-Worst (at Bid) : 7.33 %
Maturity Type : Limit Maturity
Maturity Date : 2039-01-05
Maturity Price : 25.00
Probability of Maturity : 100.00 %
Recursions 1
|
| TD.PR.C |
FixedReset |
-3.40 % |
Yield-to-Worst (at Bid) : 5.08 %
Maturity Type : Limit Maturity
Maturity Date : 2039-01-05
Maturity Price : 24.35
Probability of Maturity : 68.12 %
Recursions 1
|
| RY.PR.N |
FixedReset |
-2.63 % |
Yield-to-Worst (at Bid) : 5.56 %
Maturity Type : Limit Maturity
Maturity Date : 2039-01-05
Maturity Price : 25.46
Probability of Maturity : 53.20 %
Recursions 1
|
| TD.PR.A |
FixedReset |
-2.33 % |
Yield-to-Worst (at Bid) : 4.78 %
Maturity Type : Limit Maturity
Maturity Date : 2039-01-05
Maturity Price : 22.18
Probability of Maturity : 91.19 %
Recursions 1
|
| GWO.PR.G |
Perpetual-Discount |
-2.02 % |
Yield-to-Worst (at Bid) : 7.13 %
Maturity Type : Limit Maturity
Maturity Date : 2039-01-05
Maturity Price : 18.41
Probability of Maturity : 100.00 %
Recursions 1
|
| BCE.PR.C |
FixedFloater |
-2.02 % |
Yield-to-Worst (at Bid) : 7.54 %
Maturity Type : Limit Maturity
Maturity Date : 2039-01-05
Maturity Price : 25.00
Probability of Maturity : 100.00 %
Recursions 1
|
| BCE.PR.S |
Ratchet |
-1.83 % |
Yield-to-Worst (at Bid) : 7.78 %
Maturity Type : Limit Maturity
Maturity Date : 2039-01-05
Maturity Price : 25.00
Probability of Maturity : 100.00 %
Recursions 1
|
| NA.PR.N |
FixedReset |
-1.80 % |
Yield-to-Worst (at Bid) : 5.11 %
Maturity Type : Limit Maturity
Maturity Date : 2039-01-05
Maturity Price : 21.25
Probability of Maturity : 100.00 %
Recursions 1
|
| BNA.PR.C |
SplitShare |
-1.78 % |
Yield-to-Worst (at Bid) : 19.39 %
Maturity Type : Hard Maturity
Maturity Date : 2019-01-10
Maturity Price : 25.00
Probability of Maturity : 100.00 %
Recursions 2
|
| RY.PR.H |
Perpetual-Discount |
-1.37 % |
Yield-to-Worst (at Bid) : 6.90 %
Maturity Type : Limit Maturity
Maturity Date : 2039-01-05
Maturity Price : 20.82
Probability of Maturity : 100.00 %
Recursions 1
|
| RY.PR.I |
FixedReset |
-1.32 % |
Yield-to-Worst (at Bid) : 4.71 %
Maturity Type : Limit Maturity
Maturity Date : 2039-01-05
Maturity Price : 22.36
Probability of Maturity : 89.88 %
Recursions 1
|
| PWF.PR.M |
FixedReset |
-1.19 % |
Yield-to-Worst (at Bid) : 5.42 %
Maturity Type : Limit Maturity
Maturity Date : 2039-01-05
Maturity Price : 24.85
Probability of Maturity : 61.44 %
Recursions 1
|
| NA.PR.M |
Perpetual-Discount |
-1.18 % |
Yield-to-Worst (at Bid) : 7.29 %
Maturity Type : Limit Maturity
Maturity Date : 2039-01-05
Maturity Price : 21.00
Probability of Maturity : 100.00 %
Recursions 1
|
| GWO.PR.J |
FixedReset |
-1.00 % |
Yield-to-Worst (at Bid) : 5.34 %
Maturity Type : Limit Maturity
Maturity Date : 2039-01-05
Maturity Price : 24.70
Probability of Maturity : 63.44 %
Recursions 1
|
| BMO.PR.L |
Perpetual-Discount |
1.02 % |
Yield-to-Worst (at Bid) : 7.13 %
Maturity Type : Limit Maturity
Maturity Date : 2039-01-05
Maturity Price : 20.71
Probability of Maturity : 100.00 %
Recursions 1
|
| IAG.PR.C |
FixedReset |
1.03 % |
Yield-to-Worst (at Bid) : 5.70 %
Maturity Type : Limit Maturity
Maturity Date : 2039-01-05
Maturity Price : 24.45
Probability of Maturity : 66.78 %
Recursions 1
|
| ALB.PR.A |
SplitShare |
1.05 % |
Yield-to-Worst (at Bid) : 15.61 %
Maturity Type : Hard Maturity
Maturity Date : 2011-02-28
Maturity Price : 25.00
Probability of Maturity : 100.00 %
Recursions 2
|
| TD.PR.S |
FixedReset |
1.10 % |
Yield-to-Worst (at Bid) : 4.38 %
Maturity Type : Limit Maturity
Maturity Date : 2039-01-05
Maturity Price : 22.10
Probability of Maturity : 91.53 %
Recursions 1
|
| BNS.PR.P |
FixedReset |
1.12 % |
Yield-to-Worst (at Bid) : 4.61 %
Maturity Type : Limit Maturity
Maturity Date : 2039-01-05
Maturity Price : 22.43
Probability of Maturity : 88.82 %
Recursions 1
|
| CM.PR.D |
Perpetual-Discount |
1.13 % |
Yield-to-Worst (at Bid) : 7.31 %
Maturity Type : Limit Maturity
Maturity Date : 2039-01-05
Maturity Price : 19.75
Probability of Maturity : 100.00 %
Recursions 1
|
| CM.PR.R |
OpRet |
1.15 % |
Yield-to-Worst (at Bid) : 4.52 %
Maturity Type : Soft Maturity
Maturity Date : 2013-04-29
Maturity Price : 25.15
Probability of Maturity : 70.66 %
Recursions 2
|
| ELF.PR.F |
Perpetual-Discount |
1.16 % |
Yield-to-Worst (at Bid) : 8.52 %
Maturity Type : Limit Maturity
Maturity Date : 2039-01-05
Maturity Price : 15.68
Probability of Maturity : 100.00 %
Recursions 1
|
| TD.PR.O |
Perpetual-Discount |
1.17 % |
Yield-to-Worst (at Bid) : 6.53 %
Maturity Type : Limit Maturity
Maturity Date : 2039-01-05
Maturity Price : 18.98
Probability of Maturity : 100.00 %
Recursions 1
|
| POW.PR.C |
Perpetual-Discount |
1.19 % |
Yield-to-Worst (at Bid) : 7.14 %
Maturity Type : Limit Maturity
Maturity Date : 2039-01-05
Maturity Price : 20.45
Probability of Maturity : 100.00 %
Recursions 1
|
| TD.PR.R |
Perpetual-Discount |
1.24 % |
Yield-to-Worst (at Bid) : 6.74 %
Maturity Type : Limit Maturity
Maturity Date : 2039-01-05
Maturity Price : 21.22
Probability of Maturity : 100.00 %
Recursions 1
|
| POW.PR.D |
Perpetual-Discount |
1.29 % |
Yield-to-Worst (at Bid) : 7.27 %
Maturity Type : Limit Maturity
Maturity Date : 2039-01-05
Maturity Price : 17.31
Probability of Maturity : 100.00 %
Recursions 1
|
| CM.PR.A |
OpRet |
1.29 % |
Yield-to-Worst (at Bid) : -15.68 %
Maturity Type : Soft Maturity
Maturity Date : 2011-07-30
Maturity Price : 25.00
Probability of Maturity : 63.75 %
Recursions 2
|
| CM.PR.I |
Perpetual-Discount |
1.32 % |
Yield-to-Worst (at Bid) : 6.99 %
Maturity Type : Limit Maturity
Maturity Date : 2039-01-05
Maturity Price : 16.87
Probability of Maturity : 100.00 %
Recursions 1
|
| TD.PR.M |
OpRet |
1.33 % |
Yield-to-Worst (at Bid) : 4.13 %
Maturity Type : Soft Maturity
Maturity Date : 2013-10-30
Maturity Price : 25.00
Probability of Maturity : 71.57 %
Recursions 2
|
| LBS.PR.A |
SplitShare |
1.37 % |
Yield-to-Worst (at Bid) : 10.14 %
Maturity Type : Hard Maturity
Maturity Date : 2013-11-29
Maturity Price : 10.00
Probability of Maturity : 100.00 %
Recursions 2
|
| BNS.PR.O |
Perpetual-Discount |
1.57 % |
Yield-to-Worst (at Bid) : 6.77 %
Maturity Type : Limit Maturity
Maturity Date : 2039-01-05
Maturity Price : 20.75
Probability of Maturity : 100.00 %
Recursions 1
|
| BNS.PR.J |
Perpetual-Discount |
1.58 % |
Yield-to-Worst (at Bid) : 6.60 %
Maturity Type : Limit Maturity
Maturity Date : 2039-01-05
Maturity Price : 19.96
Probability of Maturity : 100.00 %
Recursions 1
|
| CM.PR.E |
Perpetual-Discount |
1.60 % |
Yield-to-Worst (at Bid) : 7.15 %
Maturity Type : Limit Maturity
Maturity Date : 2039-01-05
Maturity Price : 19.66
Probability of Maturity : 100.00 %
Recursions 1
|
| STW.PR.A |
InterestBearing |
1.65 % |
Yield-to-Worst (at Bid) : 14.26 %
Maturity Type : Hard Maturity
Maturity Date : 2009-12-31
Maturity Price : 10.00
Probability of Maturity : 100.00 %
Recursions 2
|
| ENB.PR.A |
Perpetual-Discount |
1.65 % |
Yield-to-Worst (at Bid) : 5.79 %
Maturity Type : Limit Maturity
Maturity Date : 2039-01-05
Maturity Price : 23.69
Probability of Maturity : 72.97 %
Recursions 1
|
| DFN.PR.A |
SplitShare |
1.66 % |
Yield-to-Worst (at Bid) : 7.08 %
Maturity Type : Hard Maturity
Maturity Date : 2014-12-01
Maturity Price : 10.00
Probability of Maturity : 100.00 %
Recursions 2
|
| PWF.PR.L |
Perpetual-Discount |
1.69 % |
Yield-to-Worst (at Bid) : 7.46 %
Maturity Type : Limit Maturity
Maturity Date : 2039-01-05
Maturity Price : 17.50
Probability of Maturity : 100.00 %
Recursions 1
|
| PWF.PR.G |
Perpetual-Discount |
1.76 % |
Yield-to-Worst (at Bid) : 7.46 %
Maturity Type : Limit Maturity
Maturity Date : 2039-01-05
Maturity Price : 20.26
Probability of Maturity : 100.00 %
Recursions 1
|
| PWF.PR.H |
Perpetual-Discount |
1.79 % |
Yield-to-Worst (at Bid) : 7.42 %
Maturity Type : Limit Maturity
Maturity Date : 2039-01-05
Maturity Price : 19.85
Probability of Maturity : 100.00 %
Recursions 1
|
| CU.PR.B |
Perpetual-Discount |
1.82 % |
Yield-to-Worst (at Bid) : 6.80 %
Maturity Type : Limit Maturity
Maturity Date : 2039-01-05
Maturity Price : 22.23
Probability of Maturity : 91.71 %
Recursions 1
|
| TCA.PR.X |
Perpetual-Discount |
1.83 % |
Yield-to-Worst (at Bid) : 6.65 %
Maturity Type : Limit Maturity
Maturity Date : 2039-01-05
Maturity Price : 42.26
Probability of Maturity : 100.00 %
Recursions 1
|
| RY.PR.F |
Perpetual-Discount |
1.86 % |
Yield-to-Worst (at Bid) : 6.46 %
Maturity Type : Limit Maturity
Maturity Date : 2039-01-05
Maturity Price : 17.52
Probability of Maturity : 100.00 %
Recursions 1
|
| RY.PR.E |
Perpetual-Discount |
1.96 % |
Yield-to-Worst (at Bid) : 6.46 %
Maturity Type : Limit Maturity
Maturity Date : 2039-01-05
Maturity Price : 17.70
Probability of Maturity : 100.00 %
Recursions 1
|
| SBN.PR.A |
SplitShare |
1.97 % |
Yield-to-Worst (at Bid) : 6.73 %
Maturity Type : Hard Maturity
Maturity Date : 2014-12-01
Maturity Price : 10.00
Probability of Maturity : 100.00 %
Recursions 2
|
| CM.PR.H |
Perpetual-Discount |
2.04 % |
Yield-to-Worst (at Bid) : 7.09 %
Maturity Type : Limit Maturity
Maturity Date : 2039-01-05
Maturity Price : 17.00
Probability of Maturity : 100.00 %
Recursions 1
|
| W.PR.H |
Perpetual-Discount |
2.06 % |
Yield-to-Worst (at Bid) : 7.99 %
Maturity Type : Limit Maturity
Maturity Date : 2039-01-05
Maturity Price : 17.35
Probability of Maturity : 100.00 %
Recursions 1
|
| TD.PR.Y |
FixedReset |
2.06 % |
Yield-to-Worst (at Bid) : 4.60 %
Maturity Type : Limit Maturity
Maturity Date : 2039-01-05
Maturity Price : 21.71
Probability of Maturity : 94.06 %
Recursions 1
|
| CL.PR.B |
Perpetual-Discount |
2.12 % |
Yield-to-Worst (at Bid) : 7.28 %
Maturity Type : Limit Maturity
Maturity Date : 2039-01-05
Maturity Price : 21.70
Probability of Maturity : 100.00 %
Recursions 1
|
| BAM.PR.H |
OpRet |
2.24 % |
Yield-to-Worst (at Bid) : 12.86 %
Maturity Type : Soft Maturity
Maturity Date : 2012-03-30
Maturity Price : 25.00
Probability of Maturity : 100.00 %
Recursions 2
|
| IAG.PR.A |
Perpetual-Discount |
2.36 % |
Yield-to-Worst (at Bid) : 7.45 %
Maturity Type : Limit Maturity
Maturity Date : 2039-01-05
Maturity Price : 15.61
Probability of Maturity : 100.00 %
Recursions 1
|
| BCE.PR.R |
FixedFloater |
2.41 % |
Yield-to-Worst (at Bid) : 7.73 %
Maturity Type : Limit Maturity
Maturity Date : 2039-01-05
Maturity Price : 25.00
Probability of Maturity : 100.00 %
Recursions 1
|
| RY.PR.D |
Perpetual-Discount |
2.45 % |
Yield-to-Worst (at Bid) : 6.37 %
Maturity Type : Limit Maturity
Maturity Date : 2039-01-05
Maturity Price : 17.95
Probability of Maturity : 100.00 %
Recursions 1
|
| MFC.PR.C |
Perpetual-Discount |
2.57 % |
Yield-to-Worst (at Bid) : 6.34 %
Maturity Type : Limit Maturity
Maturity Date : 2039-01-05
Maturity Price : 17.95
Probability of Maturity : 100.00 %
Recursions 1
|
| POW.PR.B |
Perpetual-Discount |
2.59 % |
Yield-to-Worst (at Bid) : 7.09 %
Maturity Type : Limit Maturity
Maturity Date : 2039-01-05
Maturity Price : 19.00
Probability of Maturity : 100.00 %
Recursions 1
|
| FIG.PR.A |
InterestBearing |
2.67 % |
Yield-to-Worst (at Bid) : 13.00 %
Maturity Type : Hard Maturity
Maturity Date : 2014-12-31
Maturity Price : 10.00
Probability of Maturity : 100.00 %
Recursions 2
|
| PWF.PR.E |
Perpetual-Discount |
2.70 % |
Yield-to-Worst (at Bid) : 7.41 %
Maturity Type : Limit Maturity
Maturity Date : 2039-01-05
Maturity Price : 19.00
Probability of Maturity : 100.00 %
Recursions 1
|
| TRI.PR.B |
Floater |
2.73 % |
Yield-to-Worst (at Bid) : 5.46 %
Maturity Type : Limit Maturity
Maturity Date : 2039-01-05
Maturity Price : 11.30
Probability of Maturity : 100.00 %
Recursions 1
|
| HSB.PR.C |
Perpetual-Discount |
2.82 % |
Yield-to-Worst (at Bid) : 7.22 %
Maturity Type : Limit Maturity
Maturity Date : 2039-01-05
Maturity Price : 17.85
Probability of Maturity : 100.00 %
Recursions 1
|
| WFS.PR.A |
SplitShare |
2.84 % |
Yield-to-Worst (at Bid) : 9.71 %
Maturity Type : Hard Maturity
Maturity Date : 2011-06-30
Maturity Price : 10.00
Probability of Maturity : 100.00 %
Recursions 2
|
| BCE.PR.I |
FixedFloater |
2.99 % |
Yield-to-Worst (at Bid) : 7.55 %
Maturity Type : Limit Maturity
Maturity Date : 2039-01-05
Maturity Price : 25.00
Probability of Maturity : 100.00 %
Recursions 1
|
| NA.PR.K |
Perpetual-Discount |
3.10 % |
Yield-to-Worst (at Bid) : 7.36 %
Maturity Type : Limit Maturity
Maturity Date : 2039-01-05
Maturity Price : 20.28
Probability of Maturity : 100.00 %
Recursions 1
|
| GWO.PR.I |
Perpetual-Discount |
3.16 % |
Yield-to-Worst (at Bid) : 7.26 %
Maturity Type : Limit Maturity
Maturity Date : 2039-01-05
Maturity Price : 15.66
Probability of Maturity : 100.00 %
Recursions 1
|
| TCA.PR.Y |
Perpetual-Discount |
3.23 % |
Yield-to-Worst (at Bid) : 6.45 %
Maturity Type : Limit Maturity
Maturity Date : 2039-01-05
Maturity Price : 42.87
Probability of Maturity : 94.43 %
Recursions 1
|
| PWF.PR.K |
Perpetual-Discount |
3.35 % |
Yield-to-Worst (at Bid) : 7.20 %
Maturity Type : Limit Maturity
Maturity Date : 2039-01-05
Maturity Price : 17.58
Probability of Maturity : 100.00 %
Recursions 1
|
| BCE.PR.G |
FixedFloater |
3.39 % |
Yield-to-Worst (at Bid) : 7.42 %
Maturity Type : Limit Maturity
Maturity Date : 2039-01-05
Maturity Price : 25.00
Probability of Maturity : 100.00 %
Recursions 1
|
| CM.PR.K |
FixedReset |
3.45 % |
Yield-to-Worst (at Bid) : 4.90 %
Maturity Type : Limit Maturity
Maturity Date : 2039-01-05
Maturity Price : 21.95
Probability of Maturity : 89.08 %
Recursions 1
|
| BNS.PR.N |
Perpetual-Discount |
3.54 % |
Yield-to-Worst (at Bid) : 6.42 %
Maturity Type : Limit Maturity
Maturity Date : 2039-01-05
Maturity Price : 20.50
Probability of Maturity : 100.00 %
Recursions 1
|
| CU.PR.A |
Perpetual-Discount |
3.57 % |
Yield-to-Worst (at Bid) : 6.66 %
Maturity Type : Limit Maturity
Maturity Date : 2039-01-05
Maturity Price : 21.78
Probability of Maturity : 94.25 %
Recursions 1
|
| BNS.PR.M |
Perpetual-Discount |
3.76 % |
Yield-to-Worst (at Bid) : 6.39 %
Maturity Type : Limit Maturity
Maturity Date : 2039-01-05
Maturity Price : 17.66
Probability of Maturity : 100.00 %
Recursions 1
|
| NA.PR.L |
Perpetual-Discount |
3.84 % |
Yield-to-Worst (at Bid) : 7.27 %
Maturity Type : Limit Maturity
Maturity Date : 2039-01-05
Maturity Price : 17.02
Probability of Maturity : 100.00 %
Recursions 1
|
| BCE.PR.Y |
Ratchet |
4.04 % |
Yield-to-Worst (at Bid) : 7.82 %
Maturity Type : Limit Maturity
Maturity Date : 2039-01-05
Maturity Price : 25.00
Probability of Maturity : 100.00 %
Recursions 1
|
| BCE.PR.Z |
FixedFloater |
4.11 % |
Yield-to-Worst (at Bid) : 8.13 %
Maturity Type : Limit Maturity
Maturity Date : 2039-01-05
Maturity Price : 25.00
Probability of Maturity : 100.00 %
Recursions 1
|
| CIU.PR.A |
Perpetual-Discount |
4.14 % |
Yield-to-Worst (at Bid) : 7.50 %
Maturity Type : Limit Maturity
Maturity Date : 2039-01-05
Maturity Price : 15.61
Probability of Maturity : 100.00 %
Recursions 1
|
| LFE.PR.A |
SplitShare |
4.24 % |
Yield-to-Worst (at Bid) : 7.28 %
Maturity Type : Hard Maturity
Maturity Date : 2012-12-01
Maturity Price : 10.00
Probability of Maturity : 100.00 %
Recursions 2
|
| BNS.PR.L |
Perpetual-Discount |
4.29 % |
Yield-to-Worst (at Bid) : 6.27 %
Maturity Type : Limit Maturity
Maturity Date : 2039-01-05
Maturity Price : 18.00
Probability of Maturity : 100.00 %
Recursions 1
|
| BAM.PR.I |
OpRet |
4.35 % |
Yield-to-Worst (at Bid) : 11.03 %
Maturity Type : Soft Maturity
Maturity Date : 2013-12-30
Maturity Price : 25.00
Probability of Maturity : 100.00 %
Recursions 2
|
| POW.PR.A |
Perpetual-Discount |
4.41 % |
Yield-to-Worst (at Bid) : 7.18 %
Maturity Type : Limit Maturity
Maturity Date : 2039-01-05
Maturity Price : 19.64
Probability of Maturity : 100.00 %
Recursions 1
|
| BMO.PR.M |
FixedReset |
4.46 % |
Yield-to-Worst (at Bid) : 4.33 %
Maturity Type : Limit Maturity
Maturity Date : 2039-01-05
Maturity Price : 22.45
Probability of Maturity : 88.92 %
Recursions 1
|
| W.PR.J |
Perpetual-Discount |
4.63 % |
Yield-to-Worst (at Bid) : 8.01 %
Maturity Type : Limit Maturity
Maturity Date : 2039-01-05
Maturity Price : 17.61
Probability of Maturity : 100.00 %
Recursions 1
|
| FBS.PR.B |
SplitShare |
4.69 % |
Yield-to-Worst (at Bid) : 11.13 %
Maturity Type : Hard Maturity
Maturity Date : 2011-12-15
Maturity Price : 10.00
Probability of Maturity : 100.00 %
Recursions 2
|
| BAM.PR.N |
Perpetual-Discount |
4.73 % |
Yield-to-Worst (at Bid) : 10.67 %
Maturity Type : Limit Maturity
Maturity Date : 2039-01-05
Maturity Price : 11.30
Probability of Maturity : 100.00 %
Recursions 1
|
| PWF.PR.I |
Perpetual-Discount |
4.74 % |
Yield-to-Worst (at Bid) : 7.40 %
Maturity Type : Limit Maturity
Maturity Date : 2039-01-05
Maturity Price : 20.76
Probability of Maturity : 100.00 %
Recursions 1
|
| DF.PR.A |
SplitShare |
5.10 % |
Yield-to-Worst (at Bid) : 7.76 %
Maturity Type : Hard Maturity
Maturity Date : 2014-12-01
Maturity Price : 10.00
Probability of Maturity : 100.00 %
Recursions 2
|
| ELF.PR.G |
Perpetual-Discount |
5.43 % |
Yield-to-Worst (at Bid) : 8.11 %
Maturity Type : Limit Maturity
Maturity Date : 2039-01-05
Maturity Price : 14.76
Probability of Maturity : 100.00 %
Recursions 1
|
| BAM.PR.B |
Floater |
5.74 % |
Yield-to-Worst (at Bid) : 5.99 %
Maturity Type : Limit Maturity
Maturity Date : 2039-01-05
Maturity Price : 10.31
Probability of Maturity : 100.00 %
Recursions 1
|
| BAM.PR.J |
OpRet |
5.83 % |
Yield-to-Worst (at Bid) : 10.90 %
Maturity Type : Soft Maturity
Maturity Date : 2018-03-30
Maturity Price : 25.00
Probability of Maturity : 100.00 %
Recursions 2
|
| PPL.PR.A |
SplitShare |
6.59 % |
Yield-to-Worst (at Bid) : 8.36 %
Maturity Type : Hard Maturity
Maturity Date : 2012-12-01
Maturity Price : 10.00
Probability of Maturity : 100.00 %
Recursions 2
|
| PWF.PR.A |
Floater |
6.67 % |
Yield-to-Worst (at Bid) : 5.17 %
Maturity Type : Limit Maturity
Maturity Date : 2039-01-05
Maturity Price : 12.00
Probability of Maturity : 100.00 %
Recursions 1
|
| BAM.PR.M |
Perpetual-Discount |
7.42 % |
Yield-to-Worst (at Bid) : 10.53 %
Maturity Type : Limit Maturity
Maturity Date : 2039-01-05
Maturity Price : 11.44
Probability of Maturity : 100.00 %
Recursions 1
|
| BAM.PR.G |
FixedFloater |
9.65 % |
Yield-to-Worst (at Bid) : 10.26 %
Maturity Type : Limit Maturity
Maturity Date : 2039-01-05
Maturity Price : 25.00
Probability of Maturity : 100.00 %
Recursions 1
|
| PWF.PR.F |
Perpetual-Discount |
11.24 % |
Yield-to-Worst (at Bid) : 6.81 %
Maturity Type : Limit Maturity
Maturity Date : 2039-01-05
Maturity Price : 19.70
Probability of Maturity : 100.00 %
Recursions 1
|
| BAM.PR.K |
Floater |
13.15 % |
Yield-to-Worst (at Bid) : 5.88 %
Maturity Type : Limit Maturity
Maturity Date : 2039-01-05
Maturity Price : 10.50
Probability of Maturity : 100.00 %
Recursions 1
|